Energy Efficient Motor Market Report
RA09237
Energy Efficient Motor Market by Type (Super Premium-IE4, Premium-IE3, High-IE2, and Standard-IE1), Product Type (AC Motor and DC Motor), Application (Pumps, Fans, Compressed Air, Refrigeration, Material Handling, and Material Processing), End User (Industrial, Commercial, Residential, Agriculture Sector, and Others), and Region (North America, Europe, Asia-Pacific, and LAMEA): Global Opportunity Analysis and Industry Forecast, 2023-2032
Energy Efficient Motor Overview
Energy-efficient motors stand out due to their incorporation of advanced materials and enhanced production processes. By leveraging these features, these motors provide several advantages, including higher service factors, reduced waste heat production, extended bearing life, minimal maintenance expenses, and decreased vibration levels. These characteristics contribute to overall improved efficiency by curbing losses that typically account for 3-6% of the energy consumed by the motor.
The energy-efficient motor consumes less energy, operates cooler, and lasts longer than standard motors. This type of motor has more copper windings than a regular motor and is 2-6% more efficient. The motor creates less noise and vibration and operates at a lower temperature, extending the motor's life and lowering maintenance costs. It can be used in a variety of industries, including industrial, commercial building, residential, automotive, and others.
Global Energy Efficient Motor Market Analysis
The global energy efficient motor market size was $48,530.0 million in 2022 and is predicted to grow with a CAGR of 9.5%, by generating a revenue of $119,052.6 million by 2032.

Source: Research Dive Analysis
COVID-19 Impact on Global Energy Efficient Motor Market
The COVID-19 pandemic had a significant impact on the energy-efficient motor market due to supply chain disruptions and reduced industrial activities. However, as industries adapted to the new normal, there was a resurgence in demand for energy-efficient motors, driven by sustainability goals and cost savings. Manufacturers focused on innovation and digitalization to meet evolving market needs, ultimately leading to a more resilient and sustainable industry.
The energy efficient motor market witnessed a significant growth in the post-COVID-19 period. Increased emphasis on sustainability and energy conservation drove demand for energy-efficient motors in various industries. Adoption of green technologies and government incentives further accelerated market growth. Manufacturers focused on innovative designs and technologies to meet these demands, fostering a robust and sustainable market outlook.
Environmental Regulations and Sustainability Initiatives of to Drive the Market Growth
Governments and regulatory organizations throughout the world are enacting severe energy efficiency standards and regulations in order to minimize greenhouse gas emissions and battle climate change. Energy-efficient motors assist industries and enterprises in fulfilling regulatory standards while also contributing to environmental sustainability. Governments set minimum energy efficiency criteria for motors, requiring manufacturers to produce motors that achieve or exceed particular efficiency levels. These regulations can serve to direct the industry toward more energy-efficient motors and make them more readily available. Governments are also implementing education and outreach activities to create knowledge regarding the benefits of energy-efficient motors and how they may be integrated into various industries This can involve training programs for engineers and technicians on how to install and operate energy-efficient motors, as well as public awareness efforts to promote their usage. Governments develop energy efficiency programs that give technical support and resources to companies and individuals wishing to adopt energy efficient technologies. These programs assist in identifying energy-saving possibilities, providing advice on selecting the optimum motor for a specific application, and providing options for financing to help cover the upfront expenses of new equipment. All these factors projected to drive the energy efficient motor market growth.
High Cost of Energy Efficient Motor to Restrain the Market Growth
Energy-efficient motors may have greater upfront costs than ordinary motors. This may be difficult for organizations and customers, especially in price-sensitive industries or for those with limited funds for equipment upgrades. Energy-efficient motors need higher-quality materials, more modern manufacturing techniques, and additional testing and certification to assure their efficiency. This increases manufacturing expenses, resulting in a higher price for the end user. In general, energy-efficient motors cost 20% more than ordinary motors, however this varies depending on the individual motor manufacturer and their competitiveness in the market. Some purchasers may not be aware regarding the benefits of energy-efficient motors and may be unable to pay a premium for a technology they do not fully understand.
Growing Industrialization and Decarbonization Efforts to Drive Excellent Opportunities
Global industrialization has raised the demand for energy-efficient motors. As new industries emerge and current ones develop, the demand for motors that can minimize energy consumption and operating costs has become critical. Energy efficiency motors have better efficiency and lower energy loss, which connects to considerable cost savings during the motor's lifespan. This has resulted in an increase in demand for energy-efficient motors in a variety of industries, including manufacturing, agriculture, construction, and transportation. The worldwide effort toward decarbonization additionally contributes to the energy efficiency motor market growth. Governments and organizations all around the globe have passed regulations and measures that reduce carbon emissions and avoid climate change. Energy efficiency motors play a critical role in achieving these goals by lowering the energy consumption and carbon footprint of industrial operations. Using energy-efficient motors is as a pivotal milestone in realizing the energy transition, which entails a shift from fossil fuels to renewable energy sources. Rising industrialization and decarbonization activities have produced a favorable market for energy efficiency motor. The market is expected to continue its growth trajectory as more industries adopt energy-efficient practices and the push towards decarbonization intensifies. This presents a significant opportunity for companies operating in the energy efficiency motor market share to expand their business and contribute to a more sustainable future.
Global Energy Efficient Motor Market Share, by Type, 2022

Source: Research Dive Analysis
The super premium-IE4 sub-segment accounted for the highest market share in 2022. The increased price of IE4 Motor is due to the use of high-quality materials and the optimization of assembly and design of these Motor to achieve better efficiency. Furthermore, the rotors of these Motor use larger-diameter copper wires and a greater quantity of aluminum to decrease resistance losses. To decrease winding losses, an upgraded cooling fan is also used. The use of high-quality, costly components raises the overall cost of these motors. .
Global Energy Efficient Motor Market Share, by Product Type, 2022

Source: Research Dive Analysis
The AC motor sub-segment accounted for the highest market share in 2022. The increasing emphasis on energy conservation and sustainability has prompted industries and consumers to adopt more efficient electrical systems. AC Motor, renowned for their reliability and versatility, play a pivotal role in various applications, from industrial machinery to HVAC systems and appliances. In addition, stringent government regulations and energy efficiency standards have incentivized the adoption of AC motor with higher efficiency ratings, thereby reducing energy consumption and operational costs. Technological advancements, such as the development of variable frequency drives (VFDs) and smart motor systems, have further enhanced the efficiency and control of AC motor. As the global push for energy efficiency continues, the AC motor segment is poised for sustained growth in the energy-efficient motor market.
Global Energy Efficient Motor Market Share, by Application, 2022
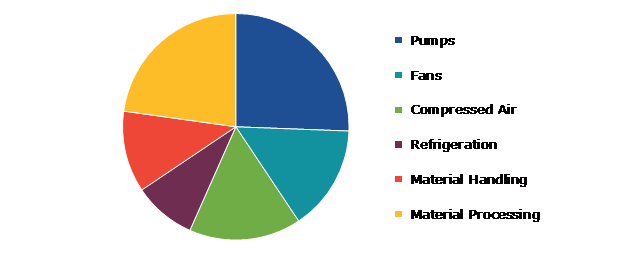
Source: Research Dive Analysis
The pumps sub-segment accounted for the highest market share in 2022. A pump is a mechanical device that converts electrical energy into hydraulic energy to push fluids or slurries. Energy can be saved by reducing friction losses by adjusting pipe diameters. The flow, pipe size, overall pipe length, pipe characteristics (surface roughness, material, etc.), and fluid parameters all influence the amount of frictional power required. The increased awareness regarding environmental concerns and the need for sustainable solutions has prompted industries to adopt energy-efficient pumps driven by the energy efficient motors. These motors offer superior energy utilization, reducing operational costs and carbon footprints. In addition, stringent energy efficiency regulations and government incentives have further incentivized the adoption of these motors in various applications, including water treatment, HVAC systems, and industrial processes. All these factors are projected to drive the segment growth during the forecast period.
Global Energy Efficient Motor Market Share, by End User, 2022

Source: Research Dive Analysis
The industrial sub-segment accounted for the highest market share in 2022. The industrial sector is leading the way in this regard as it is the most significant user of the energy efficient motors, accounting for a sizable percentage of the market. This trend is going to continue as more industries strive to decrease energy use and enhance efficiency. This is primarily because energy-efficient motors find extensive use in industrial applications. As industries increasingly automate their processes, the demand for these motors rises. Energy-efficient motors enable industries to achieve significant electricity savings. In addition, government's emphasis on the industrial sector to reduce power consumption is expected to further boost the growth of this segment. Motor.
Global Energy Efficient Motor Market Size & Forecast, by Region, 2022-2032 ($Million)

Source: Research Dive Analysis
The North America energy efficient motor market generated the highest revenue in 2022. North America holds the greatest market share for energy-efficient motor due to rising energy costs and concerns about energy efficiency. This is because there is a greater emphasis on high-efficiency motors that consume less electricity. The market share of the region reflects the significant reliance of the industrial, automotive, and agricultural sectors on energy-efficient motors for a range of operations. Energy-efficient motors are in extremely high demand throughout the region owing to the increasing need for high-efficiency electrical equipment to operate effectively. The growth of the North America energy efficient motor market is mainly attributed to the key players in the U.S. and Canada.
Competitive Scenario in the Global Energy Efficient Motor Market
Investment and agreement are common strategies followed by major market players. One of the leading market players in the industry is ABB. ABB offers a wide range of energy-efficient electric motors, including induction motor, synchronous motor, and permanent magnet motor. These motors are designed for various applications and industries, from manufacturing to transportation. For instance, in April 2022, The ABB launched IE5 SynRM (Synchronous Reluctance Motor) series, which provides great energy efficiency and reduced maintenance needs. This motor reaches outstanding efficiency levels by utilizing sophisticated rotor design and magnet-free technology.

Source: Research Dive Analysis
Some of the companies operating in the energy efficient motor market are ABB Ltd, Crompton Greaves, General Electric, Honeywell International, Inc., Kirlosakar Electric Company, Ltd, Microchip Technology, Inc., Magneteck, Inc., Johnson Controls Inc., Simens AG, and Weg S.A.
| Aspect | Particulars |
| Historical Market Estimations | 2020-2021 |
| Base Year for Market Estimation | 2022 |
| Forecast Timeline for Market Projection | 2023-2032 |
| Geographical Scope | North America, Europe, Asia-Pacific, and LAMEA |
| Segmentation by Type |
|
| Segmentation by Product Type |
|
|
Segmentation by Application
|
|
|
Segmentation by End User
|
|
| Key Companies Profiled |
|
Q1. What is the size of the global energy efficient motor market?
A. The size of the global energy efficient motor market size was over $48,530.0 million in 2022 and is projected to reach $1,19,052.6 million by 2032.
Q2. Which are the major companies in the energy efficient motor market?
A. ABB Ltd, Crompton Greaves, General Electric, and Honeywell International, Inc. are some of the key players in the global energy efficient motor market.
Q3. Which region, among others, possesses greater investment opportunities in the future?
A. Asia-Pacific possesses great investment opportunities for investors in the future.
Q4. What will be the growth rate of the Asia-Pacific energy efficient motor market?
A. The Asia-Pacific energy efficient motor market share is anticipated to grow at 12.2% CAGR during the forecast period.
Q5. What are the strategies opted by the leading players in this market?
A. Agreement and investment are the two key strategies opted by the operating companies in this market.
Q6. Which companies are investing more on R&D practices?
A. ABB Ltd, Crompton Greaves, General Electric, and Honeywell International, Inc. are the companies investing more on R&D activities for developing new products and technologies.
1. Research Methodology
1.1. Desk Research
1.2. Real time insights and validation
1.3. Forecast model
1.4. Assumptions and forecast parameters
1.5. Market size estimation
1.5.1. Top-down approach
1.5.2. Bottom-up approach
2. Report Scope
2.1. Market definition
2.2. Key objectives of the study
2.3. Report overview
2.4. Market segmentation
2.5. Overview of the impact of COVID-19 on global energy efficient motor market
3. Executive Summary
4. Market Overview
4.1. Introduction
4.2. Growth impact forces
4.2.1. Drivers
4.2.2. Restraints
4.2.3. Opportunities
4.3. Market value chain analysis
4.3.1. List of raw material suppliers
4.3.2. List of manufacturers
4.3.3. List of distributors
4.4. Innovation & sustainability matrices
4.4.1. Technology matrix
4.4.2. Regulatory matrix
4.5. Porter’s five forces analysis
4.5.1. Bargaining power of suppliers
4.5.2. Bargaining power of consumers
4.5.3. Threat of substitutes
4.5.4. Threat of new entrants
4.5.5. Competitive rivalry intensity
4.6. PESTLE analysis
4.6.1. Political
4.6.2. Economical
4.6.3. Social
4.6.4. Technological
4.6.5. Environmental
4.7. Impact of COVID-19 on energy efficient motors market
4.7.1. Pre-covid market scenario
4.7.2. Post-covid market scenario
5. Energy Efficient Motor Market Analysis, by Type
5.1. Overview
5.2. Super Premium-IE4
5.2.1. Definition, key trends, growth factors, and opportunities
5.2.2. Market size analysis, by region, 2022-2032
5.2.3. Market share analysis, by country, 2022-2032
5.3. Premium-IE3
5.3.1. Definition, key trends, growth factors, and opportunities
5.3.2. Market size analysis, by region, 2022-2032
5.3.3. Market share analysis, by country, 2022-2032
5.4. High-IE2
5.4.1. Definition, key trends, growth factors, and opportunities
5.4.2. Market size analysis, by region, 2022-2032
5.4.3. Market share analysis, by country, 2022-2032
5.5. Standard-IE1
5.5.1. Definition, key trends, growth factors, and opportunities
5.5.2. Market size analysis, by region, 2022-2032
5.5.3. Market share analysis, by country, 2022-2032
5.6. Research Dive Exclusive Insights
5.6.1. Market attractiveness
5.6.2. Competition heatmap
6. Energy Efficient Motor Market Analysis, by Product Type
6.1. AC Motor
6.1.1. Definition, key trends, growth factors, and opportunities
6.1.2. Market size analysis, by region, 2022-2032
6.1.3. Market share analysis, by country, 2022-2032
6.2. DC Motor
6.2.1. Definition, key trends, growth factors, and opportunities
6.2.2. Market size analysis, by region, 2022-2032
6.2.3. Market share analysis, by country, 2022-2032
6.3. Research Dive Exclusive Insights
6.3.1. Market attractiveness
6.3.2. Competition heatmap
7. Energy Efficient Motors Market Analysis, by Application
7.1. Pumps
7.1.1. Definition, key trends, growth factors, and opportunities
7.1.2. Market size analysis, by region, 2022-2032
7.1.3. Market share analysis, by country, 2022-2032
7.2. Fans
7.2.1. Definition, key trends, growth factors, and opportunities
7.2.2. Market size analysis, by region, 2022-2032
7.2.3. Market share analysis, by country, 2022-2032
7.3. Compressed Air
7.3.1. Definition, key trends, growth factors, and opportunities
7.3.2. Market size analysis, by region, 2022-2032
7.3.3. Market share analysis, by country, 2022-2032
7.4. Refrigeration
7.4.1. Definition, key trends, growth factors, and opportunities
7.4.2. Market size analysis, by region, 2022-2032
7.4.3. Market share analysis, by country, 2022-2032
7.5. Material Handling
7.5.1. Definition, key trends, growth factors, and opportunities
7.5.2. Market size analysis, by region, 2022-2032
7.5.3. Market share analysis, by country, 2022-2032
7.6. Material Processing
7.6.1. Definition, key trends, growth factors, and opportunities
7.6.2. Market size analysis, by region, 2022-2032
7.6.3. Market share analysis, by country, 2022-2032
7.7. Research Dive Exclusive Insights
7.7.1. Market attractiveness
7.7.2. Competition heatmap
8. Energy Efficient Motors Market Analysis, by End User
8.1. Industrial
8.1.1. Definition, key trends, growth factors, and opportunities
8.1.2. Market size analysis, by region, 2022-2032
8.1.3. Market share analysis, by country, 2022-2032
8.2. Commercial
8.2.1. Definition, key trends, growth factors, and opportunities
8.2.2. Market size analysis, by region, 2022-2032
8.2.3. Market share analysis, by country, 2022-2032
8.3. Residential
8.3.1. Definition, key trends, growth factors, and opportunities
8.3.2. Market size analysis, by region, 2022-2032
8.3.3. Market share analysis, by country, 2022-2032
8.4. Agriculture Sector
8.4.1. Definition, key trends, growth factors, and opportunities
8.4.2. Market size analysis, by region, 2022-2032
8.4.3. Market share analysis, by country, 2022-2032
8.5. Others
8.5.1. Definition, key trends, growth factors, and opportunities
8.5.2. Market size analysis, by region, 2022-2032
8.5.3. Market share analysis, by country, 2022-2032
8.6. Research Dive Exclusive Insights
8.6.1. Market attractiveness
8.6.2. Competition heatmap
9. Energy Efficient Motors Market, by Region
9.1. North America
9.1.1. U.S.
9.1.1.1. Market size analysis, by Type, 2022-2032
9.1.1.2. Market size analysis, by Product Type, 2022-2032
9.1.1.3. Market size analysis, by Application, 2022-2032
9.1.1.4. Market size analysis, by End User, 2022-2032
9.1.2. Canada
9.1.2.1. Market size analysis, by Type, 2022-2032
9.1.2.2. Market size analysis, by Product Type, 2022-2032
9.1.2.3. Market size analysis, by Application, 2022-2032
9.1.2.4. Market size analysis, by End User, 2022-2032
9.1.3. Mexico
9.1.3.1. Market size analysis, by Type, 2022-2032
9.1.3.2. Market size analysis, by Product Type, 2022-2032
9.1.3.3. Market size analysis, by Application, 2022-2032
9.1.3.4. Market size analysis, by End User, 2022-2032
9.1.4. Research Dive Exclusive Insights
9.1.4.1. Market attractiveness
9.1.4.2. Competition heatmap
9.2. Europe
9.2.1. Germany
9.2.1.1. Market size analysis, by Type, 2022-2032
9.2.1.2. Market size analysis, by Product Type, 2022-2032
9.2.1.3. Market size analysis, by Application, 2022-2032
9.2.1.4. Market size analysis, by End User, 2022-2032
9.2.2. UK
9.2.2.1. Market size analysis, by Type, 2022-2032
9.2.2.2. Market size analysis, by Product Type, 2022-2032
9.2.2.3. Market size analysis, by Application, 2022-2032
9.2.2.4. Market size analysis, by End User, 2022-2032
9.2.3. France
9.2.3.1. Market size analysis, by Type, 2022-2032
9.2.3.2. Market size analysis, by Product Type, 2022-2032
9.2.3.3. Market size analysis, by Application, 2022-2032
9.2.3.4. Market size analysis, by End User, 2022-2032
9.2.4. Spain
9.2.4.1. Market size analysis, by Type, 2022-2032
9.2.4.2. Market size analysis, by Product Type, 2022-2032
9.2.4.3. Market size analysis, by Application, 2022-2032
9.2.4.4. Market size analysis, by End User, 2022-2032
9.2.5. Italy
9.2.5.1. Market size analysis, by Type, 2022-2032
9.2.5.2. Market size analysis, by Product Type, 2022-2032
9.2.5.3. Market size analysis, by Application, 2022-2032
9.2.5.4. Market size analysis, by End User, 2022-2032
9.2.6. Rest of Europe
9.2.6.1. Market size analysis, by Type, 2022-2032
9.2.6.2. Market size analysis, by Product Type, 2022-2032
9.2.6.3. Market size analysis, by Application, 2022-2032
9.2.6.4. Market size analysis, by End User, 2022-2032
9.2.7. Research Dive Exclusive Insights
9.2.7.1. Market attractiveness
9.2.7.2. Competition heatmap
9.3. Asia-Pacific
9.3.1. China
9.3.1.1. Market size analysis, by Type, 2022-2032
9.3.1.2. Market size analysis, by Product Type, 2022-2032
9.3.1.3. Market size analysis, by Application, 2022-2032
9.3.1.4. Market size analysis, by End User, 2022-2032
9.3.2. Japan
9.3.2.1. Market size analysis, by Type, 2022-2032
9.3.2.2. Market size analysis, by Product Type, 2022-2032
9.3.2.3. Market size analysis, by Application, 2022-2032
9.3.2.4. Market size analysis, by End User, 2022-2032
9.3.3. India
9.3.3.1. Market size analysis, by Type, 2022-2032
9.3.3.2. Market size analysis, by Product Type, 2022-2032
9.3.3.3. Market size analysis, by Application, 2022-2032
9.3.3.4. Market size analysis, by End User, 2022-2032
9.3.4. Australia
9.3.4.1. Market size analysis, by Type, 2022-2032
9.3.4.2. Market size analysis, by Product Type, 2022-2032
9.3.4.3. Market size analysis, by Application, 2022-2032
9.3.4.4. Market size analysis, by End User, 2022-2032
9.3.5. South Korea
9.3.5.1. Market size analysis, by Type, 2022-2032
9.3.5.2. Market size analysis, by Product Type, 2022-2032
9.3.5.3. Market size analysis, by Application, 2022-2032
9.3.5.4. Market size analysis, by End User, 2022-2032
9.3.6. Rest of Asia-Pacific
9.3.6.1. Market size analysis, by Type, 2022-2032
9.3.6.2. Market size analysis, by Product Type, 2022-2032
9.3.6.3. Market size analysis, by Application, 2022-2032
9.3.6.4. Market size analysis, by End User, 2022-2032
9.3.7. Research Dive Exclusive Insights
9.3.7.1. Market attractiveness
9.3.7.2. Competition heatmap
9.4. LAMEA
9.4.1. Brazil
9.4.1.1. Market size analysis, by Type, 2022-2032
9.4.1.2. Market size analysis, by Product Type, 2022-2032
9.4.1.3. Market size analysis, by Application, 2022-2032
9.4.1.4. Market size analysis, by End User, 2022-2032
9.4.2. Saudi Arabia
9.4.2.1. Market size analysis, by Type, 2022-2032
9.4.2.2. Market size analysis, by Product Type, 2022-2032
9.4.2.3. Market size analysis, by Application, 2022-2032
9.4.2.4. Market size analysis, by End User, 2022-2032
9.4.3. UAE
9.4.3.1. Market size analysis, by Type, 2022-2032
9.4.3.2. Market size analysis, by Product Type, 2022-2032
9.4.3.3. Market size analysis, by Application, 2022-2032
9.4.3.4. Market size analysis, by End User, 2022-2032
9.4.4. South Africa
9.4.4.1. Market size analysis, by Type, 2022-2032
9.4.4.2. Market size analysis, by Product Type, 2022-2032
9.4.4.3. Market size analysis, by Application, 2022-2032
9.4.4.4. Market size analysis, by End User, 2022-2032
9.4.5. Rest of LAMEA
9.4.5.1. Market size analysis, by Type, 2022-2032
9.4.5.2. Market size analysis, by Product Type, 2022-2032
9.4.5.3. Market size analysis, by Application, 2022-2032
9.4.5.4. Market size analysis, by End User, 2022-2032
9.4.6. Research Dive Exclusive Insights
9.4.6.1. Market attractiveness
9.4.6.2. Competition heatmap
10. Competitive Landscape
10.1. Top winning strategies, 2022
10.1.1. By strategy
10.1.2. By year
10.2. Strategic overview
10.3. Market share analysis, 2022
11. Company Profiles
11.1. ABB Ltd
11.1.1. Overview
11.1.2. Business segments
11.1.3. Product portfolio
11.1.4. Financial performance
11.1.5. Recent developments
11.1.6. SWOT analysis
11.2. Crompton Greaves
11.2.1. Overview
11.2.2. Business segments
11.2.3. Product portfolio
11.2.4. Financial performance
11.2.5. Recent developments
11.2.6. SWOT analysis
11.3. General Electric
11.3.1. Overview
11.3.2. Business segments
11.3.3. Product portfolio
11.3.4. Financial performance
11.3.5. Recent developments
11.3.6. SWOT analysis
11.4. Honeywell International, Inc.
11.4.1. Overview
11.4.2. Business segments
11.4.3. Product portfolio
11.4.4. Financial performance
11.4.5. Recent developments
11.4.6. SWOT analysis
11.5. Kirlosakar Electric Company, Ltd,
11.5.1. Overview
11.5.2. Business segments
11.5.3. Product portfolio
11.5.4. Financial performance
11.5.5. Recent developments
11.5.6. SWOT analysis
11.6. Microchip Technology, Inc.
11.6.1. Overview
11.6.2. Business segments
11.6.3. Product portfolio
11.6.4. Financial performance
11.6.5. Recent developments
11.6.6. SWOT analysis
11.7. Magneteck, Inc.
11.7.1. Overview
11.7.2. Business segments
11.7.3. Product portfolio
11.7.4. Financial performance
11.7.5. Recent developments
11.7.6. SWOT analysis
11.8. Johnson Controls Inc.
11.8.1. Overview
11.8.2. Business segments
11.8.3. Product portfolio
11.8.4. Financial performance
11.8.5. Recent developments
11.8.6. SWOT analysis
11.9. Simens AG
11.9.1. Overview
11.9.2. Business segments
11.9.3. Product portfolio
11.9.4. Financial performance
11.9.5. Recent developments
11.9.6. SWOT analysis
11.10. Weg S.A.
11.10.1. Overview
11.10.2. Business segments
11.10.3. Product portfolio
11.10.4. Financial performance
11.10.5. Recent developments
11.10.6. SWOT analysis
Personalize this research
- Triangulate with your own data
- Request your format and definition
- Get a deeper dive on a specific application, geography, customer or competitor
- + 1-888-961-4454 Toll - Free
- support@researchdive.com
