Nutrigenomics Market Report
RA09235
Nutrigenomics Market by Application (Obesity, Diabetes, Cardiovascular Diseases, and Cancer Research), Product (Reagents & Kits and Services), End User (Online Platforms, Hospitals & Clinics, and Others), and Region (North America, Europe, Asia-Pacific, and LAMEA): Global Opportunity Analysis and Industry Forecast, 2023-2032
Nutrigenomics Overview
Nutrigenomics is the field of study of the effects of nutrients on the expression of each individual's genetic makeup. Also, nutritional genetics i.e. nutrigenetics is a branch of nutrigenomics that studies how genomic variants interact with dietary variables and the consequences of these interactions.
Nutrigenomics utilizes tools and approaches such as microarrays and genomics, proteomics, single nucleotide polymorphisms (SNPs), and bioinformatics leading to the improvement in diet and health. This emerging field could help to enhance personalized diet consumption trends depending on individual genetic makeup and to develop innovative functional foods based on genetic patterns. Nutrigenetic tests analyses certain DNA variants related to significant aspects of metabolism such as fat accumulation and increased Body Mass Index (BMI), appetite regulation, the metabolism of certain vitamins and other variants important for the development of a personalized diet, as well as those variants associated with food intolerances or allergies.
Global Nutrigenomics Market Analysis
The global nutrigenomics market size was $ 435.70 million in 2022 and is predicted to grow with a CAGR of 17.2% by generating a revenue of $ 2108.00 million by 2032.

Source: Research Dive Analysis
COVID-19 Impact on Global Nutrigenomics Market
The COVID-19 pandemic and the restrictions that were imposed by governments of various countries to avoid transmission of the virus (e.g., nationwide lockdowns) led to changes in dietary habits. People became more aware about leading a healthy lifestyle as unhealthy eating habits and sedentary lifestyle often lead to certain chronic diseases such as diabetes, obesity, cancer, and others. Hence, people started preferring a personalized diet suggested by dietician or a doctor. Also, telehealth services have become more popular since the pandemic which has caused an increase in nutrigenomic testing demand. Through telehealth services, healthcare companies can connect patients to licensed healthcare professionals in order to provide affordable and direct online access to medical care, from consultation to treatment, for a number of common conditions via evidence-based guidelines and up-to-date clinical protocols. Thus, telehealth services will revolutionize the nutrigenomics market in the post-pandemic period.
Rising Prevalence of Chronic Diseases to Drive the Market Growth
Over the past decade, rapid advancements in omic technologies such as proteomics, genomics, and metabolomics are combining with advanced bioinformatics to be universally used for identifying diseases based on protein pathways. The findings of nutrigenomics have been used to some extent to treat diseases with a diet component like diabetes, cancer, and obesity, significantly boosting the nutrigenomics market size. Nutrigenomics also provide different approaches for the development of effective and safe dietary guidelines against obesity. According to the World Health Organization (WHO), obesity results in the death of at least 2.8 million people annually. Furthermore, obesity is related to various other chronic diseases such as cardiovascular diseases, type-2 diabetes, hypertension, cancers, and others. The major reasons for its occurrence are changing lifestyles and unhealthy eating habits. Unhealthy eating habits are contributing to the growing rate of coronary heart disease (CHD), obesity, and diabetes, thus promoting the awareness about nutrigenomics testing in the future.
High Cost of Nutrigenomics Tests to Restrain the Market Growth
High cost associated with nutrigenomics testing is one of the major restraining factors for the market growth. Nutrigenomics test providers rely on third-party suppliers to obtain materials such as saliva collection kits, bead chips, reagents or other materials, and equipment used in laboratory operations and services such as laboratory processing services. Currently, many healthcare companies rely on a sole supplier to manufacture their nutrigenomics kits. Change in the supplier or design of certain materials which the companies or healthcare providers rely on could result in a requirement to seek additional premarket review from the Food and Drug Administration (FDA) before making any such changes. Thus, such regulatory requirement to validate any new laboratory or laboratories in accordance with the FDA standards prior to utilizing their services for its customers will increase the cost of the nutrigenomics testing.
Rising Demand for Personalized Nutrition to Drive Excellent Opportunities
Increasing demand for personalized nutrition is driving the growth of nutrigenomics testing market. Some of the key factors driving the demand for personalization of food products are changing population demographics, increasing consumer awareness of the relationship between diet and genotype, and rising clinical evidence supporting the efficacy of functional foods. Personalized nutrition provides individuals with targeted nutritional advice and products or services with the aim of improving and maintaining optimum health. This advice is typically based on the individual’s genetic, phenotypic, and medical information. Moreover, commercial interest in nutrigenomics in recent years has led to the popularity of companies such as DNAFit, Habitat, and EasyDNA, among consumers. These companies offer personalized dietary advice based on the results of nutrigenetic home-based testing kits. Due to the commercial developments and consumer interest in nutrigenomics, there has been an increase in move towards the production of functional foods within the food industry. These foods aim to deliver additional nutritional value to foods, with common examples including margarines with added plant sterols and stanol esters, and yoghurts containing probiotics. Furthermore, nutrigenomics uses molecular tools such as proteomics, metabolomics, and transcriptomics to identify how the components of a particular diet may affect the expression of genes in health and disease, thus offering a potential opportunity for further research toward setting personalized dietary recommendations for individuals and population subgroups.
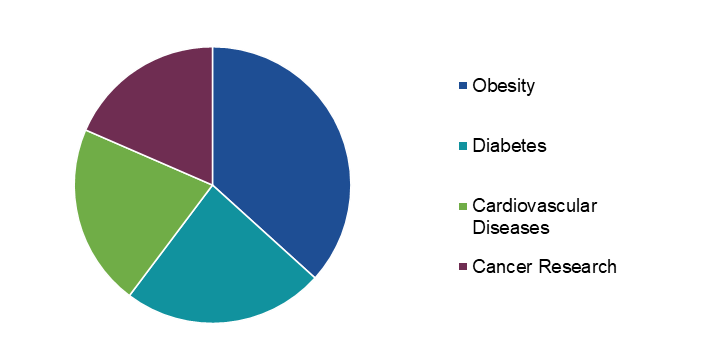
Global Nutrigenomics Market Share, by Application, 2022
Source: Research Dive Analysis
The obesity sub-segment accounted for the highest market share in 2022, due to sedentary lifestyle and unhealthy eating habits. Across the globe, obesity and cardiovascular diseases (CVD) contribute to a larger proportion of total morbidity and mortality rate. According to World Obesity Federation (WOF) 2023 report, it is anticipated that more than 4 billion population i.e. more than half the world’s population will suffer from obesity by the end of 2023. Furthermore, obesity is also linked with other diseases such as high rates of heart disease, stroke, cancer, and type 2 diabetes. As nutrigenomics explores the interaction between genetic factors and dietary nutrient intake on various disease phenotypes including obesity,, it is considered as an effective solution for the prevention and treatment of obesity and other diseases for humans.
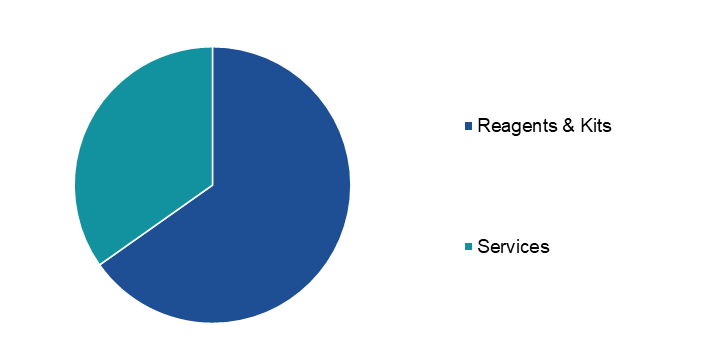
Global Nutrigenomics Market Share, by Product, 2022
Source: Research Dive Analysis
The reagents & kits sub-segment accounted for the highest market share in 2022. Growing popularity of personalized diet is leading to the rising demand of nutrigenomics reagents & kits. Furthermore, telehealth is generating a demand for home-based testing kits for nutrigenomics. Hence, the reagents & kits sub-segment in the nutrigenomics market is anticipated to grow in the upcoming years.
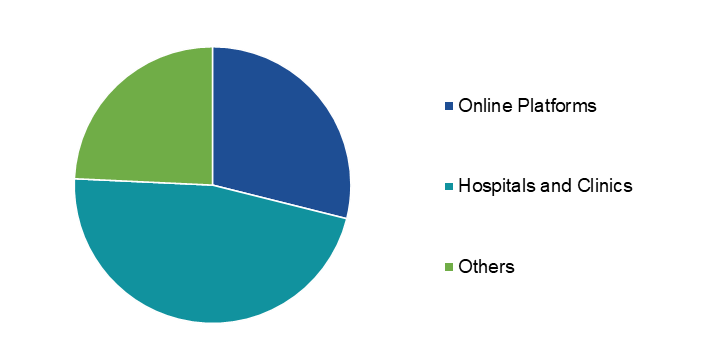
Global Nutrigenomics Market Share, by End User, 2022
Source: Research Dive Analysis
The hospitals & clinics sub-segment accounted for the highest market share in 2022, as people are getting more aware about healthy eating habits and are shifting their preferences towards personalized diet. Although, telehealth and e-healthcare services are gaining momentum due to wider acceptance to virtual healthcare services but in-person doctor has proven to be much more effective as compared to online medication or consultation for any disease or health condition. Hence, the hospitals & clinics sub-segment is anticipated to hold the highest share in the nutrigenomics market during the forecast years.
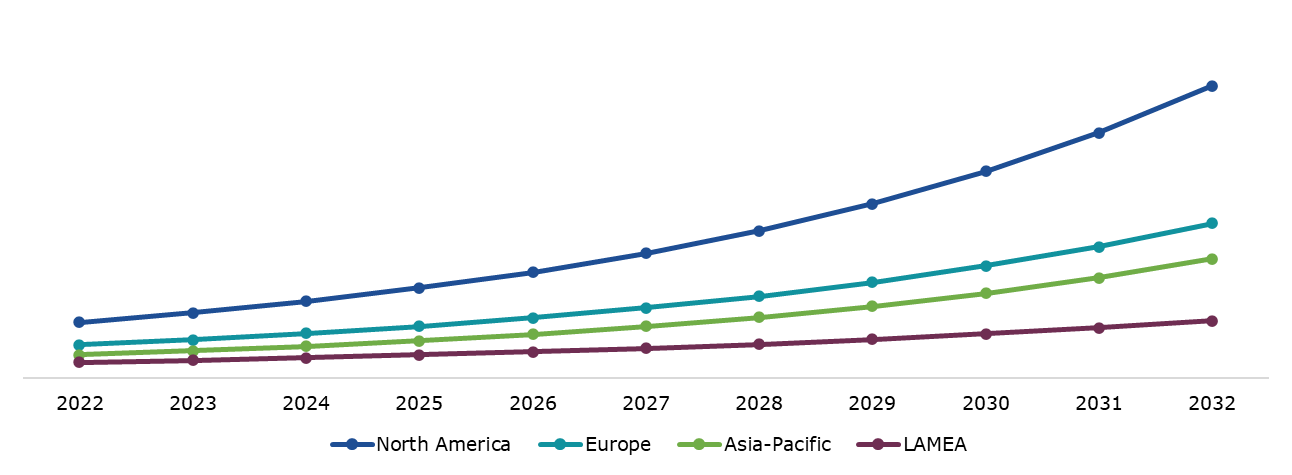
Global Nutrigenomics Market Size & Forecast, by Region, 2022-2032 ($Million)
Source: Research Dive Analysis
The North America nutrigenomics market generated the highest revenue in 2022. Rising awareness regarding personalized food or diet to achieve healthy status and reduce the risk of diet-related diseases is driving the nutrigenomics market in this region. Furthermore, the increasing prevalence of chronic diseases such as obesity, diabetes, and hypertension has led to enormous growth of the nutrigenomics market in North America. According to the International Journal of Environmental Research and Public Health (IJEPH), ~25% of adults in the U.S. have two or more chronic conditions. The reason behind these diseases is generally the sedentary lifestyle and unhealthy eating habits adopted by people. Thus, in the upcoming years, the North America nutrigenomics market is expected to hold a dominant share in the global market.
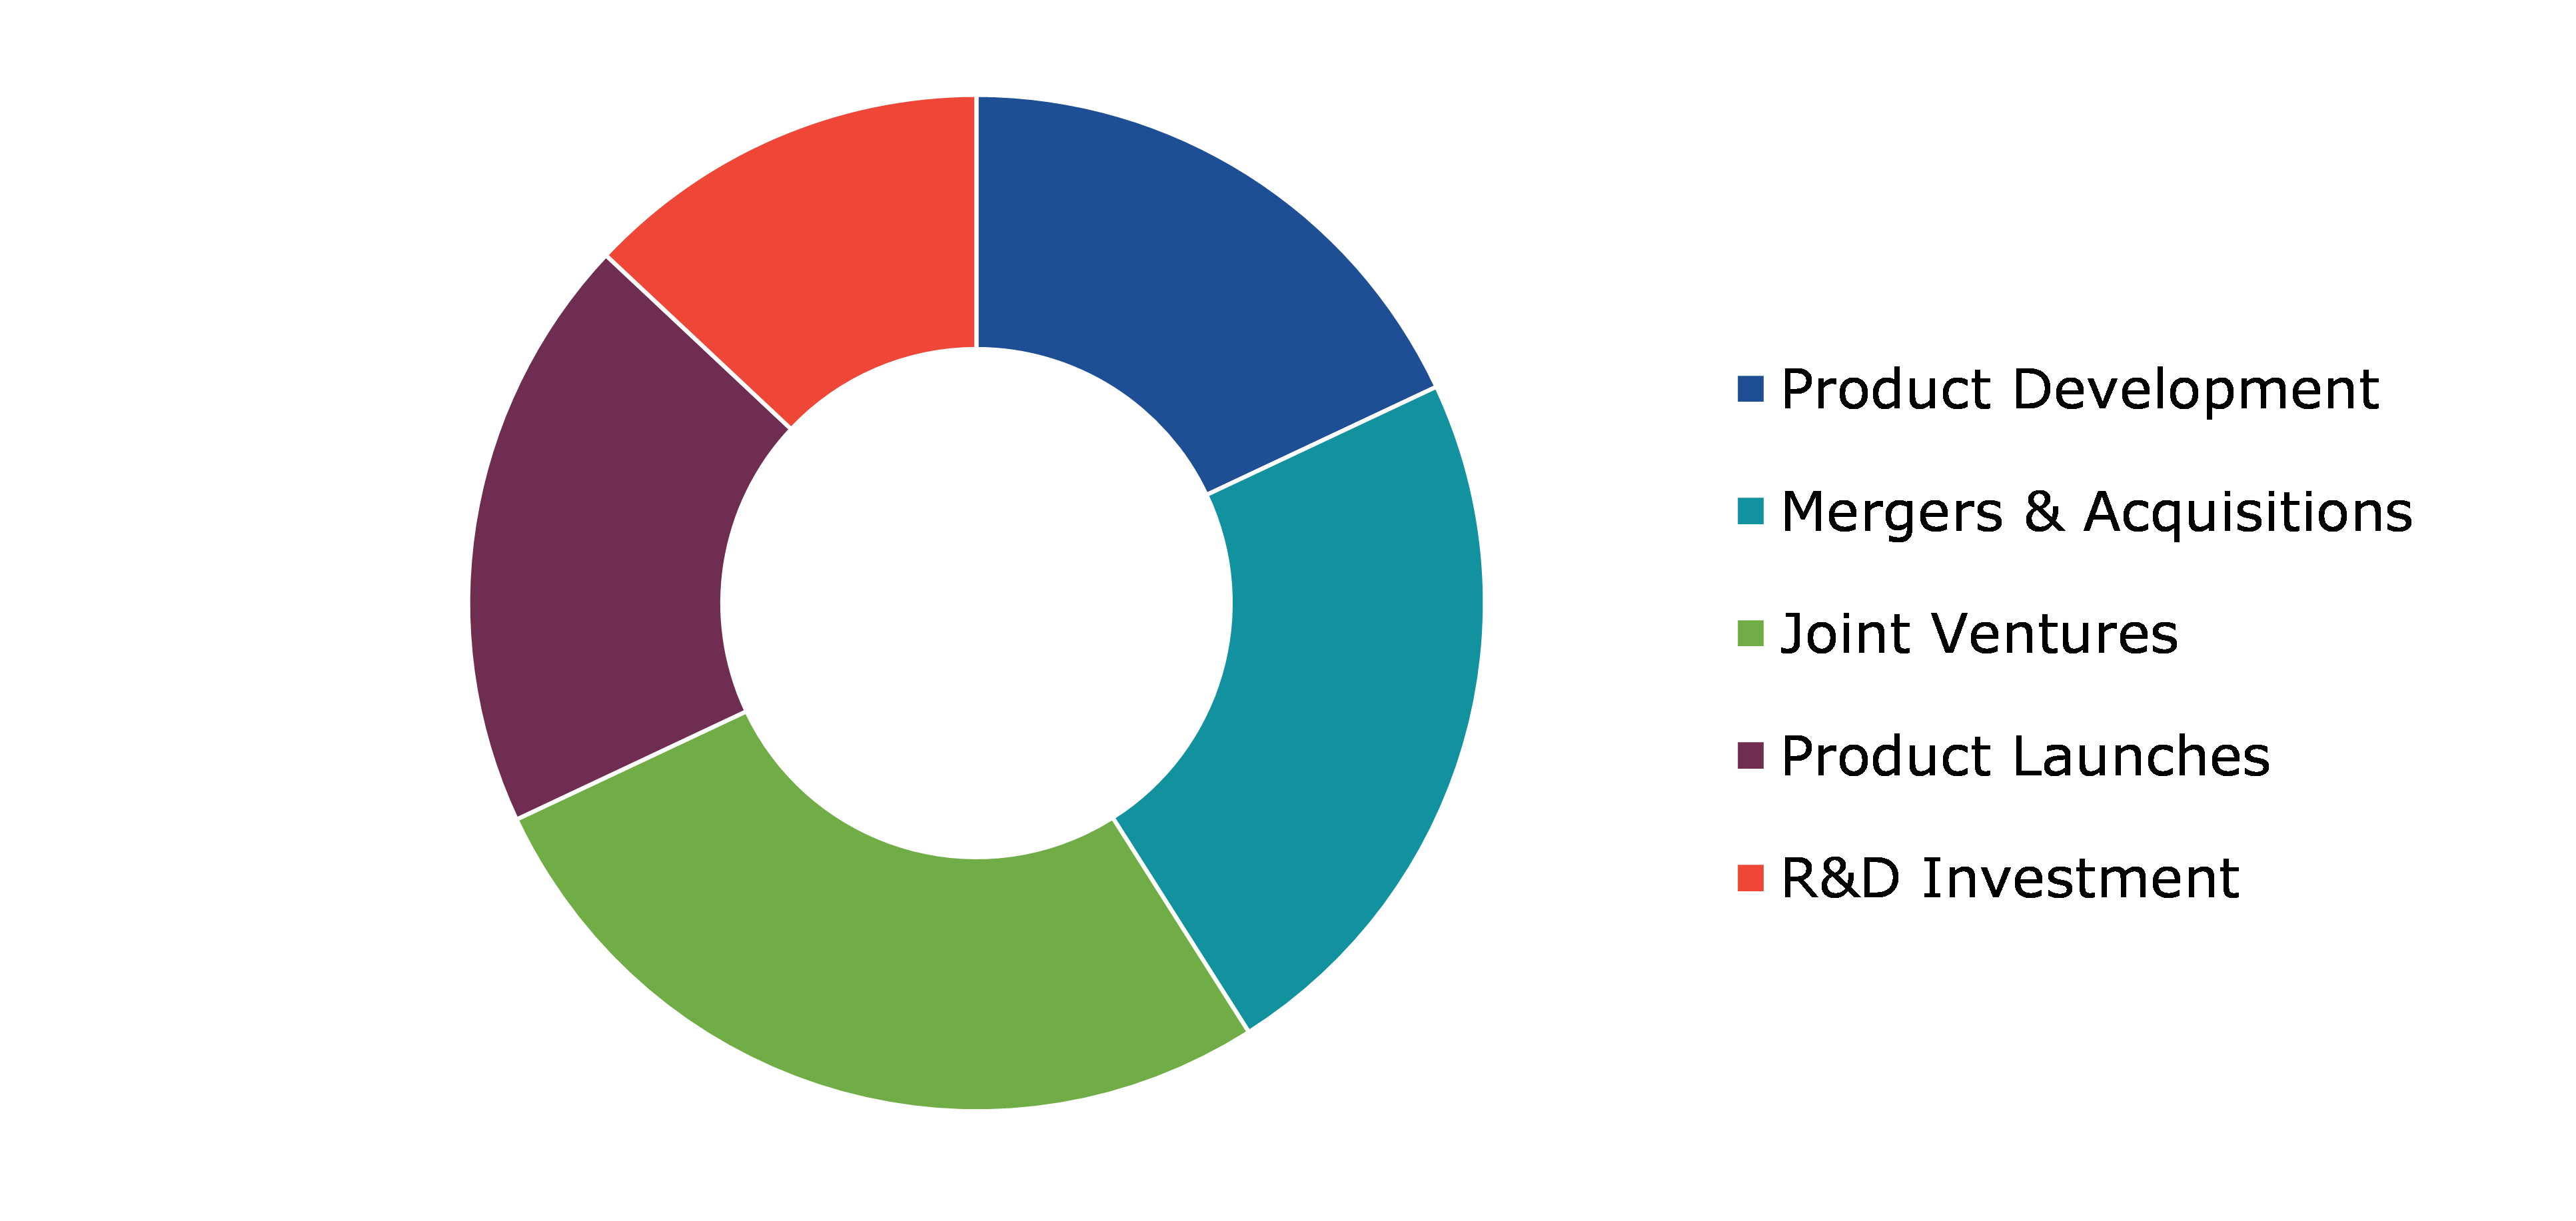
Competitive Scenario in the Global Nutrigenomics Market
Partnerships and agreement are common strategies followed by major market players. For instance, in June 2023, SomaLogic, Inc., a proteomics technology company, announced its collaboration with Citogen, the Longwood Group’s customer services and support unit, to establish the company’s first authorized site in Spain. Through this agreement, Citogen will offer the 7,000-plex SomaScan Assay and provide SomaScan data to their customers in Southern Europe supporting biological research across an array of disciplines including clinical research, population health studies, and nutrigenomics.
Source: Research Dive Analysis
Some of the leading players for cybersecurity in banking market players are Ancestry, Nutrigenomix, 23andMe Inc., DNAfit, GX Sciences Inc., Xcode Life, Koninklijke DSM N.V. (Royal DSM), BASF SE, Danone S.A., and The Gene Box.
| Aspect | Particulars |
| Historical Market Estimations | 2020-2021 |
| Base Year for Market Estimation | 2022 |
| Forecast Timeline for Market Projection | 2023-2032 |
| Geographical Scope | North America, Europe, Asia-Pacific, and LAMEA |
| Segmentation by Application |
|
| Segmentation by Product |
|
|
Segmentation by End User
|
|
| Key Companies Profiled |
|
Q1. What is the size of the global nutrigenomics testing market?
A. The global nutrigenomics market size was $ 435.70 million in 2022 and is predicted to grow with a CAGR of 14.9%, by generating a revenue of $ 2108.00 million by 2032.
Q2. Which are the major companies in the nutrigenomics testing market?
A. Ancestry and 23andMe Holding Co. are some of the key players in the global nutrigenomics market.
Q3. Which region, among others, possesses greater investment opportunities in the future?
A. North America possesses greater investment opportunities for investors in the future.
Q4. What will be the growth rate of the North America nutrigenomics market?
A. The North America nutrigenomics market is anticipated to grow at 18.0% CAGR during the forecast period.
Q5. What are the strategies opted by the leading players in this market?
A. Partnerships and agreement are the two key strategies opted by the operating companies in this market.
Q6. Which companies are investing more on R&D practices?
A. Ancestry and 23andMe Holding Co. are the companies investing more on R&D activities for developing new products and technologies.
1. Research Methodology
1.1. Desk Research
1.2. Real time insights and validation
1.3. Forecast model
1.4. Assumptions and forecast parameters
1.5. Market size estimation
1.5.1. Top-down approach
1.5.2. Bottom-up approach
2. Report Scope
2.1. Market definition
2.2. Key objectives of the study
2.3. Report overview
2.4. Market segmentation
2.5. Overview of the impact of COVID-19 on global nutrigenomics testing market
3. Executive Summary
4. Market Overview
4.1. Introduction
4.2. Growth impact forces
4.2.1. Drivers
4.2.2. Restraints
4.2.3. Opportunities
4.3. Market value chain analysis
4.3.1. List of raw material suppliers
4.3.2. List of manufacturers
4.3.3. List of distributors
4.4. Innovation & sustainability matrices
4.4.1. End User matrix
4.4.2. Regulatory matrix
4.5. Porter’s five forces analysis
4.5.1. Bargaining power of suppliers
4.5.2. Bargaining power of consumers
4.5.3. Threat of substitutes
4.5.4. Threat of new entrants
4.5.5. Competitive rivalry intensity
4.6. PESTLE analysis
4.6.1. Political
4.6.2. Economical
4.6.3. Social
4.6.4. Technological
4.6.5. Environmental
4.7. Impact of COVID-19 on nutrigenomics testing market
4.7.1. Pre-covid market scenario
4.7.2. Post-covid market scenario
5. Nutrigenomics Testing Market Analysis, by Application
5.1. Overview
5.2. Obesity
5.2.1. Definition, key trends, growth factors, and opportunities
5.2.2. Market size analysis, by region, 2022-2032
5.2.3. Market share analysis, by country, 2022-2032
5.3. Diabetes
5.3.1. Definition, key trends, growth factors, and opportunities
5.3.2. Market size analysis, by region, 2022-2032
5.3.3. Market share analysis, by country, 2022-2032
5.4. Cardiovascular Diseases
5.4.1. Definition, key trends, growth factors, and opportunities
5.4.2. Market size analysis, by region, 2022-2032
5.4.3. Market share analysis, by country, 2022-2032
5.5. Cancer Research
5.5.1. Definition, key trends, growth factors, and opportunities
5.5.2. Market size analysis, by region, 2022-2032
5.5.3. Market share analysis, by country, 2022-2032
5.6. Research Dive Exclusive Insights
5.6.1. Market attractiveness
5.6.2. Competition heatmap
6. Nutrigenomics Testing Market Analysis, by Product
6.1. Reagents & Kits
6.1.1. Definition, key trends, growth factors, and opportunities
6.1.2. Market size analysis, by region, 2022-2032
6.1.3. Market share analysis, by country, 2022-2032
6.2. Services
6.2.1. Definition, key trends, growth factors, and opportunities
6.2.2. Market size analysis, by region, 2022-2032
6.2.3. Market share analysis, by country, 2022-2032
6.3. Research Dive Exclusive Insights
6.3.1. Market attractiveness
6.3.2. Competition heatmap
7. Nutrigenomics Testing Market Analysis, by End User
7.1. Online Platforms
7.1.1. Definition, key trends, growth factors, and opportunities
7.1.2. Market size analysis, by region, 2022-2032
7.1.3. Market share analysis, by country, 2022-2032
7.2. Hospitals & Clinics
7.2.1. Definition, key trends, growth factors, and opportunities
7.2.2. Market size analysis, by region, 2022-2032
7.2.3. Market share analysis, by country, 2022-2032
7.3. Others
7.3.1. Definition, key trends, growth factors, and opportunities
7.3.2. Market size analysis, by region, 2022-2032
7.3.3. Market share analysis, by country, 2022-2032
7.3.4. Definition, key trends, growth factors, and
7.3.5. Market size analysis, by region, 2022-2032
7.4. Research Dive Exclusive Insights
7.4.1. Market attractiveness
7.4.2. Competition heatmap
8. Nutrigenomics Testing Market, by Region
8.1. North America
8.1.1. U.S.
8.1.1.1. Market size analysis, by Application, 2022-2032
8.1.1.2. Market size analysis, by Product, 2022-2032
8.1.1.3. Market size analysis, by End User, 2022-2032
8.1.2. Canada
8.1.2.1. Market size analysis, by Application, 2022-2032
8.1.2.2. Market size analysis, by Product, 2022-2032
8.1.2.3. Market size analysis, by End User, 2022-2032
8.1.3. Mexico
8.1.3.1. Market size analysis, by Application, 2022-2032
8.1.3.2. Market size analysis, by Product, 2022-2032
8.1.3.3. Market size analysis, by End User, 2022-2032
8.1.4. Research Dive Exclusive Insights
8.1.4.1. Market attractiveness
8.1.4.2. Competition heatmap
8.2. Europe
8.2.1. Germany
8.2.1.1. Market size analysis, by Application, 2022-2032
8.2.1.2. Market size analysis, by Product, 2022-2032
8.2.1.3. Market size analysis, by End User, 2022-2032
8.2.2. UK
8.2.2.1. Market size analysis, by Application, 2022-2032
8.2.2.2. Market size analysis, by Product, 2022-2032
8.2.2.3. Market size analysis, by End User, 2022-2032
8.2.3. France
8.2.3.1. Market size analysis, by Application, 2022-2032
8.2.3.2. Market size analysis, by Product, 2022-2032
8.2.3.3. Market size analysis, by End User, 2022-2032
8.2.4. Spain
8.2.4.1. Market size analysis, by Application, 2022-2032
8.2.4.2. Market size analysis, by Product, 2022-2032
8.2.4.3. Market size analysis, by End User, 2022-2032
8.2.5. Rest of Europe
8.2.5.1. Market size analysis, by Application, 2022-2032
8.2.5.2. Market size analysis, by Product, 2022-2032
8.2.5.3. Market size analysis, by End User, 2022-2032
8.2.6. Research Dive Exclusive Insights
8.2.6.1. Market attractiveness
8.2.6.2. Competition heatmap
8.3. Asia-Pacific
8.3.1. China
8.3.1.1. Market size analysis, by Application, 2022-2032
8.3.1.2. Market size analysis, by Product, 2022-2032
8.3.1.3. Market size analysis, by End User, 2022-2032
8.3.2. Japan
8.3.2.1. Market size analysis, by Application, 2022-2032
8.3.2.2. Market size analysis, by Product, 2022-2032
8.3.2.3. Market size analysis, by End User, 2022-2032
8.3.3. India
8.3.3.1. Market size analysis, by Application, 2022-2032
8.3.3.2. Market size analysis, by Product, 2022-2032
8.3.3.3. Market size analysis, by End User, 2022-2032
8.3.4. South Korea
8.3.4.1. Market size analysis, by Application, 2022-2032
8.3.4.2. Market size analysis, by Product, 2022-2032
8.3.4.3. Market size analysis, by End User, 2022-2032
8.3.5. Rest of Asia-Pacific
8.3.5.1. Market size analysis, by Application, 2022-2032
8.3.5.2. Market size analysis, by Product, 2022-2032
8.3.5.3. Market size analysis, by End User, 2022-2032
8.3.6. Research Dive Exclusive Insights
8.3.6.1. Market attractiveness
8.3.6.2. Competition heatmap
8.4. LAMEA
8.4.1. Brazil
8.4.1.1. Market size analysis, by Application, 2022-2032
8.4.1.2. Market size analysis, by Product, 2022-2032
8.4.1.3. Market size analysis, by End User, 2022-2032
8.4.2. UAE
8.4.2.1. Market size analysis, by Application, 2022-2032
8.4.2.2. Market size analysis, by Product, 2022-2032
8.4.2.3. Market size analysis, by End User, 2022-2032
8.4.3. Saudi Arabia
8.4.3.1. Market size analysis, by Application, 2022-2032
8.4.3.2. Market size analysis, by Product, 2022-2032
8.4.3.3. Market size analysis, by End User, 2022-2032
8.4.4. South Africa
8.4.4.1. Market size analysis, by Application, 2022-2032
8.4.4.2. Market size analysis, by Product, 2022-2032
8.4.4.3. Market size analysis, by End User, 2022-2032
8.4.5. Rest of LAMEA
8.4.5.1. Market size analysis, by Application, 2022-2032
8.4.5.2. Market size analysis, by Product, 2022-2032
8.4.5.3. Market size analysis, by End User, 2022-2032
8.4.6. Research Dive Exclusive Insights
8.4.6.1. Market attractiveness
8.4.6.2. Competition heatmap
9. Competitive Landscape
9.1. Top winning strategies, 2021
9.1.1. By strategy
9.1.2. By year
9.2. Strategic overview
9.3. Market share analysis, 2021
10. Company Profiles
10.1. Ancestry,
10.1.1. Overview
10.1.2. Business segments
10.1.3. Product portfolio
10.1.4. Financial performance
10.1.5. Recent developments
10.1.6. SWOT analysis
10.2. Nutrigenomix
10.2.1. Overview
10.2.2. Business segments
10.2.3. Product portfolio
10.2.4. Financial performance
10.2.5. Recent developments
10.2.6. SWOT analysis
10.3. 23andMe Inc.
10.3.1. Overview
10.3.2. Business segments
10.3.3. Product portfolio
10.3.4. Financial performance
10.3.5. Recent developments
10.3.6. SWOT analysis
10.4. DNAfit
10.4.1. Overview
10.4.2. Business segments
10.4.3. Product portfolio
10.4.4. Financial performance
10.4.5. Recent developments
10.4.6. SWOT analysis
10.5. GX Sciences Inc.
10.5.1. Overview
10.5.2. Business segments
10.5.3. Product portfolio
10.5.4. Financial performance
10.5.5. Recent developments
10.5.6. SWOT analysis
10.6. Xcode Life
10.6.1. Overview
10.6.2. Business segments
10.6.3. Product portfolio
10.6.4. Financial performance
10.6.5. Recent developments
10.6.6. SWOT analysis
10.7. Koninklijke DSM N.V. (Royal DSM)
10.7.1. Overview
10.7.2. Business segments
10.7.3. Product portfolio
10.7.4. Financial performance
10.7.5. Recent developments
10.7.6. SWOT analysis
10.8. BASF SE
10.8.1. Overview
10.8.2. Business segments
10.8.3. Product portfolio
10.8.4. Financial performance
10.8.5. Recent developments
10.8.6. SWOT analysis
10.9. Danone S.A.
10.9.1. Overview
10.9.2. Business segments
10.9.3. Product portfolio
10.9.4. Financial performance
10.9.5. Recent developments
10.9.6. SWOT analysis
10.10. The Gene Box
10.10.1. Overview
10.10.2. Business segments
10.10.3. Product portfolio
10.10.4. Financial performance
10.10.5. Recent developments
10.10.6. SWOT analysis
Personalize this research
- Triangulate with your own data
- Request your format and definition
- Get a deeper dive on a specific application, geography, customer or competitor
- + 1-888-961-4454 Toll - Free
- support@researchdive.com
