Electric Tricycles And Microcars Market Report
RA09234
Electric Tricycles and Microcars Market by Application (Passenger Transport and Cargo Delivery), Driving Range (Less than 100 Kms, Between 100 to 200 Kms, and Above 200 Kms), Battery Type (Lithium-ion Battery, Lead–acid Battery, Nickel Metal Hydride Battery, and Others), and Region (North America, Europe, Asia-Pacific, and LAMEA): Global Opportunity Analysis and Industry Forecast, 2023-2032
Electric Tricycles and Microcars Overview
Electric tricycles, also known as E-tricycles, are three-wheeled, electric-powered vehicles that provide a compact, lightweight, and energy-efficient mode of transportation. They are suitable for commuting and running errands, particularly in urban areas and regions with limited public transport options. E-tricycles offer an eco-friendly and cost-effective alternative to traditional petrol, diesel, or electric cars.
Microcars are small, electric-powered vehicles designed for urban commuting and short-distance travel. They are energy-efficient and offer a more powerful mode of transportation compared to conventional pedal-assist e-bikes. Microcars are well-suited for city use and areas with limited public transportation options, providing an economical and environmentally friendly option in place of standard-sized petrol, diesel, or electric cars.
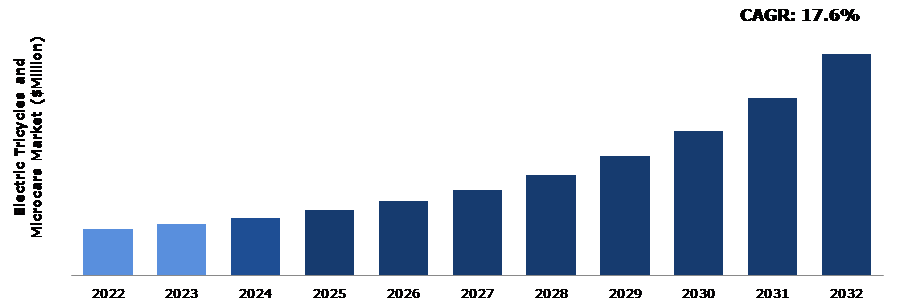
Global Electric Tricycles and Microcars Market Analysis
The global electric tricycles and microcars market size was $20,498.50 million in 2022 and is predicted to grow with a CAGR of 17.6%, by generating a revenue of $97,823.50 million by 2032.
Source: Research Dive Analysis
COVID-19 Impact on Global Electric Tricycles and Microcars Market
The COVID-19 pandemic had a substantial and adverse impact on the global market for electric tricycles and microcars. The pandemic led to a significant decline in demand for electric tricycles and microcars. With travel restrictions and economic uncertainties, consumers across the globe reduced their expenditure on such vehicles. In 2020, the market witnessed a 20% decrease in the registration of all electric vehicles, as reported by the Society of Electric Vehicle Manufacturers (SMEV). The pandemic had a significant impact on electric three-wheelers (E3W), causing them to face the most challenges. The electric three-wheelers sector experienced a substantial 37% fall in sales, falling from 140,683 units in 2020 to 88,378 units in 2021.
The post-COVID-19 outlook for the electric tricycle and microcar market is marked by recovery and adaptation. As pandemic-related restrictions ease, and with a continued emphasis on reducing carbon emissions, there is potential for a resurgence in the demand for these eco-friendly and compact vehicles, especially in urban and suburban areas.
Growing Awareness regarding Environmental Sustainability and the Global Ecosystem to Drive the Electric Tricycles and Microcars Market Growth
Increasing awareness regarding environmental sustainability and the global ecosystem has led to a rising demand for electric tricycles and microcars. These vehicles offer numerous environmental benefits, as they produce no pollutants during operation and are known for their energy-efficient driving solutions. Electric tricycles, in particular, are an excellent choice for environmentally conscious individuals as they do not release harmful chemicals into the air, unlike gasoline-powered cars. Furthermore, the ability to charge these vehicles using clean energy sources such as solar or wind power significantly reduces their carbon footprint. Beyond their environmental advantages, electric tricycles and microcars also bring about significant cost savings over time. While the initial investment may be higher than that of a standard bicycle, owners can enjoy reduced fuel and maintenance costs. Charging an E-tricycle and microcar is considerably more cost-effective compared to fueling a traditional car, making it a pocket-friendly choice for consumers. Therefore, the growing demand for these vehicles reflects the broader shift towards sustainable and eco-friendly transportation options in today's environmentally conscious world.
Limited Charging Infrastructure to Restrain the Market Growth
One of the primary challenges is the limited infrastructure for charging electric tricycles and microcars. Many regions lack an extensive network of charging stations, which can deter potential buyers concerned about range anxiety. The slow development of charging infrastructure is anticipated to impede market expansion. In many regions, there is a shortage of charging stations specifically designed for electric tricycles and microcars. Unlike gasoline-powered vehicles that can refuel at gas stations widely available, electric vehicles require specialized charging infrastructure. This shortage means that potential buyers and users of electric tricycles and microcars often have limited access to convenient charging points. All these factors are predicted to hamper the market revenue growth in the upcoming years.
Advancements in Technology to Drive Excellent Opportunities
A notable and promising advancement in electric vehicle (EV) battery technology is the emergence of solid-state batteries. Unlike conventional batteries that rely on liquid or gel-based electrolytes, solid-state batteries use solid electrolytes, offering several significant advantages. These batteries are renowned for their enhanced safety, efficiency, and durability. In addition, solid-state batteries boast a higher energy density, allowing them to store more energy within the same spatial footprint as traditional batteries. Recognizing the potential of this innovation, major automakers such as Toyota and BMW are channeling substantial investments into solid-state battery R&D. Furthermore, several startups like QuantumScape and Solid Power are making commendable progress in advancing this transformative technology, indicating a promising future for the EV industry.
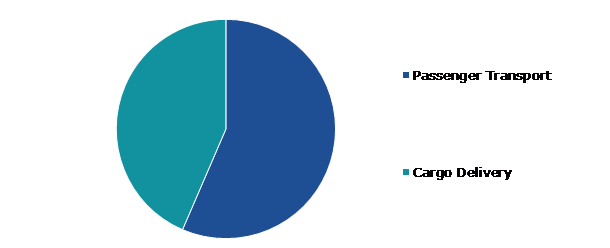
Global Electric Tricycles and Microcars Market Share, by Application, 2022
Source: Research Dive Analysis
The passenger transport sub-segment accounted for the highest market share in 2022. The rising need for sustainable and efficient intra-city transportation solutions has led to the increasing prominence of electric tricycles and microcars in many developing cities worldwide. These compact and eco-friendly vehicles are becoming the prime mode of passenger transportation, driven by a shared commitment toward reducing carbon emissions and improving the quality of urban life. Specifically, electric tricycles and microcars, with their zero-emission capabilities, play a crucial role in addressing the environmental challenges faced by urban centers.
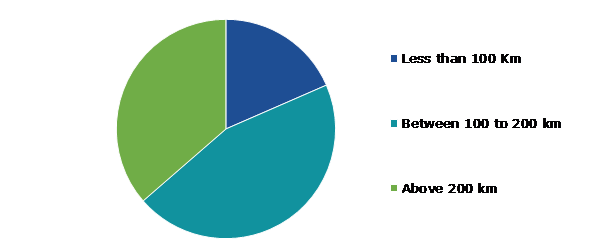
Global Electric Tricycles and Microcars Market Share, by Driving Range, 2022
Source: Research Dive Analysis
The between 100 to 200 kms sub-segment accounted for the highest market share in 2022. In an era where sustainability and environmental consciousness are paramount, electric tricycles and microcars are experiencing a surge in popularity. The ongoing global shift towards eco-friendly alternatives has driven the demand for these compact electric vehicles. People are increasingly seeking transportation options that not only reduce their carbon footprint but also deliver exceptional performance and driving range. This growing preference for electric tricycles and microcars is reflective of a larger trend towards cleaner and more efficient urban mobility solutions.
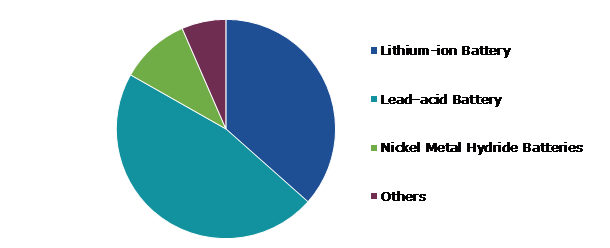
Global Electric Tricycles and Microcars Market Share, by Battery Type, 2022
Source: Research Dive Analysis
The lead-acid batteries sub-segment accounted for the highest market share in 2022. Lead-acid batteries have a longstanding and prevalent presence in the electric tricycle and microcar market. These batteries, renowned for their reliability and durability, continue to be the most widely used battery type in these compact electric vehicles. Over the years, they have strengthen their reputation as a dependable source of power for electric tricycles and microcars. Their ability to deliver high power output makes them particularly well-suited to provide the quick start energy required by these vehicles, highlighting their importance in the market. With a history of proven performance, lead-acid batteries remain a cornerstone of the electric tricycle and microcar industry, offering the assurance of reliable and efficient power sources for these environmentally friendly modes of transportation.
Global Electric Tricycles and Microcars Market Size & Forecast, by Region, 2022-2032 ($Million)
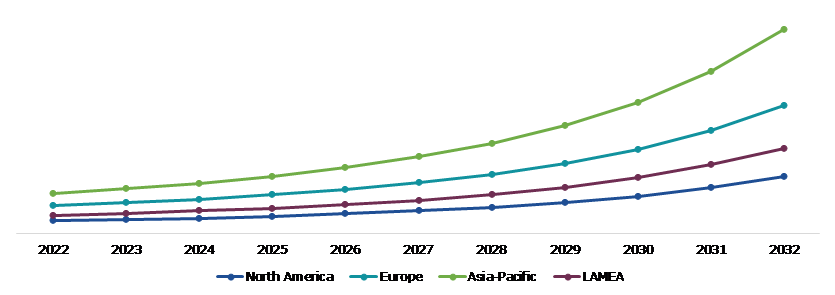
Source: Research Dive Analysis
The Asia-Pacific electric tricycles and microcars market generated the highest revenue in 2022. The Asia-Pacific electric three-wheeler industry is currently witnessing remarkable growth and transformation. These electric three-wheelers, often referred to as e-rickshaws or e-auto-rickshaws, have emerged as a novel solution for last-mile transportation in various countries across the region. Their appeal lies in offering a cleaner, more environmentally friendly, and cost-effective alternative to conventional fossil-fuel-powered three-wheelers. This has particularly resonated with urban and semi-urban areas characterized by high population density and limited public transportation options. The region's growing commitment toward environmental sustainability and improved air quality is a key driving force behind the rapid expansion of the electric three-wheeler market in Asia-Pacific.
Competitive Scenario in the Global Electric Tricycles and Microcars Market
Investment and agreement are common strategies followed by major market players. For instance, in November 2022, a Mumbai Based EV startup PMV electric launched company’s first flagship micro car named Eas-E- Your Everyday Car. This car has been launched under the new category named Personal Mobility Vehicle (PMV). The top speed of the EaS-E is 70 Kmph with the acceleration of 40 kmph under 5 seconds. The weight of the car is about 550 kg and can accommodate 2 occupants with the children.
Source: Research Dive Analysis
Some of the companies operating in the electric tricycles and microcars market are Mahindra Electric Mobility Limited, Piaggio & C.SpA, Terra Motors, Jiangsu Jinpeng Group Co., Ltd, Jiangsu Huaihai, New Energy Vehicle Co., Ltd., PT. SGMW Motor Indonesia., MG Motor, Chery, Shandong Shifeng (Group) Co., Ltd., and Luvly.
| Aspect | Particulars |
| Historical Market Estimations | 2020-2021 |
| Base Year for Market Estimation | 2022 |
| Forecast Timeline for Market Projection | 2023-2032 |
| Geographical Scope | North America, Europe, Asia-Pacific, and LAMEA |
| Segmentation by Application |
|
| Segmentation by Driving Range |
|
|
Segmentation by Battery Type
|
|
| Key Companies Profiled |
|
Q1. What is the size of the global electric tricycles and microcars market?
A. The size of the global electric tricycles and microcars market was over $20,498.50 million in 2022 and is projected to reach $97,823.50 million by 2032.
Q2. Which are the major companies in the electric tricycles and microcars market?
A. Mahindra Electric Mobility Limited and Piaggio & C.SpA are some of the key players in the global electric tricycles and microcars market.
Q3. Which region, among others, possesses greater investment opportunities in the future?
A. Asia-Pacific possesses great investment opportunities for investors in the future.
Q4. What will be the growth rate of the Asia-Pacific electric tricycles and microcars market?
A. The Asia-Pacific electric tricycles and microcars market is anticipated to grow at 18.4% CAGR during the forecast period.
Q5. What are the strategies opted by the leading players in this market?
A. Agreement and investment are the two key strategies opted by the operating companies in this market.
Q6. Which companies are investing more on R&D practices?
A. PT. SGMW Motor Indonesia. and MG Motor are the companies investing more on R&D activities for developing new products and technologies.
1. Research Methodology
1.1. Desk Research
1.2. Real time insights and validation
1.3. Forecast model
1.4. Assumptions and forecast parameters
1.5. Market size estimation
1.5.1. Top-down approach
1.5.2. Bottom-up approach
2. Report Scope
2.1. Market definition
2.2. Key objectives of the study
2.3. Report overview
2.4. Market segmentation
2.5. Overview of the impact of COVID-19 on global Electric Tricycles and Microcars market
3. Executive Summary
4. Market Overview
4.1. Introduction
4.2. Growth impact forces
4.2.1. Drivers
4.2.2. Restraints
4.2.3. Opportunities
4.3. Market value chain analysis
4.3.1. List of raw material suppliers
4.3.2. List of manufacturers
4.3.3. List of distributors
4.4. Innovation & sustainability matrices
4.4.1. Technology matrix
4.4.2. Regulatory matrix
4.5. Porter’s five forces analysis
4.5.1. Bargaining power of suppliers
4.5.2. Bargaining power of consumers
4.5.3. Threat of substitutes
4.5.4. Threat of new entrants
4.5.5. Competitive Rivalry intensity
4.6. PESTLE analysis
4.6.1. Political
4.6.2. Economical
4.6.3. Social
4.6.4. Technological
4.6.5. Legal
4.6.6. Environmental
4.7. Impact of COVID-19 on the Electric Tricycles and Microcars market
4.7.1. Pre-covid market scenario
4.7.2. Post-covid market scenario
5. Electric Tricycles and Microcars Market Analysis, by Application
5.1. Overview
5.2. Passenger Transport
5.2.1. Definition, key trends, growth factors, and opportunities
5.2.2. Market size analysis, by region, 2023-2032
5.2.3. Market share analysis, by country, 2023-2032
5.3. Cargo Delivery
5.3.1. Definition, key trends, growth factors, and opportunities
5.3.2. Market size analysis, by region, 2023-2032
5.3.3. Market share analysis, by country, 2023-2032
5.4. Research Dive Exclusive Insights
5.4.1. Market attractiveness
5.4.2. Competition heatmap
6. Electric Tricycles and Microcars Market Analysis, by Driving Range
6.1. Less than 100 Kms
6.1.1. Definition, key trends, growth factors, and opportunities
6.1.2. Market size analysis, by region, 2023-2032
6.1.3. Market share analysis, by country, 2023-2032
6.2. Between 100 to 200 Kms
6.2.1. Definition, key trends, growth factors, and opportunities
6.2.2. Market size analysis, by region, 2023-2032
6.2.3. Market share analysis, by country, 2023-2032
6.3. Above 200 Kms
6.3.1. Definition, key trends, growth factors, and opportunities
6.3.2. Market size analysis, by region, 2023-2032
6.3.3. Market share analysis, by country, 2023-2032
6.4. Research Dive Exclusive Insights
6.4.1. Market attractiveness
6.4.2. Competition heatmap
7. Electric Tricycles and Microcars Market Analysis, by Battery Type
7.1. Lithium-ion Battery
7.1.1. Definition, key trends, growth factors, and opportunities
7.1.2. Market size analysis, by region, 2023-2032
7.1.3. Market share analysis, by country, 2023-2032
7.2. Lead–acid Battery
7.2.1. Definition, key trends, growth factors, and opportunities
7.2.2. Market size analysis, by region, 2023-2032
7.2.3. Market share analysis, by country, 2023-2032
7.3. Nickel Metal Hydride Battery
7.3.1. Definition, key trends, growth factors, and opportunities
7.3.2. Market size analysis, by region, 2023-2032
7.3.3. Market share analysis, by country, 2023-2032
7.4. Others
7.4.1. Definition, key trends, growth factors, and opportunities
7.4.2. Market size analysis, by region, 2023-2032
7.4.3. Market share analysis, by country, 2023-2032
7.5. Research Dive Exclusive Insights
7.5.1. Market attractiveness
7.5.2. Competition heatmap
8. Electric Tricycles and Microcars Market, by Region
8.1. North America
8.1.1. U.S.
8.1.1.1. Market size analysis, by Application, 2023-2032
8.1.1.2. Market size analysis, by Driving Range, 2023-2032
8.1.1.3. Market size analysis, by Battery Type, 2023-2032
8.1.2. Canada
8.1.2.1. Market size analysis, by Application, 2023-2032
8.1.2.2. Market size analysis, by Driving Range, 2023-2032
8.1.2.3. Market size analysis, by Battery Type, 2023-2032
8.1.3. Mexico
8.1.3.1. Market size analysis, by Application, 2023-2032
8.1.3.2. Market size analysis, by Driving Range, 2023-2032
8.1.3.3. Market size analysis, by Battery Type, 2023-2032
8.1.4. Research Dive Exclusive Insights
8.1.4.1. Market attractiveness
8.1.4.2. Competition heatmap
8.2. Europe
8.2.1. Germany
8.2.1.1. Market size analysis, by Application, 2023-2032
8.2.1.2. Market size analysis, by Driving Range, 2023-2032
8.2.1.3. Market size analysis, by Battery Type, 2023-2032
8.2.2. UK
8.2.2.1. Market size analysis, by Application, 2023-2032
8.2.2.2. Market size analysis, by Driving Range, 2023-2032
8.2.2.3. Market size analysis, by Battery Type, 2023-2032
8.2.3. France
8.2.3.1. Market size analysis, by Application, 2023-2032
8.2.3.2. Market size analysis, by Driving Range, 2023-2032
8.2.3.3. Market size analysis, by Battery Type, 2023-2032
8.2.4. Spain
8.2.4.1. Market size analysis, by Application, 2023-2032
8.2.4.2. Market size analysis, by Driving Range, 2023-2032
8.2.4.3. Market size analysis, by Battery Type, 2023-2032
8.2.5. Italy
8.2.5.1. Market size analysis, by Application, 2023-2032
8.2.5.2. Market size analysis, by Driving Range, 2023-2032
8.2.5.3. Market size analysis, by Battery Type, 2023-2032
8.2.6. Rest of Europe
8.2.6.1. Market size analysis, by Application, 2023-2032
8.2.6.2. Market size analysis, by Driving Range, 2023-2032
8.2.6.3. Market size analysis, by Battery Type, 2023-2032
8.2.7. Research Dive Exclusive Insights
8.2.7.1. Market attractiveness
8.2.7.2. Competition heatmap
8.3. Asia-Pacific
8.3.1. China
8.3.1.1. Market size analysis, by Application, 2023-2032
8.3.1.2. Market size analysis, by Driving Range, 2023-2032
8.3.1.3. Market size analysis, by Battery Type, 2023-2032
8.3.2. Japan
8.3.2.1. Market size analysis, by Application, 2023-2032
8.3.2.2. Market size analysis, by Driving Range, 2023-2032
8.3.2.3. Market size analysis, by Battery Type, 2023-2032
8.3.3. India
8.3.3.1. Market size analysis, by Application, 2023-2032
8.3.3.2. Market size analysis, by Driving Range, 2023-2032
8.3.3.3. Market size analysis, by Battery Type, 2023-2032
8.3.4. Australia
8.3.4.1. Market size analysis, by Application, 2023-2032
8.3.4.2. Market size analysis, by Driving Range, 2023-2032
8.3.4.3. Market size analysis, by Battery Type, 2023-2032
8.3.5. South Korea
8.3.5.1. Market size analysis, by Application, 2023-2032
8.3.5.2. Market size analysis, by Driving Range, 2023-2032
8.3.5.3. Market size analysis, by Battery Type, 2023-2032
8.3.6. Rest of Asia-Pacific
8.3.6.1. Market size analysis, by Application, 2023-2032
8.3.6.2. Market size analysis, by Driving Range, 2023-2032
8.3.6.3. Market size analysis, by Battery Type, 2023-2032
8.3.7. Research Dive Exclusive Insights
8.3.7.1. Market attractiveness
8.3.7.2. Competition heatmap
8.4. LAMEA
8.4.1. Brazil
8.4.1.1. Market size analysis, by Application, 2023-2032
8.4.1.2. Market size analysis, by Driving Range, 2023-2032
8.4.1.3. Market size analysis, by Battery Type, 2023-2032
8.4.2. Saudi Arabia
8.4.2.1. Market size analysis, by Application, 2023-2032
8.4.2.2. Market size analysis, by Driving Range, 2023-2032
8.4.2.3. Market size analysis, by Battery Type, 2023-2032
8.4.3. UAE
8.4.3.1. Market size analysis, by Application, 2023-2032
8.4.3.2. Market size analysis, by Driving Range, 2023-2032
8.4.3.3. Market size analysis, by Battery Type, 2023-2032
8.4.4. South Africa
8.4.4.1. Market size analysis, by Application, 2023-2032
8.4.4.2. Market size analysis, by Driving Range, 2023-2032
8.4.4.3. Market size analysis, by Battery Type, 2023-2032
8.4.5. Rest of LAMEA
8.4.5.1. Market size analysis, by Application, 2023-2032
8.4.5.2. Market size analysis, by Driving Range, 2023-2032
8.4.5.3. Market size analysis, by Battery Type, 2023-2032
8.4.6. Research Dive Exclusive Insights
8.4.6.1. Market attractiveness
8.4.6.2. Competition heatmap
9. Competitive Landscape
9.1. Top winning strategies, 2022
9.1.1. By strategy
9.1.2. By year
9.2. Strategic overview
9.3. Market share analysis, 2021
10. Company Profiles
10.1. Mahindra Electric Mobility Limited
10.1.1. Overview
10.1.2. Business segments
10.1.3. Product portfolio
10.1.4. Financial performance
10.1.5. Recent developments
10.1.6. SWOT analysis
10.2. Piaggio & C.SpA
10.2.1. Overview
10.2.2. Business segments
10.2.3. Product portfolio
10.2.4. Financial performance
10.2.5. Recent developments
10.2.6. SWOT analysis
10.3. Terra Motors
10.3.1. Overview
10.3.2. Business segments
10.3.3. Product portfolio
10.3.4. Financial performance
10.3.5. Recent developments
10.3.6. SWOT analysis
10.4. Jiangsu Jinpeng Group Co., Ltd
10.4.1. Overview
10.4.2. Business segments
10.4.3. Product portfolio
10.4.4. Financial performance
10.4.5. Recent developments
10.4.6. SWOT analysis
10.5. Jiangsu Huaihai New Energy Vehicle Co., Ltd.
10.5.1. Overview
10.5.2. Business segments
10.5.3. Product portfolio
10.5.4. Financial performance
10.5.5. Recent developments
10.5.6. SWOT analysis
10.6. PT. SGMW Motor Indonesia.
10.6.1. Overview
10.6.2. Business segments
10.6.3. Product portfolio
10.6.4. Financial performance
10.6.5. Recent developments
10.6.6. SWOT analysis
10.7. MG Motor
10.7.1. Overview
10.7.2. Business segments
10.7.3. Product portfolio
10.7.4. Financial performance
10.7.5. Recent developments
10.7.6. SWOT analysis
10.8. Chery
10.8.1. Overview
10.8.2. Business segments
10.8.3. Product portfolio
10.8.4. Financial performance
10.8.5. Recent developments
10.8.6. SWOT analysis
10.9. Shandong Shifeng (Group) Co., Ltd.
10.9.1. Overview
10.9.2. Business segments
10.9.3. Product portfolio
10.9.4. Financial performance
10.9.5. Recent developments
10.9.6. SWOT analysis
10.10. Luvly
10.10.1. Overview
10.10.2. Business segments
10.10.3. Product portfolio
10.10.4. Financial performance
10.10.5. Recent developments
10.10.6. SWOT analysis
Personalize this research
- Triangulate with your own data
- Request your format and definition
- Get a deeper dive on a specific application, geography, customer or competitor
- + 1-888-961-4454 Toll - Free
- support@researchdive.com
