Vanilla Oil Market Report
RA09211
Vanilla Oil Market by Type (Natural Vanilla Oil, Synthetic Vanilla Oil, and Vanilla Absolute), Packaging (Drums, Cans, and Others), End-Use Industry (Food & Beverages, Personal Care, Healthcare, Home & Cleaning, and Others), and Region (North America, Europe, Asia-Pacific, and LAMEA): Global Opportunity Analysis and Industry Forecast, 2023-2032
Vanilla Oil Overview
Vanilla oil is an aromatic essential oil derived from vanilla beans through a process of extraction or infusion. Vanilla oil can be extracted using various methods, including solvent extraction or maceration in a carrier oil. It possesses the rich, sweet, and comforting aroma characteristic of vanilla. Vanilla oil is commonly used in aromatherapy, perfumery, and cosmetics for its pleasant scent and potential calming effects. It is also utilized in cooking applications to add vanilla flavor to recipes, although vanilla extract or vanilla bean paste are more commonly used for culinary purposes due to their potency and flavor profile.
In addition, vanilla oil is highly regarded in the cosmetics industry for its moisturizing and antioxidant properties, making it a popular ingredient in lotions, creams, and hair care products. With its delightful fragrance and beneficial properties, vanilla oil adds a touch of indulgence and luxury to a wide array of products and experiences, making it a cherished ingredient in both culinary and self-care realms.
Global Vanilla Oil Market Analysis
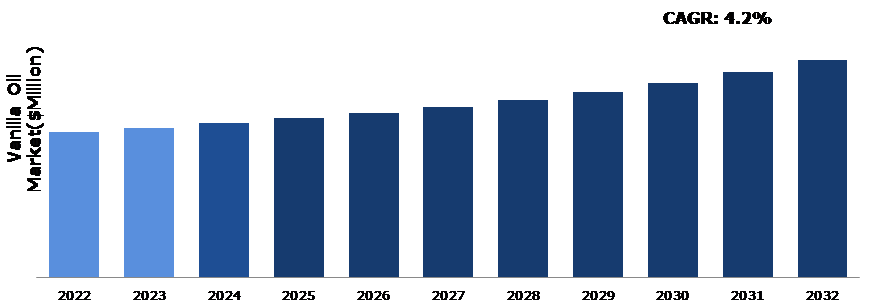
The global vanilla oil market size was $1,323.8 million in 2022 and is predicted to grow with a CAGR of 4.2%, by generating a revenue of $1,973.8 million by 2032.
Source: Research Dive Analysis
Growing Demand for Natural Food Ingredient to Drive the Market Growth
There has been an increase in preference for products which claim to use only natural components in the last few years. Customers select brands that include natural food additives into their products. It is increasingly necessary for manufacturers to market their products as ‘all-natural.’ Vanilla has been one of the most popular flavors in the food & beverage business. Cakes, pastries, muffins, dairy items, drinks, desserts, ice creams, and frostings all benefit from its flavor. Natural vanilla is becoming increasingly popular as the demand for food items incorporating natural components and food additives increases. In addition, the rising consumer belief that natural ingredients, such as vanilla oil, make food healthier is a major factor driving the global demand for natural flavors. Therefore, products with artificial components are commonly avoided, which benefits the industry. Due to the changing customer behavior and the food flavoring market dynamics, food producers are unable to produce artificial additives for use in food products. For instance, ITC, Kellogg's, General Mills, Nestle, Campbell, and Kraft have all vowed to decrease their usage of synthetic additives. This element has become a primary driving force in the global vanilla oil market growth.
High Cost of Vanilla Oil to Restrain the Market Revenue Growth
The high cost of vanilla oil presents a significant challenge to market revenue growth. Vanilla oil, used in various products like perfumes, cosmetics, and food, is becoming more expensive due to factors like limited supply and increased demand. This rise in cost is making it difficult for businesses to afford and incorporate vanilla oil into their products, hindering market expansion. Therefore, companies might have to find alternatives or reduce the amount of vanilla oil they use, affecting product quality or pricing. This challenge poses a barrier to the growth of industries relying on vanilla oil, impacting both producers and consumers. Finding solutions to mitigate the cost increase is crucial for sustaining market growth and ensuring the availability of vanilla oil-based products in the future.
Rising Demand for Organic Food to Drive Excellent Opportunities in the Market
The growing need for organic food has created a large demand for organic vanilla oil. Organic vanilla is cultivated on soil that is free of chemical fertilizers, and synthetic pesticides and herbicides are not allowed in organic vanilla farming. It is processed, with no fumigation or irradiation, preserving its natural flavor and fragrance. Many regulatory authorities across the world grant certification to enterprises involved in organic farming and manufacture. Organic foods have grown in popularity as people become more aware regarding their benefits. As consumers look for products that are 100% natural and free of synthetic ingredients like preservatives, artificial colors, and flavors, clean-label products are growing in popularity. Ingredients like vanilla oil are used to flavor a wide range of meals, such as cakes, ice creams, cookies, pastries, and sweets. Manufacturers of clean label and plant-based foods prefer vanilla oil as a natural flavoring component derived from plants. During the forecast period, the demand for natural vanilla oil is expected to be heavily influenced by the increasing trends of clean-label food and a vegetarian diet.
Global Vanilla Oil Market Share, by Type, 2022

Source: Research Dive Analysis
The synthetic vanilla oil sub-segment accounted for the highest market share in 2022. One significant factor driving the segment growth is the cost-effectiveness of synthetic vanilla oil compared to its natural counterpart. Synthetic production methods offer a more efficient and consistent supply chain, resulting in lower production costs and stable pricing, which appeals to manufacturers and consumers. In addition, advancements in technology have led to the development of synthetic vanilla oils that closely mimic the aroma and flavor profile of natural vanilla, meeting consumer expectations for quality and sensory experience. Moreover, the scalability of synthetic production allows for greater flexibility in meeting increasing demand from various industries, including food & beverage, cosmetics, and pharmaceuticals. Overall, the combination of cost-effectiveness, technological advancements, and scalability drives the growth of the synthetic vanilla oil type segment in the market.
Global Vanilla Oil Market Share, by Packaging, 2022

Source: Research Dive Analysis
The drums sub-segment accounted for the highest market share in 2022. The increasing demand for vanilla oil in bulk quantities, particularly from industries such as cosmetics, food processing, and pharmaceuticals, drives the growth of the drums packaging segment. Bulk packaging in drums offers cost-effectiveness and convenience for businesses requiring large volumes of vanilla oil for their manufacturing processes. In addition, stringent regulations regarding product safety and hygiene necessitate secure and durable packaging solutions like drums, ensuring the integrity of the vanilla oil during storage and transportation. Moreover, the drums packaging segment benefits from the growing trend of eco-friendly packaging, as manufacturers seek sustainable alternatives to reduce environmental impact. Therefore, the drums sub-segment plays a pivotal role in meeting the rising demand for vanilla oil across various industries.
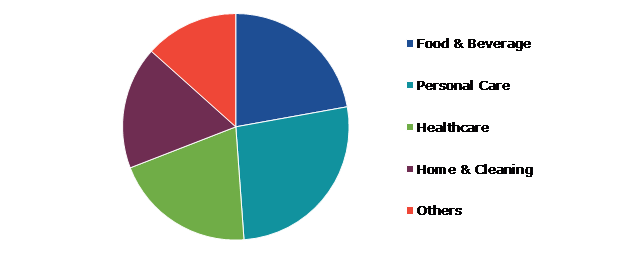
Global Vanilla Oil Market Share, by End-use Industry, 2022
Source: Research Dive Analysis
The food & beverages sub-segment accounted for the highest market share in 2022. The widespread use of vanilla oil as a flavoring agent in a variety of food & beverage products contributes significantly to its demand. Vanilla oil's rich and distinct flavor profile enhances the taste and aroma of numerous cooking conceptions, from cooked products to dairy products and beverages. Moreover, as consumers increasingly seek natural and premium ingredients in their food and drinks, vanilla oil presents itself as a desirable option due to its natural origin and authentic taste. In addition, the growing popularity of gourmet and artisanal food products further boosts the demand for vanilla oil, as it is often considered a staple ingredient in high-quality culinary creations, catering to discerning consumers' preferences for indulgent and flavorful experiences.
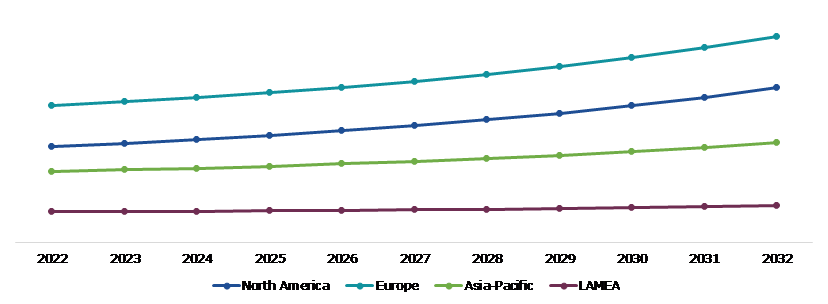
Global Vanilla Oil Market Size & Forecast, by Region, 2022-2032 ($Million)
Source: Research Dive Analysis
The Europe vanilla oil market share generated the highest revenue in 2022, due to the increasing consumer demand for natural and organic products. Owing to growing awareness about health & wellness, consumers are looking for products made with natural ingredients like vanilla oil, which is known for its aromatic and therapeutic properties. In addition, the rising popularity of gourmet foods and luxury cosmetics further boosts the demand for vanilla oil in the European market. Moreover, the versatility of vanilla oil in various industries, including food & beverages, cosmetics, and aromatherapy, provides ample opportunities for the regional market expansion. As companies continue to innovate and introduce new products containing vanilla oil, the European market is expected to experience steady growth in the upcoming years.
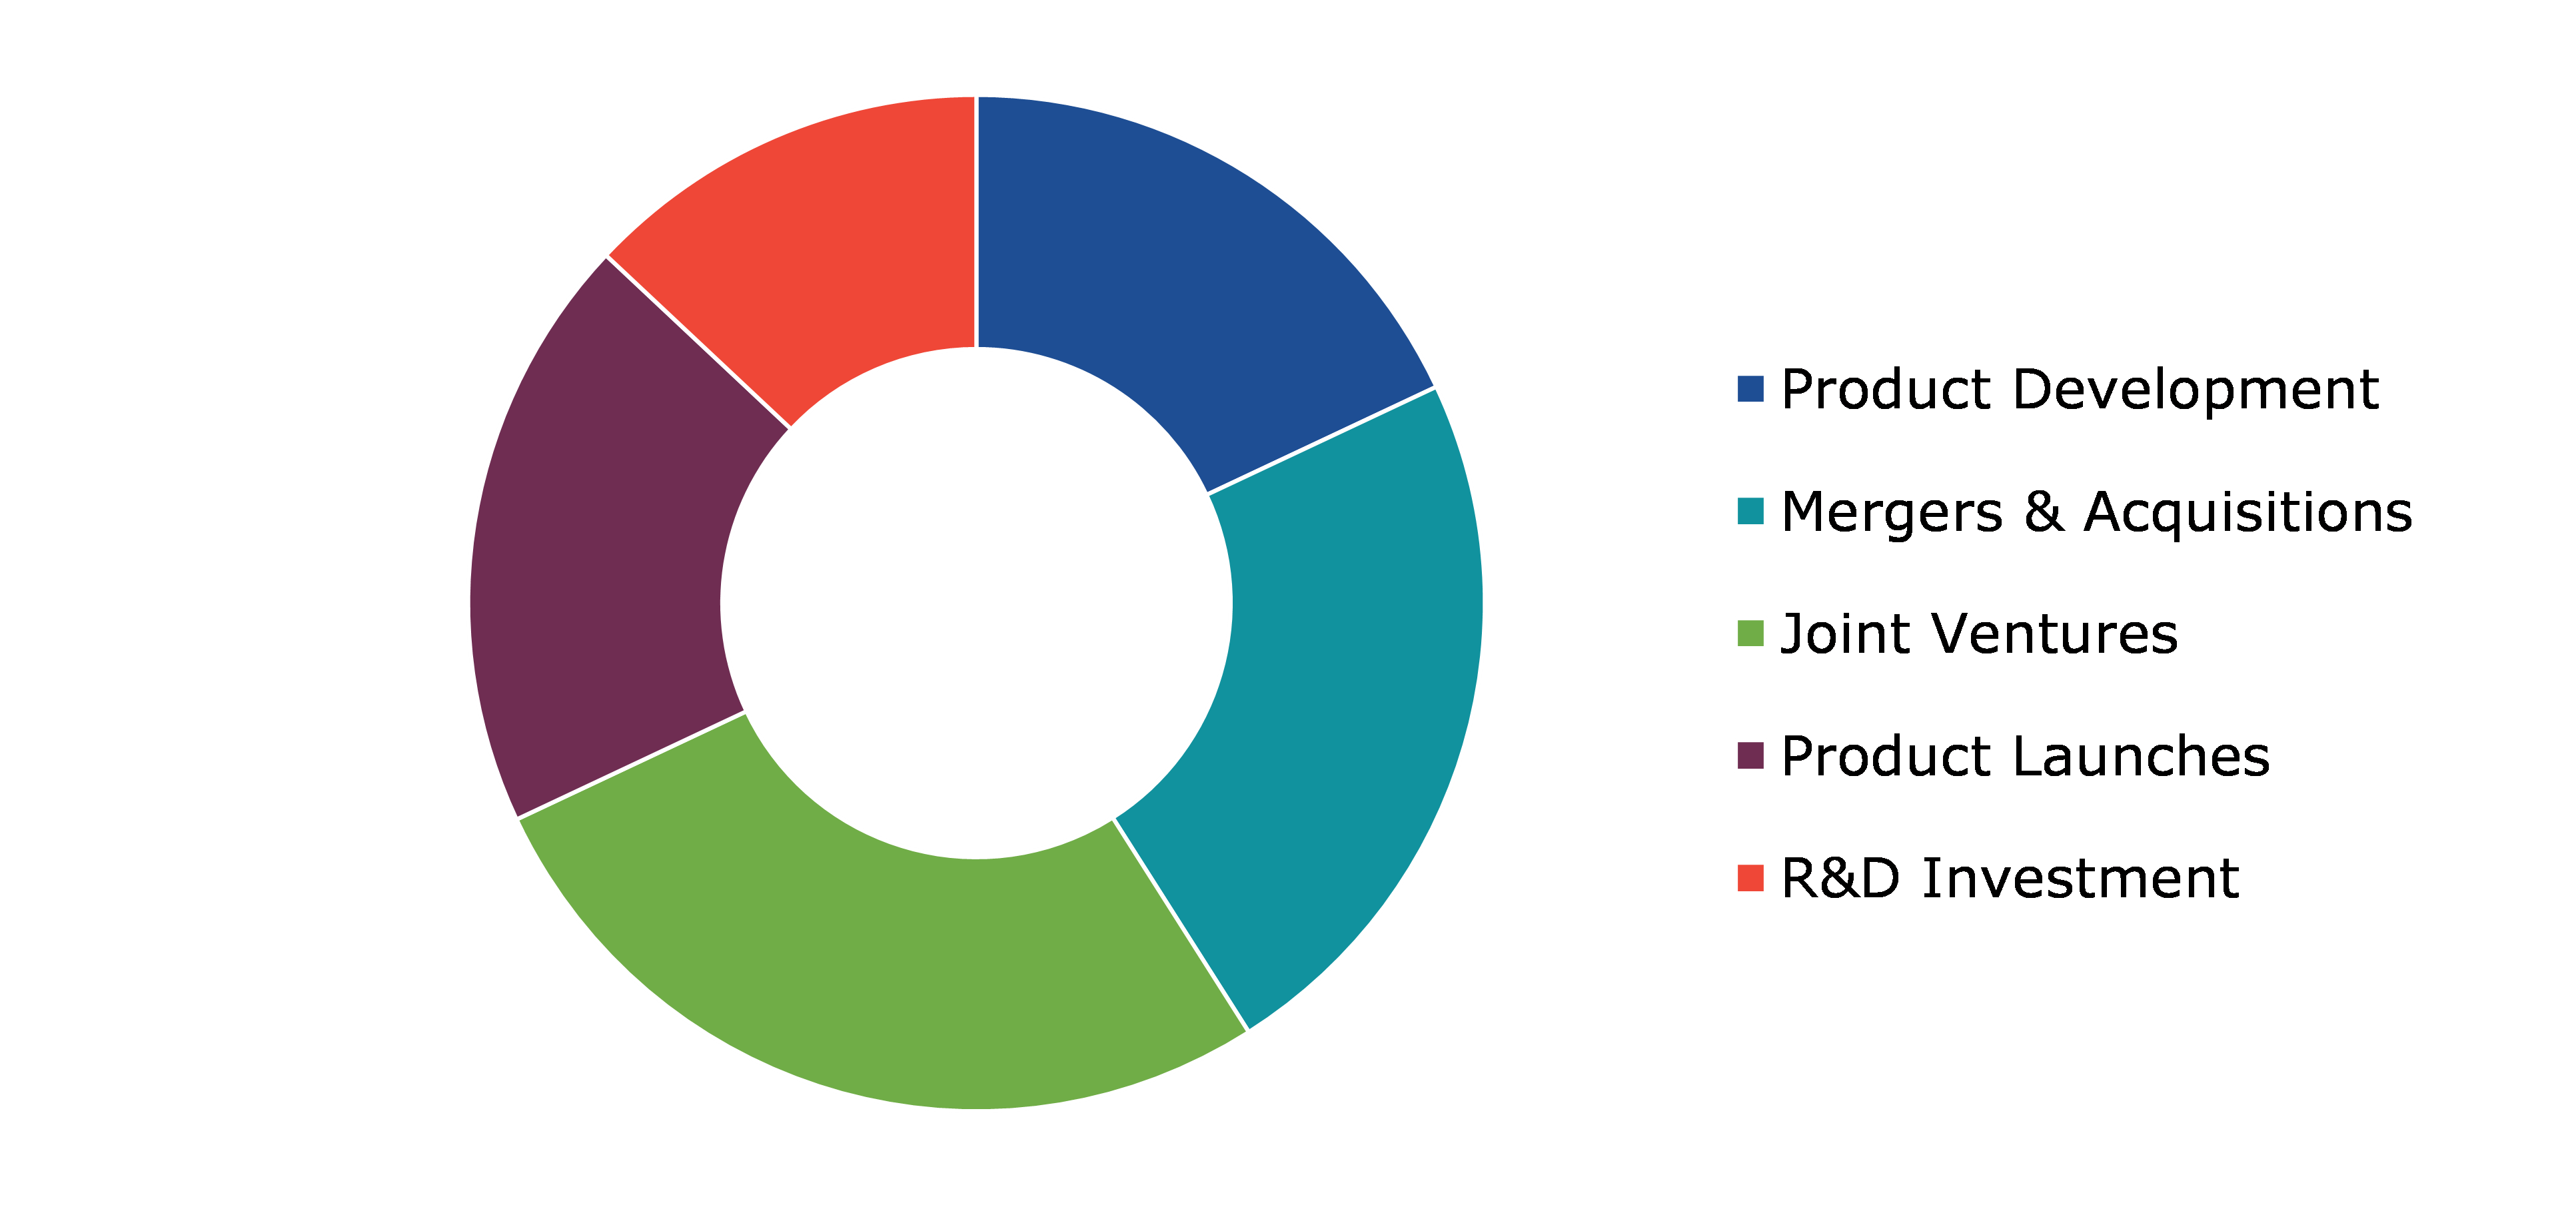
Competitive Scenario in the Global Vanilla Oil Market
Investment and agreement are common strategies followed by major market players. One of the leading market players in the industry is Blue Pacific Flavours. For instance, in January 2021, Blue Pacific Flavours, a U.S. company, unveiled Kilimanjaro Vanilla, a sustainable vanilla extract, catering to consumers' preference for natural, clean-label, and eco-friendly products. This launch signifies a commitment toward meeting evolving market demands while ensuring responsible sourcing and production practices. Kilimanjaro Vanilla aligns with growing consumer expectations for sustainability, offering a guilt-free option for flavor enhancement.
Source: Research Dive Analysis
Some of the companies operating in the vanilla oil market analysis are Givaudan, BB International, The James Farrer Group, Symrise, Frutarom, Robertet S.A, Elizabeth Shaw, Floracopeia, Virginia Dare Extract Company, and Amano Fragrance.
| Aspect | Particulars |
| Historical Market Estimations | 2020-2021 |
| Base Year for Market Estimation | 2022 |
| Forecast Timeline for Market Projection | 2023-2032 |
| Geographical Scope | North America, Europe, Asia-Pacific, and LAMEA |
| Segmentation by Type |
|
| Segmentation by Packaging |
|
|
Segmentation by End-Use Industry
|
|
| Key Companies Profiled |
|
Q1. What is the size of the global vanilla oil market?
A. The size of the global vanilla oil market size was over $1,323.8 million in 2022 and is projected to reach $1,973.8 million by 2032.
Q2. Which are the major companies in the vanilla oil market?
A. Givaudan, BB International, and The James Farrer Group are some of the key players in the global vanilla oil market.
Q3. Which region, among others, possesses greater investment opportunities in the future?
A. North America possesses great investment opportunities for investors in the future.
Q4. What will be the growth rate of the North America vanilla oil market?
A. The North America vanilla oil market share is anticipated to grow at 5.1% CAGR during the forecast period.
Q5. What are the strategies opted by the leading players in this market?
A. Agreement and investment are the two key strategies opted by the operating companies in this market.
Q6. Which companies are investing more on R&D practices?
A. Givaudan, BB International, and The James Farrer Group are the companies investing more on R&D activities for developing new products and technologies.
1. Research Methodology
1.1. Desk Research
1.2. Real time insights and validation
1.3. Forecast model
1.4. Assumptions and forecast parameters
1.5. Market size estimation
1.5.1. Top-down approach
1.5.2. Bottom-up approach
2. Report Scope
2.1. Market definition
2.2. Key objectives of the study
2.3. Market segmentation
3. Executive Summary
4. Market Overview
4.1. Introduction
4.2. Growth impact forces
4.2.1. Drivers
4.2.2. Restraints
4.2.3. Opportunities
4.3. Market value chain analysis
4.3.1. List of raw material suppliers
4.3.2. List of manufacturers
4.3.3. List of distributors
4.4. Innovation & sustainability matrices
4.4.1. Technology matrix
4.4.2. Regulatory matrix
4.5. Porter’s five forces analysis
4.5.1. Bargaining power of suppliers
4.5.2. Bargaining power of consumers
4.5.3. Threat of substitutes
4.5.4. Threat of new entrants
4.5.5. Competitive rivalry intensity
4.6. PESTLE analysis
4.6.1. Political
4.6.2. Economical
4.6.3. Social
4.6.4. Technological
4.6.5. Legal
4.6.6. Environmental
5. Vanilla Oil Market Analysis, by Type
5.1. Overview
5.2. Natural Vanilla Oil
5.2.1. Definition, key trends, growth factors, and opportunities
5.2.2. Market size analysis, by region, 2022-2032
5.2.3. Market share analysis, by country, 2022-2032
5.3. Synthetic Vanilla Oil
5.3.1. Definition, key trends, growth factors, and opportunities
5.3.2. Market size analysis, by region, 2022-2032
5.3.3. Market share analysis, by country, 2022-2032
5.4. Vanilla Absolute
5.4.1. Definition, key trends, growth factors, and opportunities
5.4.2. Market size analysis, by region, 2022-2032
5.4.3. Market share analysis, by country, 2022-2032
5.5. Research Dive Exclusive Insights
5.5.1. Market attractiveness
5.5.2. Competition heatmap
6. Vanilla Oil Market Analysis, by Packaging
6.1. Drums
6.1.1. Definition, key trends, growth factors, and opportunities
6.1.2. Market size analysis, by region, 2022-2032
6.1.3. Market share analysis, by country, 2022-2032
6.2. Cans
6.2.1. Definition, key trends, growth factors, and opportunities
6.2.2. Market size analysis, by region, 2022-2032
6.2.3. Market share analysis, by country, 2022-2032
6.3. Others
6.3.1. Definition, key trends, growth factors, and opportunities
6.3.2. Market size analysis, by region, 2022-2032
6.3.3. Market share analysis, by country, 2022-2032
6.4. Research Dive Exclusive Insights
6.4.1. Market attractiveness
6.4.2. Competition heatmap
7. Vanilla Oil Market Analysis, by End-use Industry
7.1. Food & Beverages
7.1.1. Definition, key trends, growth factors, and opportunities
7.1.2. Market size analysis, by region, 2022-2032
7.1.3. Market share analysis, by country, 2022-2032
7.2. Personal Care
7.2.1. Definition, key trends, growth factors, and opportunities
7.2.2. Market size analysis, by region, 2022-2032
7.2.3. Market share analysis, by country, 2022-2032
7.3. Healthcare
7.3.1. Definition, key trends, growth factors, and opportunities
7.3.2. Market size analysis, by region, 2022-2032
7.3.3. Market share analysis, by country, 2022-2032
7.4. Home & Cleaning
7.4.1. Definition, key trends, growth factors, and opportunities
7.4.2. Market size analysis, by region, 2022-2032
7.4.3. Market share analysis, by country, 2022-2032
7.5. Others
7.5.1. Definition, key trends, growth factors, and opportunities
7.5.2. Market size analysis, by region, 2022-2032
7.5.3. Market share analysis, by country, 2022-2032
7.6. Research Dive Exclusive Insights
7.6.1. Market attractiveness
7.6.2. Competition heatmap
8. Vanilla Oil Market, by Region
8.1. North America
8.1.1. U.S.
8.1.1.1. Market size analysis, by Type, 2022-2032
8.1.1.2. Market size analysis, by Packaging, 2022-2032
8.1.1.3. Market size analysis, by End-use Industry, 2022-2032
8.1.2. Canada
8.1.2.1. Market size analysis, by Type, 2022-2032
8.1.2.2. Market size analysis, by Packaging, 2022-2032
8.1.2.3. Market size analysis, by End-use Industry, 2022-2032
8.1.3. Mexico
8.1.3.1. Market size analysis, by Type, 2022-2032
8.1.3.2. Market size analysis, by Packaging, 2022-2032
8.1.3.3. Market size analysis, by End-use Industry, 2022-2032
8.1.4. Research Dive Exclusive Insights
8.1.4.1. Market attractiveness
8.1.4.2. Competition heatmap
8.2. Europe
8.2.1. Germany
8.2.1.1. Market size analysis, by Type, 2022-2032
8.2.1.2. Market size analysis, by Packaging, 2022-2032
8.2.1.3. Market size analysis, by End-use Industry, 2022-2032
8.2.2. UK
8.2.2.1. Market size analysis, by Type, 2022-2032
8.2.2.2. Market size analysis, by Packaging, 2022-2032
8.2.2.3. Market size analysis, by End-use Industry, 2022-2032
8.2.3. France
8.2.3.1. Market size analysis, by Type, 2022-2032
8.2.3.2. Market size analysis, by Packaging, 2022-2032
8.2.3.3. Market size analysis, by End-use Industry, 2022-2032
8.2.4. Spain
8.2.4.1. Market size analysis, by Type, 2022-2032
8.2.4.2. Market size analysis, by Packaging, 2022-2032
8.2.4.3. Market size analysis, by End-use Industry, 2022-2032
8.2.5. Italy
8.2.5.1. Market size analysis, by Type, 2022-2032
8.2.5.2. Market size analysis, by Packaging, 2022-2032
8.2.5.3. Market size analysis, by End-use Industry, 2022-2032
8.2.6. Rest of Europe
8.2.6.1. Market size analysis, by Type, 2022-2032
8.2.6.2. Market size analysis, by Packaging, 2022-2032
8.2.6.3. Market size analysis, by End-use Industry, 2022-2032
8.2.7. Research Dive Exclusive Insights
8.2.7.1. Market attractiveness
8.2.7.2. Competition heatmap
8.3. Asia-Pacific
8.3.1. China
8.3.1.1. Market size analysis, by Type, 2022-2032
8.3.1.2. Market size analysis, by Packaging, 2022-2032
8.3.1.3. Market size analysis, by End-use Industry, 2022-2032
8.3.2. Japan
8.3.2.1. Market size analysis, by Type, 2022-2032
8.3.2.2. Market size analysis, by Packaging, 2022-2032
8.3.2.3. Market size analysis, by End-use Industry, 2022-2032
8.3.3. India
8.3.3.1. Market size analysis, by Type, 2022-2032
8.3.3.2. Market size analysis, by Packaging, 2022-2032
8.3.3.3. Market size analysis, by End-use Industry, 2022-2032
8.3.4. Australia
8.3.4.1. Market size analysis, by Type, 2022-2032
8.3.4.2. Market size analysis, by Packaging, 2022-2032
8.3.4.3. Market size analysis, by End-use Industry, 2022-2032
8.3.5. South Korea
8.3.5.1. Market size analysis, by Type, 2022-2032
8.3.5.2. Market size analysis, by Packaging, 2022-2032
8.3.5.3. Market size analysis, by End-use Industry, 2022-2032
8.3.6. Rest of Asia-Pacific
8.3.6.1. Market size analysis, by Type, 2022-2032
8.3.6.2. Market size analysis, by Packaging, 2022-2032
8.3.6.3. Market size analysis, by End-use Industry, 2022-2032
8.3.7. Research Dive Exclusive Insights
8.3.7.1. Market attractiveness
8.3.7.2. Competition heatmap
8.4. LAMEA
8.4.1. Brazil
8.4.1.1. Market size analysis, by Type, 2022-2032
8.4.1.2. Market size analysis, by Packaging, 2022-2032
8.4.1.3. Market size analysis, by End-use Industry, 2022-2032
8.4.2. Saudi Arabia
8.4.2.1. Market size analysis, by Type, 2022-2032
8.4.2.2. Market size analysis, by Packaging, 2022-2032
8.4.2.3. Market size analysis, by End-use Industry, 2022-2032
8.4.3. UAE
8.4.3.1. Market size analysis, by Type, 2022-2032
8.4.3.2. Market size analysis, by Packaging, 2022-2032
8.4.3.3. Market size analysis, by End-use Industry, 2022-2032
8.4.4. South Africa
8.4.4.1. Market size analysis, by Type, 2022-2032
8.4.4.2. Market size analysis, by Packaging, 2022-2032
8.4.4.3. Market size analysis, by End-use Industry, 2022-2032
8.4.5. Rest of LAMEA
8.4.5.1. Market size analysis, by Type, 2022-2032
8.4.5.2. Market size analysis, by Packaging, 2022-2032
8.4.5.3. Market size analysis, by End-use Industry, 2022-2032
8.4.6. Research Dive Exclusive Insights
8.4.6.1. Market attractiveness
8.4.6.2. Competition heatmap
9. Competitive Landscape
9.1. Top winning strategies, 2022
9.1.1. By strategy
9.1.2. By year
9.2. Strategic overview
9.3. Market share analysis, 2022
10. Company Profiles
10.1. Givaudan
10.1.1. Overview
10.1.2. Business segments
10.1.3. Product portfolio
10.1.4. Financial performance
10.1.5. Recent developments
10.1.6. SWOT analysis
10.2. BB International
10.2.1. Overview
10.2.2. Business segments
10.2.3. Product portfolio
10.2.4. Financial performance
10.2.5. Recent developments
10.2.6. SWOT analysis
10.3. The James Farrer Group
10.3.1. Overview
10.3.2. Business segments
10.3.3. Product portfolio
10.3.4. Financial performance
10.3.5. Recent developments
10.3.6. SWOT analysis
10.4. Symrise
10.4.1. Overview
10.4.2. Business segments
10.4.3. Product portfolio
10.4.4. Financial performance
10.4.5. Recent developments
10.4.6. SWOT analysis
10.5. Frutarom
10.5.1. Overview
10.5.2. Business segments
10.5.3. Product portfolio
10.5.4. Financial performance
10.5.5. Recent developments
10.5.6. SWOT analysis
10.6. Robertet S.A
10.6.1. Overview
10.6.2. Business segments
10.6.3. Product portfolio
10.6.4. Financial performance
10.6.5. Recent developments
10.6.6. SWOT analysis
10.7. Elizabeth Shaw
10.7.1. Overview
10.7.2. Business segments
10.7.3. Product portfolio
10.7.4. Financial performance
10.7.5. Recent developments
10.7.6. SWOT analysis
10.8. Floracopeia
10.8.1. Overview
10.8.2. Business segments
10.8.3. Product portfolio
10.8.4. Financial performance
10.8.5. Recent developments
10.8.6. SWOT analysis
10.9. Virginia Dare Extract Company
10.9.1. Overview
10.9.2. Business segments
10.9.3. Product portfolio
10.9.4. Financial performance
10.9.5. Recent developments
10.9.6. SWOT analysis
10.10. Amano Fragrance
10.10.1. Overview
10.10.2. Business segments
10.10.3. Product portfolio
10.10.4. Financial performance
10.10.5. Recent developments
10.10.6. SWOT analysis
Personalize this research
- Triangulate with your own data
- Request your format and definition
- Get a deeper dive on a specific application, geography, customer or competitor
- + 1-888-961-4454 Toll - Free
- support@researchdive.com
