Power Grid Market Report
RA09197
Power Grid Market by Component (Power Generation, Transmission Lines, Distribution Networks, and Consumer Use), Energy Source (Solar, Wind, Natural Gas, Coal, and Others), and Region (North America, Europe, Asia-Pacific, and LAMEA): Global Opportunity Analysis and Industry Forecast, 2023-2032
Power Grid Overview
The power grid is a vast network of synchronized power providers that is responsible for transmitting the electricity from power station to the consumers. The power grid is operated by one or more control centers, that are responsible for transmission of electricity. The power grid has grown rapidly from small local designs, to connecting millions of homes and businesses today. Thus, the transmission of electricity from power plants to consumers is known as a power distribution grid. The three major components in the power grid are electricity generation, transmission, and distribution. Electricity generation takes place in the power plants, where the mechanical energy of turbine is converted into electrical energy with the use of generator, except for the solar power plants that use photovoltaic cells for electricity generation. Electricity transmission is accomplished by the use of power lines. For instance, the electricity exiting the power plant passes through a transmission station where the electricity is ‘stepped-up’. The electricity distribution first begins with distribution substations that use ‘step-down’ transformers, which perform the opposite task of the step-up transformer. The step-down transformers bring the voltage down to safer levels.
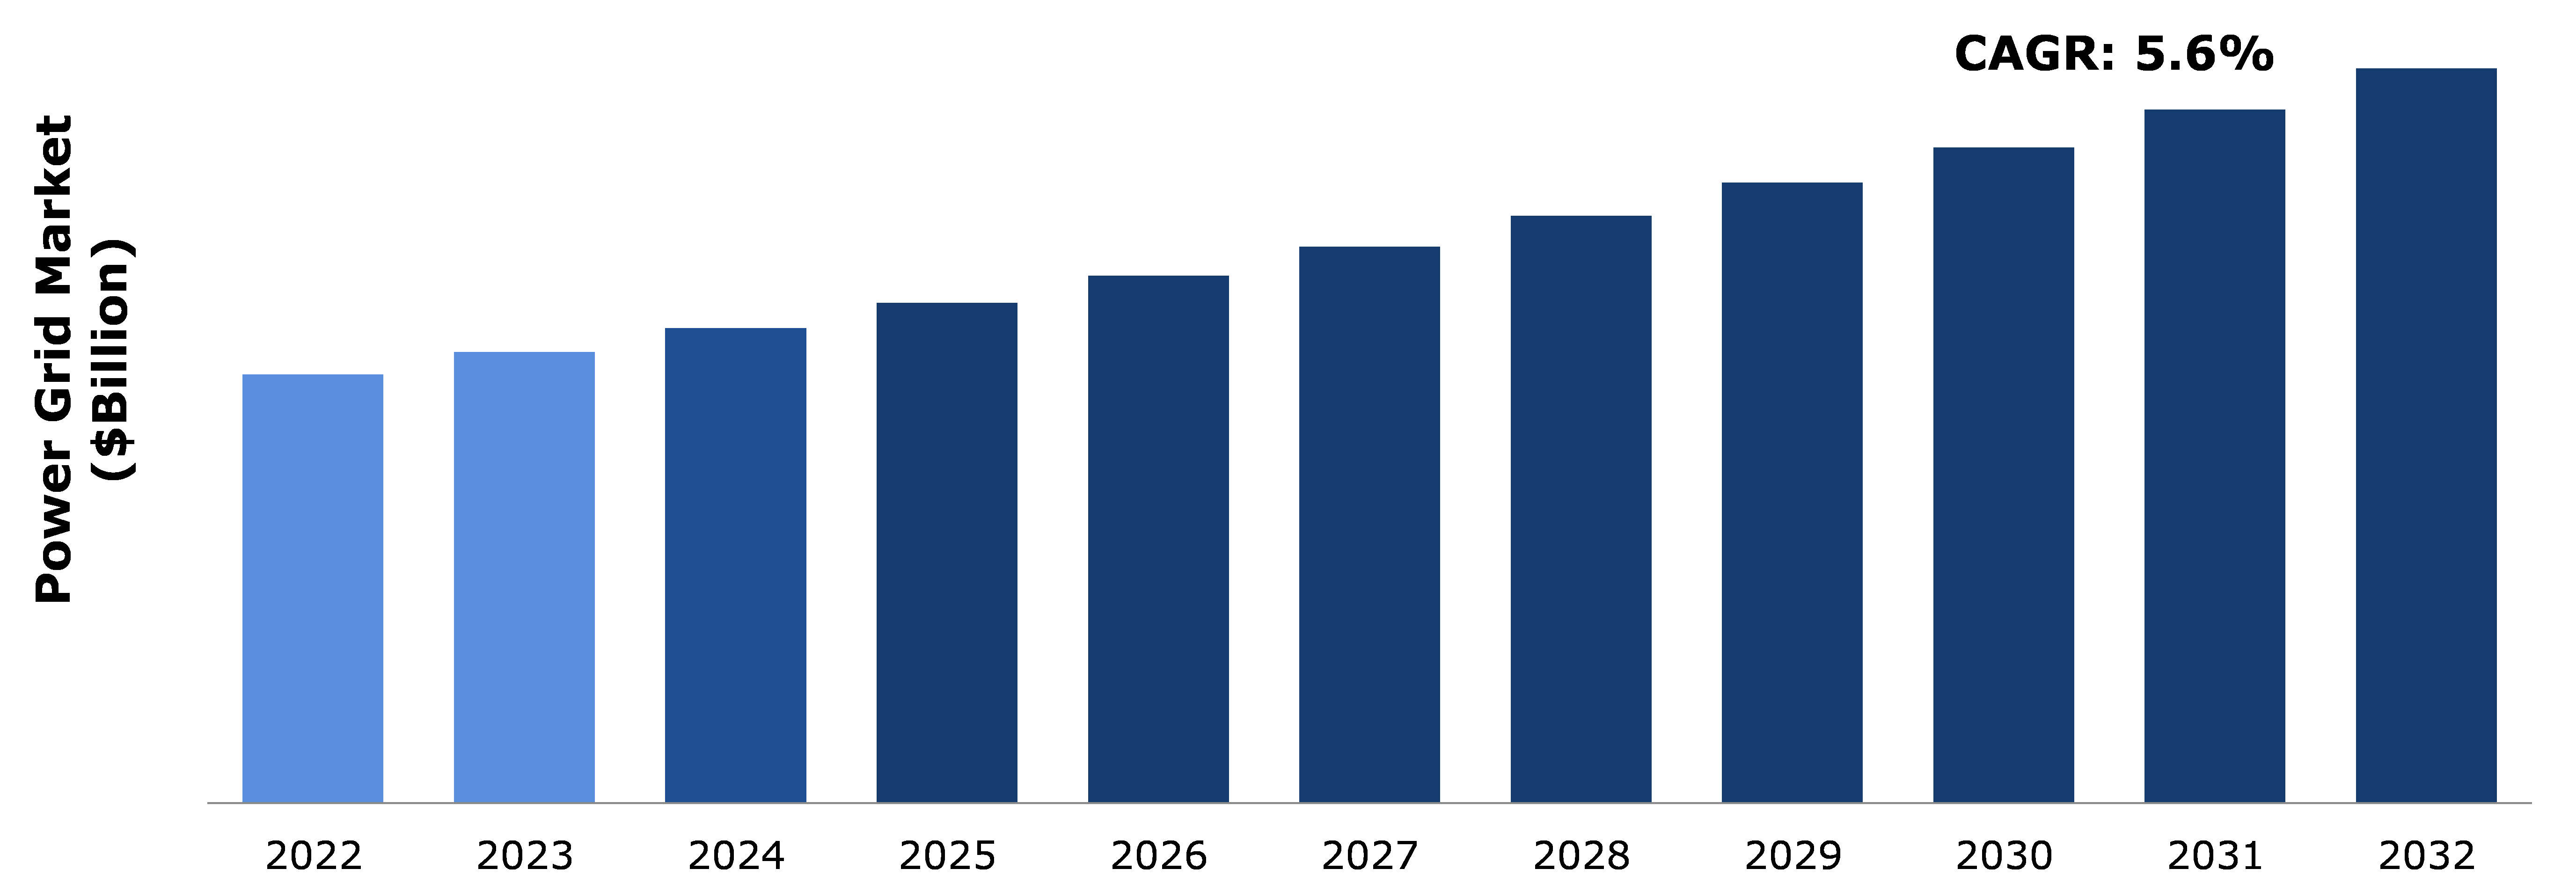
Global Power Grid Market Analysis
The global power grid market size was $241.6 billion in 2022 and is predicted to grow with a CAGR of 5.6%, by generating a revenue of $413.9 billion by 2032.
Source: Research Dive Analysis
COVID-19 Impact on the Global Power Grid Market
The COVID-19 outbreak, and subsequent lockdowns had a significant impact on the global electricity generation, transmission, and distribution. This is because many countries implemented collective mitigation actions to curb the virus's spread owing to which significant disruptions were observed in the operations of electrical grids worldwide.
One of the immediate effects of the pandemic was a substantial reduction in electricity demand. With a majority of the population adhering to lockdowns and social distancing measures, the traditional energy usage patterns underwent a notable shift. The widespread adoption of remote work and stay-at-home measures led to a surge in residential energy consumption, while commercial and industrial loads experienced a significant decrease. Governments in various countries reported a reduction in electricity demand ranging from 3% to 10% in affected regions. These factors led to a negative impact on the power grid market opportunities during the pandemic.
Increase in Global Energy Demand to Drive the Market Growth
The energy demand is increasing rapidly owing to a rise in demand from the industrial and residential sectors. Rapid industrialization in developing economies such as China, Japan, India, and others have led to rise in demand for reliable electricity generation methods. Global energy demand is expected to increase by 48% in the next 20 years. Currently, 80% of the energy demand is met by fossil fuels. However, depleting fossil fuel reserves has paved the way for renewable energy sources leading to an increase in demand for solar energy, wind energy, biofuels, and others. For instance, in 2022, the India’s energy demand increased by whopping 8% which is almost double the pace of power demand of Asia-Pacific. This rising energy demand in India is majorly attributed to higher economic, commercial, and industrial activities. In addition, globally the electricity produced from renewable sources such as wind, solar, and other sources increased by 6% in 2021, coal-fired electricity generation increased by 9%, gas-fired electricity generation increased by 2%, while the nuclear electricity generation increased by 3.5% which almost reached the pre-pandemic levels. Thus, higher energy demand is expected to have a positive impact on the power grid market size leading to substantial investments in the grid components such as transformers, substations, and others.
Electricity Transmission Losses to Restrain the Market Growth
The transmission of electricity over longer distances increases the temperature within power lines that leads to significant energy losses in the form of heat. An increase in energy demand is leading to an increase in electricity transmission losses which is anticipated to restrain market growth in the upcoming years. For instance, in India, the electricity transmission losses were more than 19% in 2021, compared to Europe which accounted for electricity transmission loss of 4%-5%.
In addition, many power grids around the world have aging infrastructure, which can lead to increased maintenance requirements, higher susceptibility to failures, and a need for significant investments in modernization. Also, traditional power grids heavily depend on fossil fuels, contributing to environmental issues such as air pollution and greenhouse gas emissions. In addition, stringent regulations and slow regulatory processes are expected to impede the implementation of innovative technologies and hinder the grid's ability to adapt to changing energy landscapes. These factors are anticipated to restrain the power grid market growth in the upcoming years.
Smart Grid Technologies and Solutions to Drive Excellent Opportunities
Globalization has led to an increase in energy demand that has paved the way for the adoption of smart grid technologies and smart grid solutions. For instance, cities account for 75%-80% of global energy consumption resulting in huge greenhouse gas emissions. The traditional power networks, comprising of power grid are majorly concerned with energy generation, transmission, and distribution. However, these traditional power grids are unstable that can result in low power quality, transmission losses, insufficient electricity supply, and other issues. Thus, the smart grid technologies and solutions that comprise automated control and monitoring systems are gaining huge popularity. These smart grid technologies are equipped with real-time control and monitoring of local variations in the power usage. Smart grid technologies offer real-time monitoring, control, and analysis of electricity network that improves the energy efficiency, reduces energy consumption, and ensures the reliability of energy supply chain. In addition, these smart grid solutions are more efficient in power generation and distribution owing to flexibility offered by these networks.
Global Power Grid Market Share, by Component, 2022

Source: Research Dive Analysis
The power generation sub-segment accounted for the highest market share in 2022. Power generation is a crucial component of power grid as it offers stability, reliability, and continuous supply of electricity. The power generation component converts various energy sources such as wind, coal, solar, natural gas, hydropower, and others into electricity. The generated electricity is then distributed across grids to meet the energy demand from commercial, industrial, and residential sectors. In addition, the power generation component helps in balancing the electricity demand and supply by maintaining the grid frequency within a narrow range. Also, fluctuations in the electricity demand based on high and low electricity usage is taken care by the power generation component. These aspects are anticipated to boost the popularity of power generation component in the power grid industry during the forecast period.
Global Power Grid Market Share, by Energy Source, 2022

Source: Research Dive Analysis
The natural gas sub-segment accounted for the highest market share in 2022. Natural gas as an energy source, is a cost-effective way of electricity generation via power grid. This is because the extraction, transportation, as well as the conversion processes of electricity are quite economical compared to fossil fuel-based electricity generation. In addition, the countries such as U.S. have abundant reserves of natural gas, that ensures the energy security and makes natural gas a reliable fuel for electricity generation. Furthermore, compared to coal and oil, natural gas is a clean-burning fuel that reduces the emission of greenhouse gases. The natural gas power plants can be effectively scaled-up and down, that helps in meeting the varying energy demand and maintaining the grid stability.
Global Power Grid Market Size & Forecast, by Region, 2022-2032 ($Billion)

Source: Research Dive Analysis
The Asia-Pacific power grid market generated the highest revenue in 2022. The rapid advancements in energy section in the Asia-Pacific countries namely India, China, Japan, and others is driving the power grid market growth. For instance, in India, 7,200 MW of Inter- regional (IR) Transmission Capacity was added in 2021-2022, resulting to cumulative figure of 1,12,250 MW (as of January 2023). In addition, the renewable energy capacity in India as of November 2021, accounted for 150.54 GW. This renewable energy capacity comprised of solar (48.55 GW), wind (40.03 GW), small hydro power (4.83 GW), bio-mass (10.62 GW), and large hydro (46.51 GW). In addition, various power generation and electrification initiatives were launched in India. For instance, Pradhan Mantri Sahaj Bijli Har Ghar Yojana (SAUBHAGYA) launched in September 2017 and Deen Dayal Upadhyaya Gram Jyoti Yojana (DDUGJY) launched in 2014, focuses on strengthening the electricity distribution network and ensuring the supply of electricity.
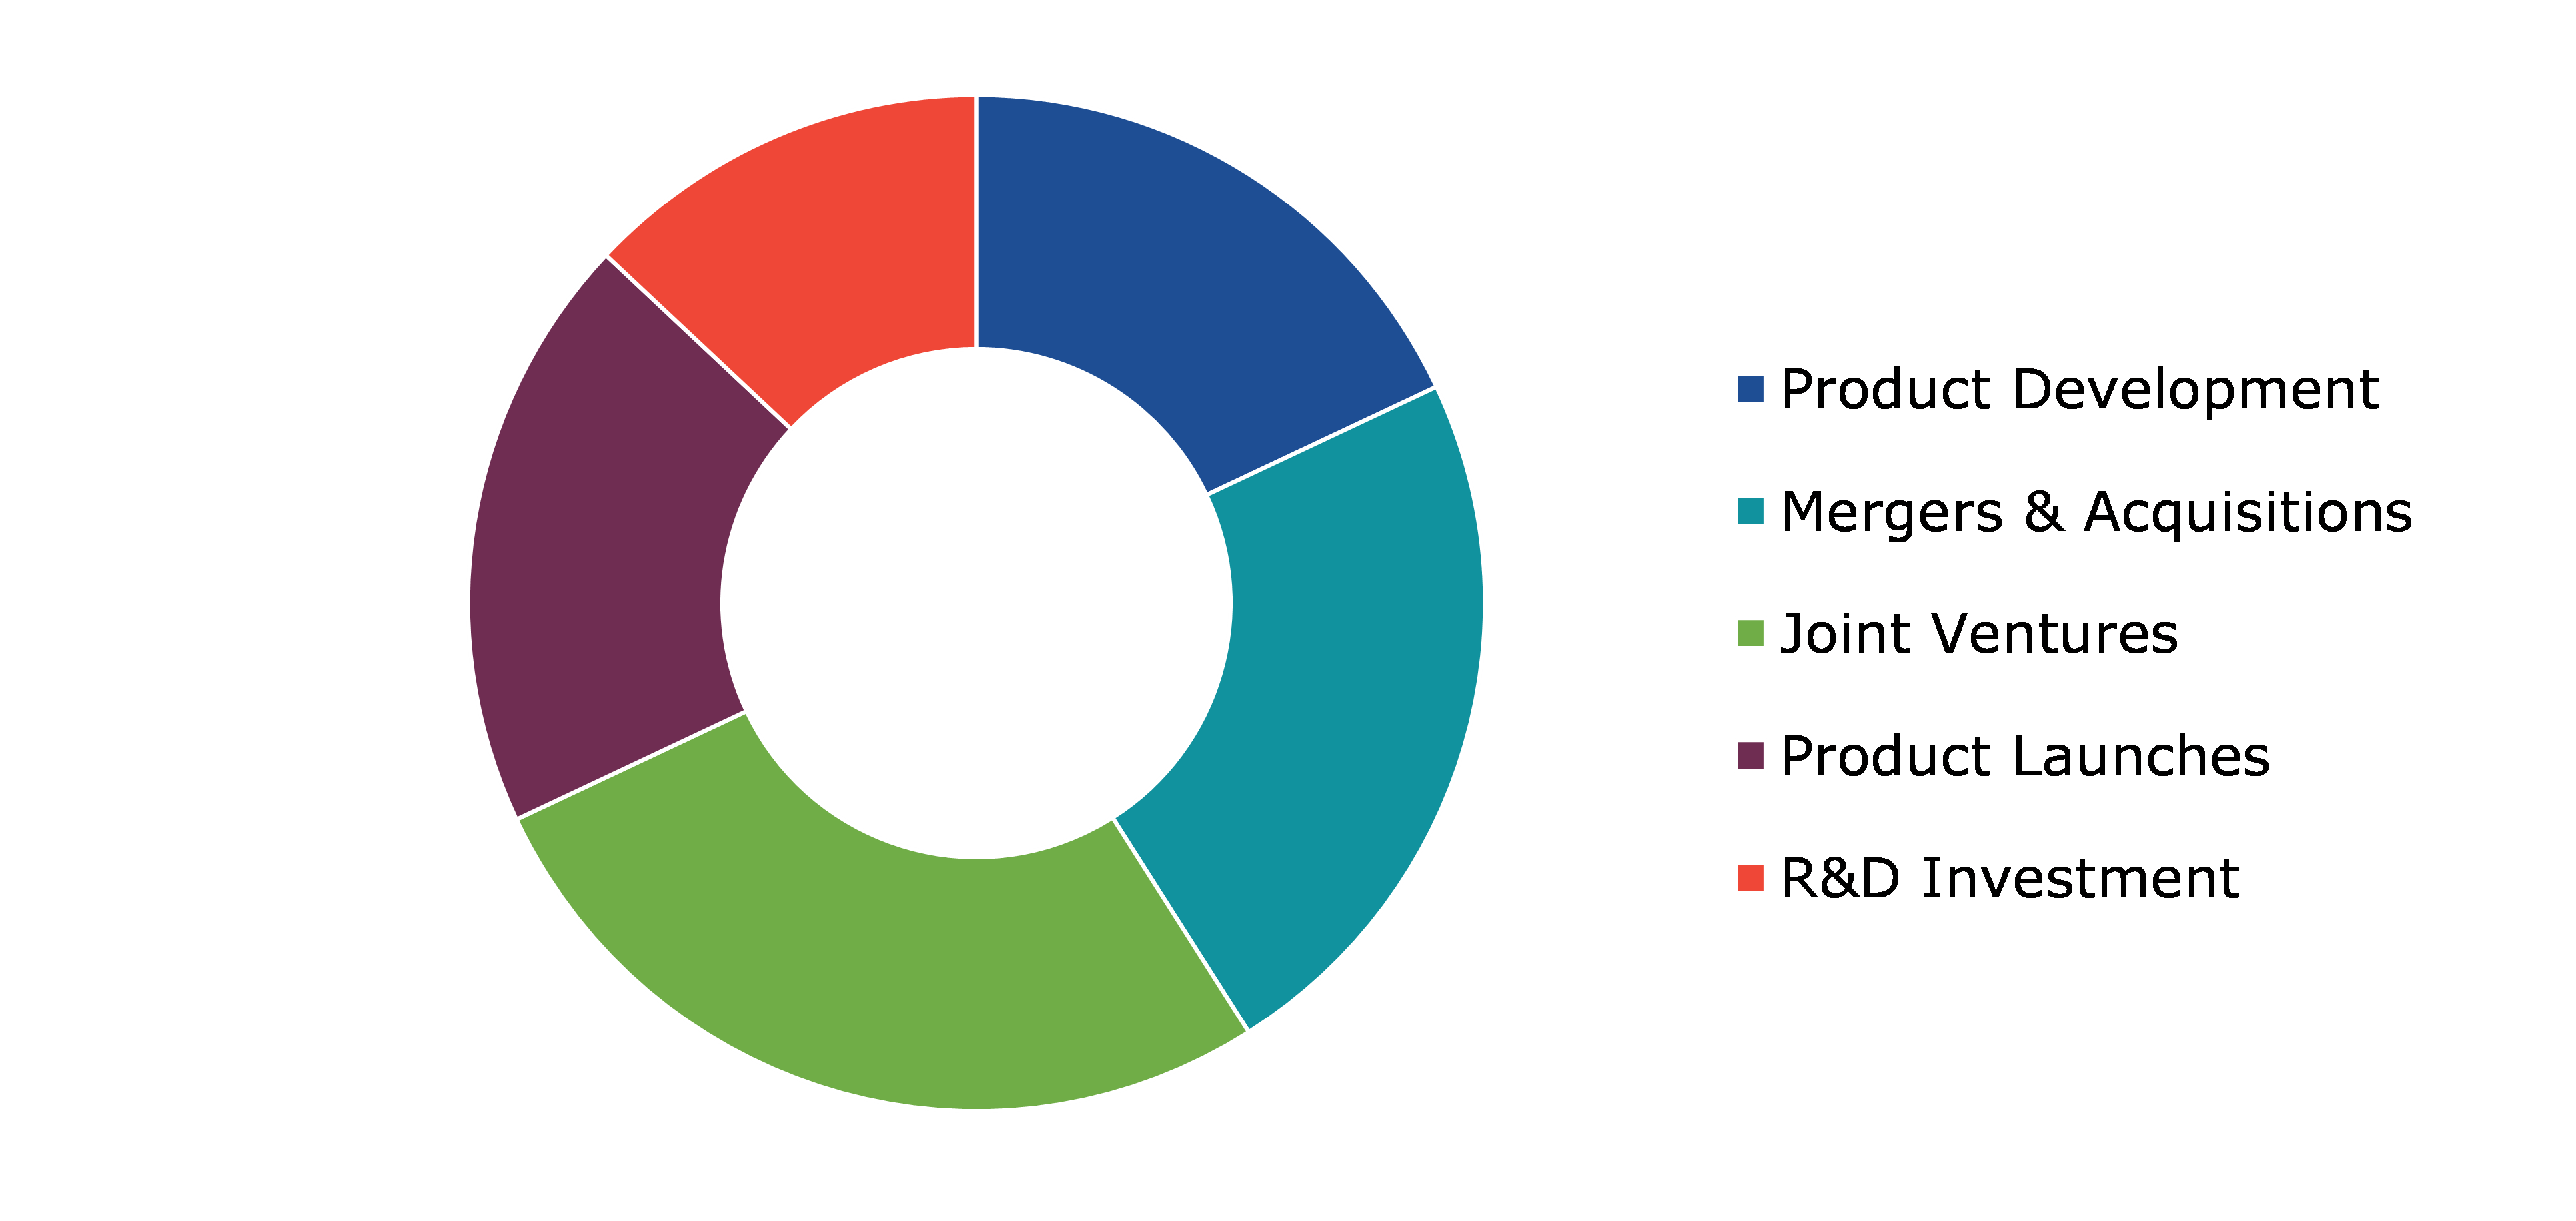
Competitive Scenario in the Global Power Grid Market
Acquisition, new project, and agreement are common strategies followed by major market players. For instance, on December 27, 2023, the Power Grid Corporation of India, the state-owned electricity transmission company acquired two special purpose vehicles (SPV) and commissioned a 500 MW wind power project in Tamil Nadu, India.
Source: Research Dive Analysis
Some of the leading power grid market players are Siemens AG, ABB Ltd, General Electric Company, Schneider Electric SE, State Grid Corporation of China, Eaton Corporation, Mitsubishi Electric Corporation, Toshiba Corporation, National Grid plc, and NextEra Energy, Inc.
| Aspect | Particulars |
| Historical Market Estimations | 2021 |
| Base Year for Market Estimation | 2022 |
| Forecast Timeline for Market Projection | 2023-2032 |
| Geographical Scope | North America, Europe, Asia-Pacific, and LAMEA |
| Segmentation by Component |
|
| Segmentation by Energy source |
|
| Key Companies Profiled |
|
Q1. What is the size of the global power grid market?
A. The size of the global power grid market was over $241.6 billion in 2022 and is projected to reach $413.9 billion by 2032.
Q2. Which are the major companies in the power grid market?
A. Siemens AG, ABB Ltd, General Electric Company, and Schneider Electric SE are some of the key players in the global power grid market.
Q3. Which region, among others, possesses greater investment opportunities in the future?
A. Asia-Pacific possesses great investment opportunities for investors in the future.
Q4. What will be the growth rate of the Asia-Pacific power grid market?
A. The Asia-Pacific power grid market is anticipated to grow at 6.1% CAGR during the forecast period.
Q5. What are the strategies opted by the leading players in this market?
A. Acquisition, new project, and agreement are the key strategies opted by the operating companies in this market.
Q6. Which companies are investing more on R&D practices?
A. State Grid Corporation of China, Eaton Corporation, and Mitsubishi Electric Corporation are the companies investing more on R&D activities for developing new products and technologies.
1. Research Methodology
1.1. Desk Research
1.2. Real time insights and validation
1.3. Forecast model
1.4. Assumptions and forecast parameters
1.5. Market size estimation
1.5.1. Top-down approach
1.5.2. Bottom-up approach
2. Report Scope
2.1. Market definition
2.2. Key objectives of the study
2.3. Market segmentation
3. Executive Summary
4. Market Overview
4.1. Introduction
4.2. Growth impact forces
4.2.1. Drivers
4.2.2. Restraints
4.2.3. Opportunities
4.3. Market value chain analysis
4.3.1. List of raw material suppliers
4.3.2. List of manufacturers
4.3.3. List of distributors
4.4. Innovation & sustainability matrices
4.4.1. Technology matrix
4.4.2. Regulatory matrix
4.5. Porter’s five forces analysis
4.5.1. Bargaining power of suppliers
4.5.2. Bargaining power of consumers
4.5.3. Threat of substitutes
4.5.4. Threat of new entrants
4.5.5. Competitive rivalry intensity
4.6. PESTLE analysis
4.6.1. Political
4.6.2. Economical
4.6.3. Social
4.6.4. Technological
4.6.5. Legal
4.6.6. Environmental
4.7. Impact of COVID-19 on power grid market
4.7.1. Pre-covid market scenario
4.7.2. Post-covid market scenario
5. Power Grid Market Analysis, by Component
5.1. Overview
5.2. Power Generation
5.2.1. Definition, key trends, growth factors, and opportunities
5.2.2. Market size analysis, by region, 2022-2032
5.2.3. Market share analysis, by country, 2022-2032
5.3. Transmission Lines
5.3.1. Definition, key trends, growth factors, and opportunities
5.3.2. Market size analysis, by region, 2022-2032
5.3.3. Market share analysis, by country, 2022-2032
5.4. Distribution Networks
5.4.1. Definition, key trends, growth factors, and opportunities
5.4.2. Market size analysis, by region, 2022-2032
5.4.3. Market share analysis, by country, 2022-2032
5.5. Consumer Use
5.5.1. Definition, key trends, growth factors, and opportunities
5.5.2. Market size analysis, by region, 2022-2032
5.5.3. Market share analysis, by country, 2022-2032
5.6. Research Dive Exclusive Insights
5.6.1. Market attractiveness
5.6.2. Competition heatmap
6. Power Grid Market Analysis, by Energy Source
6.1. Solar
6.1.1. Definition, key trends, growth factors, and opportunities
6.1.2. Market size analysis, by region, 2022-2032
6.1.3. Market share analysis, by country, 2022-2032
6.2. Wind
6.2.1. Definition, key trends, growth factors, and opportunities
6.2.2. Market size analysis, by region, 2022-2032
6.2.3. Market share analysis, by country, 2022-2032
6.3. Natural Gas
6.3.1. Definition, key trends, growth factors, and opportunities
6.3.2. Market size analysis, by region, 2022-2032
6.3.3. Market share analysis, by country, 2022-2032
6.4. Coal
6.4.1. Definition, key trends, growth factors, and opportunities
6.4.2. Market size analysis, by region, 2022-2032
6.4.3. Market share analysis, by country, 2022-2032
6.5. Others
6.5.1. Definition, key trends, growth factors, and opportunities
6.5.2. Market size analysis, by region, 2022-2032
6.5.3. Market share analysis, by country, 2022-2032
6.6. Research Dive Exclusive Insights
6.6.1. Market attractiveness
6.6.2. Competition heatmap
7. Power Grid Market, by Region
7.1. North America
7.1.1. U.S.
7.1.1.1. Market size analysis, by Component, 2022-2032
7.1.1.2. Market size analysis, by Energy Source, 2022-2032
7.1.2. Canada
7.1.2.1. Market size analysis, by Component, 2022-2032
7.1.2.2. Market size analysis, by Energy Source, 2022-2032
7.1.3. Mexico
7.1.3.1. Market size analysis, by Component, 2022-2032
7.1.3.2. Market size analysis, by Energy Source, 2022-2032
7.1.4. Research Dive Exclusive Insights
7.1.4.1. Market attractiveness
7.1.4.2. Competition heatmap
7.2. Europe
7.2.1. Germany
7.2.1.1. Market size analysis, by Component, 2022-2032
7.2.1.2. Market size analysis, by Energy Source, 2022-2032
7.2.2. UK
7.2.2.1. Market size analysis, by Component, 2022-2032
7.2.2.2. Market size analysis, by Energy Source, 2022-2032
7.2.3. France
7.2.3.1. Market size analysis, by Component, 2022-2032
7.2.3.2. Market size analysis, by Energy Source, 2022-2032
7.2.4. Italy
7.2.4.1. Market size analysis, by Component, 2022-2032
7.2.4.2. Market size analysis, by Energy Source, 2022-2032
7.2.5. Spain
7.2.5.1. Market size analysis, by Component, 2022-2032
7.2.5.2. Market size analysis, by Energy Source, 2022-2032
7.2.6. Rest of Europe
7.2.6.1. Market size analysis, by Component, 2022-2032
7.2.6.2. Market size analysis, by Energy Source, 2022-2032
7.2.7. Research Dive Exclusive Insights
7.2.7.1. Market attractiveness
7.2.7.2. Competition heatmap
7.3. Asia-Pacific
7.3.1. China
7.3.1.1. Market size analysis, by Component, 2022-2032
7.3.1.2. Market size analysis, by Energy Source, 2022-2032
7.3.2. Japan
7.3.2.1. Market size analysis, by Component, 2022-2032
7.3.2.2. Market size analysis, by Energy Source, 2022-2032
7.3.3. India
7.3.3.1. Market size analysis, by Component, 2022-2032
7.3.3.2. Market size analysis, by Energy Source, 2022-2032
7.3.4. Australia
7.3.4.1. Market size analysis, by Component, 2022-2032
7.3.4.2. Market size analysis, by Energy Source, 2022-2032
7.3.5. South Korea
7.3.5.1. Market size analysis, by Component, 2022-2032
7.3.5.2. Market size analysis, by Energy Source, 2022-2032
7.3.6. Rest of Asia-Pacific
7.3.6.1. Market size analysis, by Component, 2022-2032
7.3.6.2. Market size analysis, by Energy Source, 2022-2032
7.3.7. Research Dive Exclusive Insights
7.3.7.1. Market attractiveness
7.3.7.2. Competition heatmap
7.4. LAMEA
7.4.1. Brazil
7.4.1.1. Market size analysis, by Component, 2022-2032
7.4.1.2. Market size analysis, by Energy Source, 2022-2032
7.4.2. Saudi Arabia
7.4.2.1. Market size analysis, by Component, 2022-2032
7.4.2.2. Market size analysis, by Energy Source, 2022-2032
7.4.3. UAE
7.4.3.1. Market size analysis, by Component, 2022-2032
7.4.3.2. Market size analysis, by Energy Source, 2022-2032
7.4.4. South Africa
7.4.4.1. Market size analysis, by Component, 2022-2032
7.4.4.2. Market size analysis, by Energy Source, 2022-2032
7.4.5. Rest of LAMEA
7.4.5.1. Market size analysis, by Component, 2022-2032
7.4.5.2. Market size analysis, by Energy Source, 2022-2032
7.4.6. Research Dive Exclusive Insights
7.4.6.1. Market attractiveness
7.4.6.2. Competition heatmap
8. Competitive Landscape
8.1. Top winning strategies, 2022
8.1.1. By strategy
8.1.2. By year
8.2. Strategic overview
8.3. Market share analysis, 2022
9. Company Profiles
9.1. Siemens AG
9.1.1. Overview
9.1.2. Business segments
9.1.3. Product portfolio
9.1.4. Financial performance
9.1.5. Recent developments
9.1.6. SWOT analysis
9.2. ABB Ltd
9.2.1. Overview
9.2.2. Business segments
9.2.3. Product portfolio
9.2.4. Financial performance
9.2.5. Recent developments
9.2.6. SWOT analysis
9.3. General Electric Company
9.3.1. Overview
9.3.2. Business segments
9.3.3. Product portfolio
9.3.4. Financial performance
9.3.5. Recent developments
9.3.6. SWOT analysis
9.4. Schneider Electric SE
9.4.1. Overview
9.4.2. Business segments
9.4.3. Product portfolio
9.4.4. Financial performance
9.4.5. Recent developments
9.4.6. SWOT analysis
9.5. State Grid Corporation of China
9.5.1. Overview
9.5.2. Business segments
9.5.3. Product portfolio
9.5.4. Financial performance
9.5.5. Recent developments
9.5.6. SWOT analysis
9.6. Eaton Corporation
9.6.1. Overview
9.6.2. Business segments
9.6.3. Product portfolio
9.6.4. Financial performance
9.6.5. Recent developments
9.6.6. SWOT analysis
9.7. Mitsubishi Electric Corporation
9.7.1. Overview
9.7.2. Business segments
9.7.3. Product portfolio
9.7.4. Financial performance
9.7.5. Recent developments
9.7.6. SWOT analysis
9.8. Toshiba Corporation
9.8.1. Overview
9.8.2. Business segments
9.8.3. Product portfolio
9.8.4. Financial performance
9.8.5. Recent developments
9.8.6. SWOT analysis
9.9. National Grid plc
9.9.1. Overview
9.9.2. Business segments
9.9.3. Product portfolio
9.9.4. Financial performance
9.9.5. Recent developments
9.9.6. SWOT analysis
9.10. NextEra Energy, Inc.
9.10.1. Overview
9.10.2. Business segments
9.10.3. Product portfolio
9.10.4. Financial performance
9.10.5. Recent developments
9.10.6. SWOT analysis
Personalize this research
- Triangulate with your own data
- Request your format and definition
- Get a deeper dive on a specific application, geography, customer or competitor
- + 1-888-961-4454 Toll - Free
- support@researchdive.com
