Solar Tree Market Report
RA09188
Solar Tree Market by Connectivity (Off-Grid and On-Grid), Component (Battery, Solar PV Modules, Cables & Connectors, and Others), Application (Residential, Commercial & Industrial, and Utilities), and Region (North America, Europe, Asia-Pacific, and LAMEA): Global Opportunity Analysis and Industry Forecast, 2023-2032
Solar Tree Overview
A solar tree is a construction that resembles a tree, with solar panels replacing the leaves. Sunlight is captured and converted into usable electricity by these panels. Solar trees are an appealing alternative to standard solar panel installations since they mix in with both urban and natural settings while producing sustainable energy. These attractive structures typically consist of a robust steel, plastic, or stone foundation that stretches up and out into "branches" on which solar panels are affixed. Beyond this basic framework, there is a considerable deal of variation in the design of solar tree units, representing unique solutions to specific climates, and local energy needs. The photovoltaic "leaves" of the solar tree capture sunlight and transform it into power, which is then carried down through the structure's trunk-like central pillar to an internal battery. Many versions include rotating panels that can move throughout the day to gather the most sunlight.
Global Solar Tree Market Analysis
The global solar tree market size was $247,414.30 thousand in 2022 and is predicted to grow with a CAGR of 5.7%, by generating a revenue of $425,191.80 thousand by 2032.
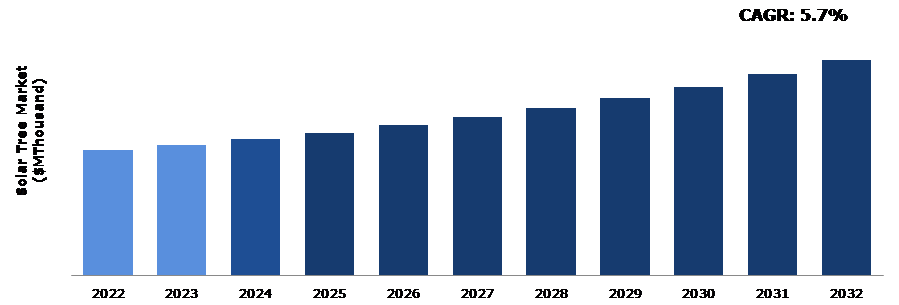
Source: Research Dive Analysis
COVID-19 Impact on Global Solar Tree Market
The COVID-19 pandemic had a negative impact on the solar industry. The global pandemic led to disruptions in supply chains, affecting the availability of raw materials and components required for solar panel manufacturing. Solar tree manufacturers faced challenges in sourcing these materials, impacting their production capabilities and overall market supply. Moreover, economic uncertainties and lockdown measures imposed by various countries resulted in reduced demand for solar panels, including solar tree. Solar tree installation projects were delayed or canceled, which affected the market growth.
As the world faced unprecedented challenges during the early stages of the COVID-19 pandemic, the solar tree market experienced a temporary setback, but it also showcased its resilience and capacity for growth in the face of global crises.
Increasing Demand for Renewable Energy and Rising Environmental Concerns to Drive Market Growth
Globally, there is a surging demand for clean and renewable energy sources to mitigate carbon emissions and combat climate change. Solar trees emerge as an innovative solution to generate electricity from the sun, contributing to a cleaner and more sustainable global energy mix. The urgent need to curtail carbon emissions and address climate change acts as a primary driver. Solar trees offer a green and carbon-free energy source, reducing reliance on fossil fuels and mitigating greenhouse gas emissions. Governments of various countries have implemented policies, incentives, and subsidies to encourage the adoption of renewable energy, including solar power generation. These initiatives often involve tax credits, feed-in tariffs, and grants to facilitate the installation of solar tree systems. The deployment of solar trees enhances energy security by diversifying the global energy mix, reducing dependence on imported fossil fuels and enabling energy independence. Furthermore, solar trees are renowned for their aesthetic appeal and space-efficient design. Their installation in urban and residential areas does not consume significant ground space, making them an attractive option for locations with limited real estate. Solar trees contribute to distributed energy generation, wherein power is produced closer to the point of consumption. This approach minimizes transmission losses and encourages the resilience of the global energy grid. Many businesses, universities, and institutions worldwide are aligning with sustainability goals and incorporating solar tree systems as part of their corporate social responsibility initiatives, thereby propelling market growth.
High Upfront Cost of Purchasing and Installing Solar Tree Systems to Restrain the Market Growth
Solar tree installations can be expensive due to the cost of materials, labor, and other associated expenses. High upfront costs can deter potential customers, especially in residential applications. Solar tree systems involve various components, including solar panels, support structures, wiring, inverters, and sometimes energy storage solutions. The cost of purchasing these components and installing them can be substantial. This cost can deter residential and commercial customers from adopting solar tree systems, especially if they have limited capital or tight budgets. Moreover, while solar tree systems can provide long-term cost savings through reduced electricity bills and potential incentives, the ROI may take several years to realize. Some potential customers may be discouraged by the length of time it takes to recoup their initial investment, leading to slower adoption rates. Financing options, such as solar loans and leases, can help mitigate the upfront cost burden. These options allow customers to pay for their solar tree systems over time, making them more accessible. Governments in North America and Europe have introduced various financial incentives and subsidies to encourage solar adoption. Obtaining the necessary permits and complying with local regulations can be time-consuming and costly. This includes zoning permits, electrical permits, and environmental impact assessments.
Emerging Economies with Increasing Energy Demands Present Opportunities in the Market
Emerging economies across the globe are witnessing a consistent surge in energy demand, propelled by factors such as population growth, industrialization, and urbanization. Solar trees emerge as a viable solution to address the escalating need for clean and sustainable energy. Many countries worldwide, spanning Asia-Pacific, North America, Europe, and beyond, are incentivizing and subsidizing renewable energy initiatives, particularly solar installations. These incentives play a pivotal role in significantly mitigating the implementation costs associated with solar tree projects, rendering them more appealing to potential investors on a global scale. Furthermore, there is a heightened awareness surrounding environmental concerns and the imperative to curtail carbon emissions. Solar trees, serving as a clean energy source, align seamlessly with the sustainability objectives of governments and businesses alike, presenting an attractive option for green energy generation. Ongoing advancements in solar panel technology, energy storage solutions, and smart grid integration have collectively enhanced the efficiency and cost-effectiveness of solar trees. This surge in technological innovation propels the adoption of solar tree projects across diverse applications, spanning urban areas to industrial zones. In densely populated urban regions globally, conventional ground-mounted solar installations may encounter feasibility challenges due to limited space. Solar trees offer a practical solution, enabling the harnessing of solar energy in such areas, and their appeal is not limited to specific geographical regions. This can make solar tree more competitive with other solar technologies and further drive excellent opportunities for market growth.
Global Solar Tree Market Share, by Connectivity, 2022
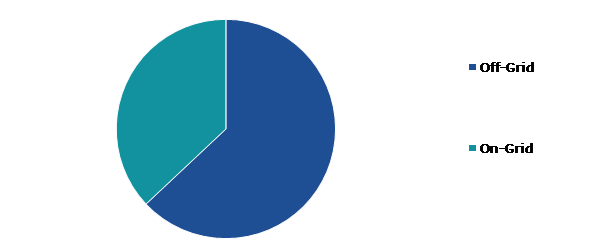
Source: Research Dive Analysis
The on-grid sub-segment accounted for the highest market share in 2022. On-grid solar trees are connected to the local electrical grid. They generate electricity from the sun and store any excess power produced back into the grid. When the solar trees produce more electricity than immediately needed, other consumers can use the surplus, and in some cases, the system owner may receive credits or compensation from the utility company. Grid-tied solar trees are a common choice for residential and commercial applications, as they provide a reliable source of clean energy while maintaining a connection to the grid for continuous power supply, especially when the sun is not shining.
Global Solar Tree Market Share, by Component, 2022
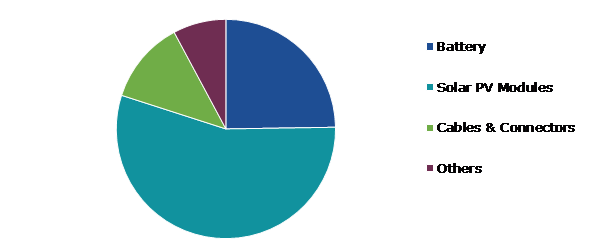
Source: Research Dive Analysis
The solar PV modules sub-segment accounted for the highest market share in 2022. Solar modules play a crucial role in the functioning of solar trees by transforming solar energy into electrical current. These modules incorporate photovoltaic (PV) cells, which are cutting-edge technologies designed to harness solar power through the photovoltaic effect. PV cells, typically composed of semiconductor materials like crystalline silicon, are the heart of the solar module. They work by converting the incoming sunlight into electrical energy. The electricity generated in this process is then harnessed to illuminate both residential and commercial establishments, showcasing the indispensable role of solar modules in providing sustainable and eco-friendly lighting solutions.
Global Solar Tree Market Share, by Application, 2022
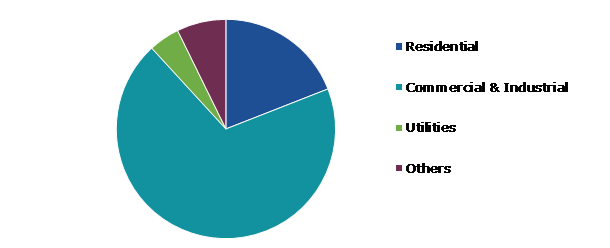
Source: Research Dive Analysis
The commercial & industrial sub-segment accounted for the highest market share in 2022. Businesses and industries have increasingly embraced solar tree technology as a sustainable and cost-effective means of meeting their energy needs. This adoption is driven by the desire to reduce operational costs and environmental impact. Solar trees have not only found a niche in landscaping but have also demonstrated their ability to complement other clean energy technologies. Solar trees with expansive surface areas have found utility in providing shade and shelter in carports, adding an extra layer of functionality to their green energy production. Furthermore, the synergy between solar trees and electric vehicle (EV) charging stations is a promising development. By integrating EV charging infrastructure with solar tree installations, businesses and institutions can promote eco-friendly transportation while harnessing the power of the sun to meet their energy demands. This innovative convergence of technologies features the adaptability and advanced nature of solar tree solutions in contemporary energy landscapes.
Global Solar Tree Market Size & Forecast, by Region, 2022-2032 ($Million)
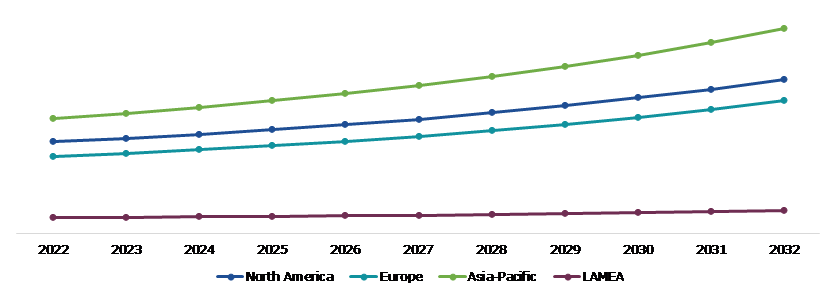
Source: Research Dive Analysis
The Asia-Pacific solar tree market generated the highest revenue in 2022. Asia-Pacific is experiencing a substantial surge in the demand for renewable energy sources, propelled by the necessary to decrease carbon emissions and reduce reliance on fossil fuels. This momentum has led governments and businesses alike to actively champion solar energy, fostering a conducive market environment for solar trees. Furthermore, numerous countries in the region have introduced supportive policies and incentives aimed at incentivizing the widespread adoption of solar energy. These policies cover feed-in tariffs, tax credits, and subsidies specifically tailored for solar installations. Such measures enhance the appeal of solar trees for both consumers and businesses. Notably, the manufacturing cost of solar trees has witnessed a noteworthy decline. This reduction in cost is attributed to advancements in production technologies, economies of scale, and intensified competition within the solar industry.
Competitive Scenario in the Global Solar Tree Market
Investment and agreement are common strategies followed by major market players. For instance, in April 2023, the Delhi Municipal Corporation made a noteworthy announcement regarding the installation of solar trees in Sheikh Sarai, South Delhi, as a component of an INR 62 lakh project. This initiative not only aims to enhance the aesthetic appeal of the area but also serves the dual purpose of generating clean energy to power street lights. Each branch of the solar tree will be constructed using 100-watt solar photovoltaic modules, yielding a 12-volt output.
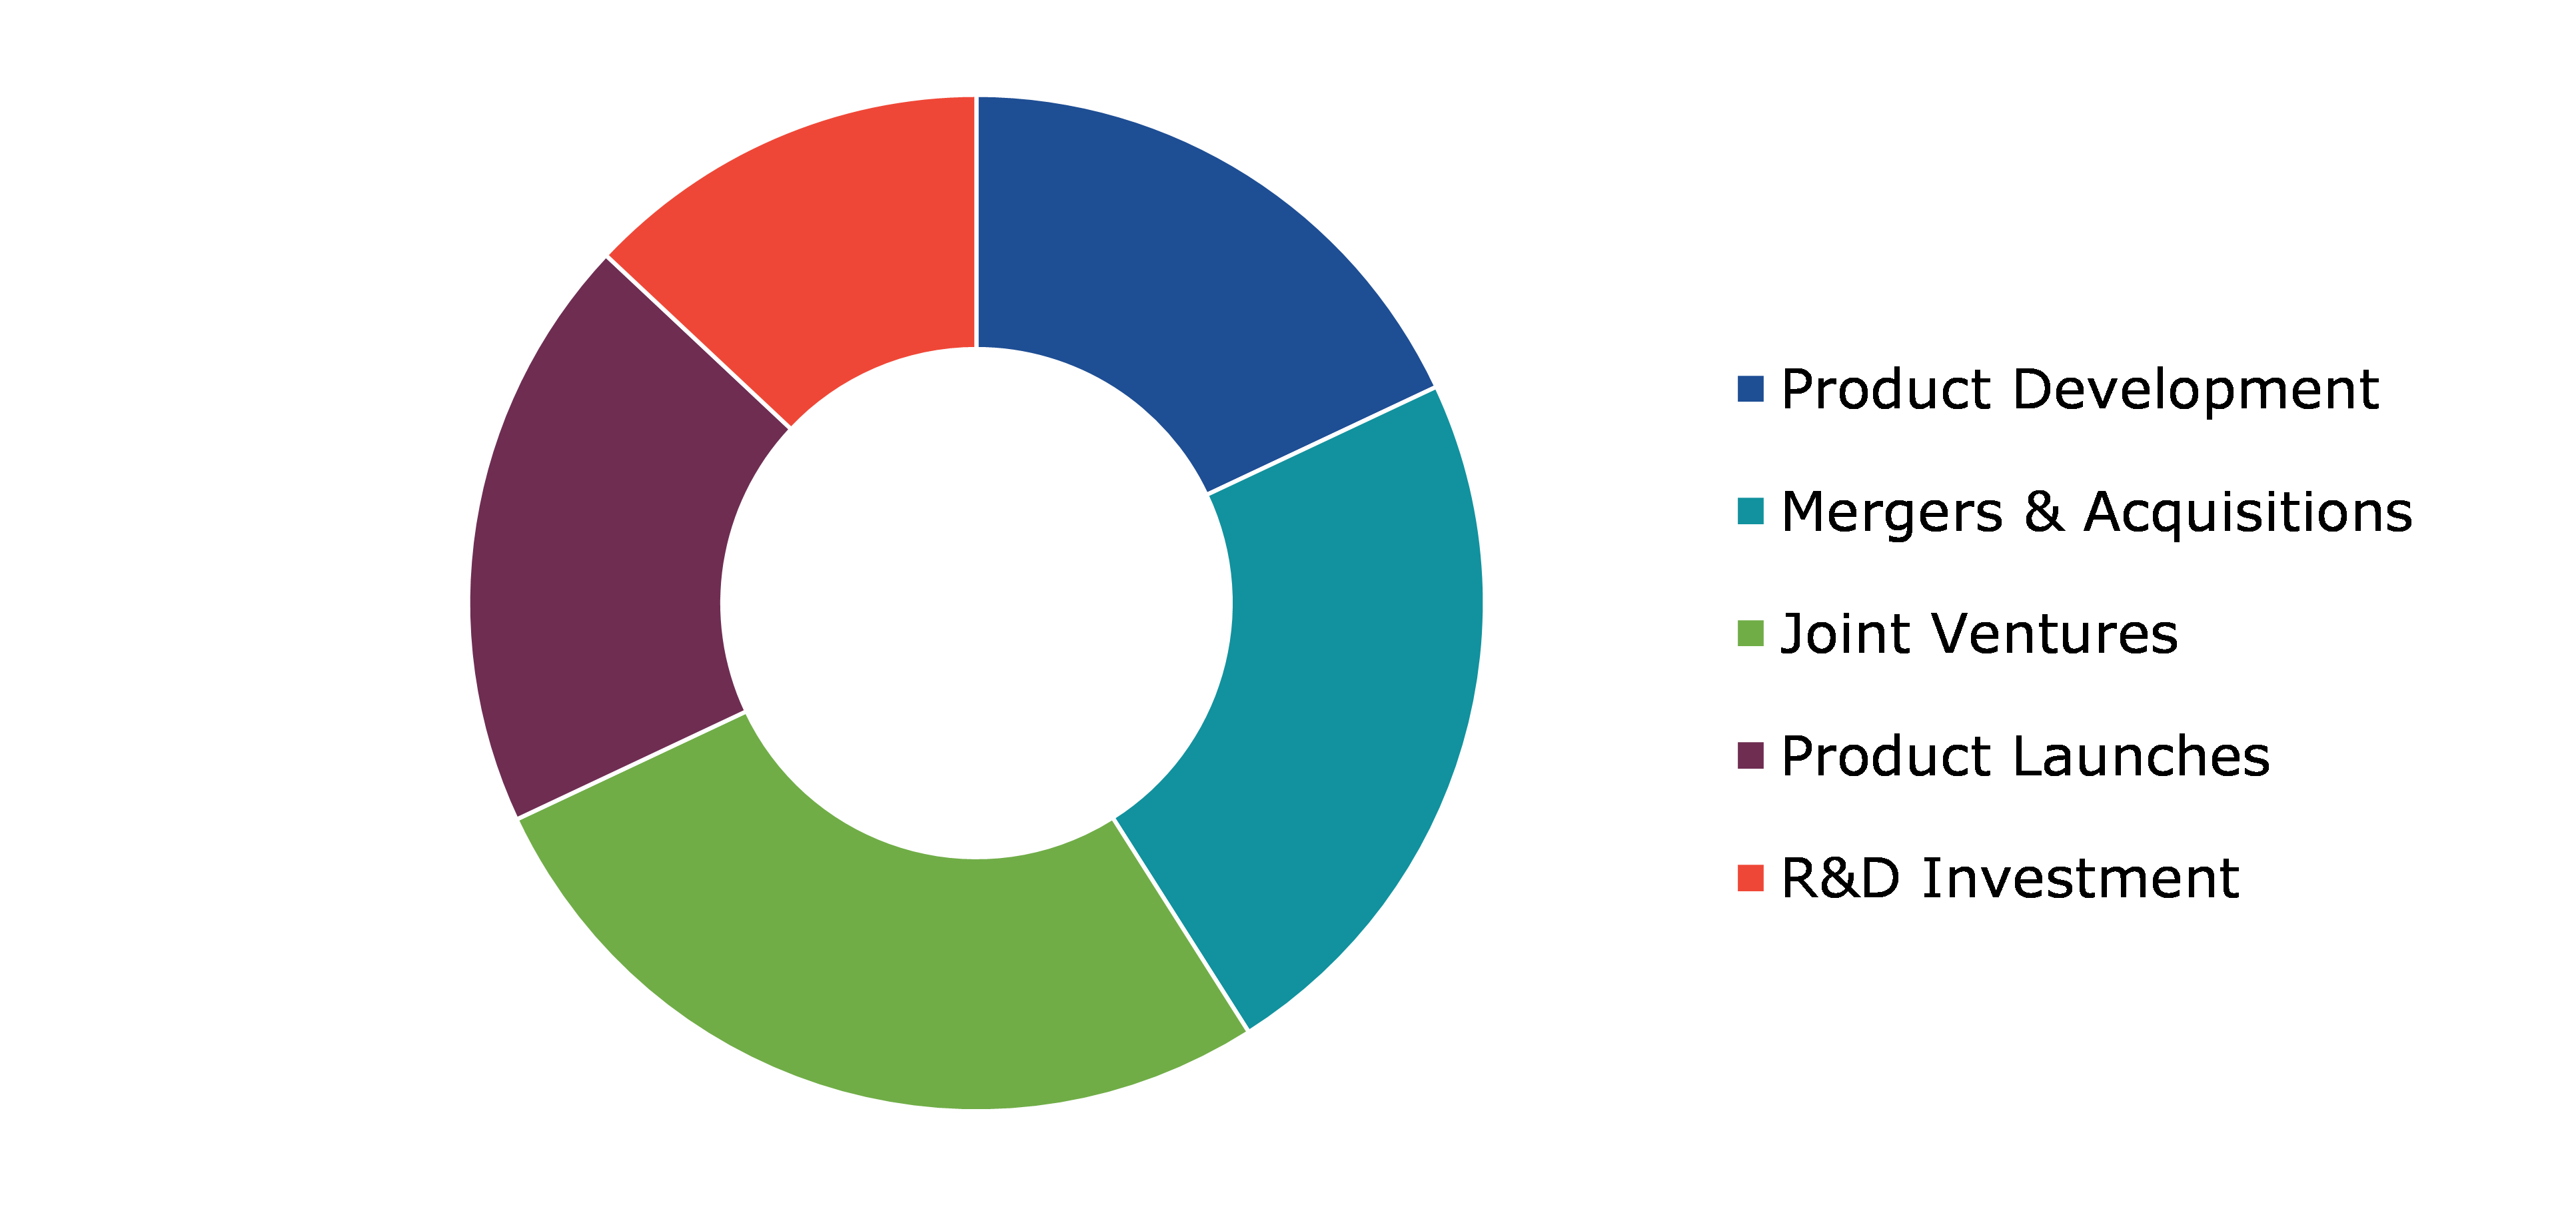
Source: Research Dive Analysis
Some of the leading Solar Tree market players are Beam Global, Smartflower, SolarBotanic Trees Ltd, Solvis, Solar Forma, Spotlight Solar, Power Tree, IYSERT ENERGY, NESSA, and ARTEMIDE S.P.A.
| Aspect | Particulars |
| Historical Market Estimations | 2020-2021 |
| Base Year for Market Estimation | 2022 |
| Forecast Timeline for Market Projection | 2023-2032 |
| Geographical Scope | North America, Europe, Asia-Pacific, and LAMEA |
| Segmentation by Connectivity |
|
| Segmentation by Component |
|
|
Segmentation by Application
|
|
| Key Companies Profiled |
|
Q1. What is the size of the global solar tree market?
A. The size of the global solar tree market was over $247,414.30 thousand in 2022 and is projected to reach $425,191.80 thousand by 2032.
Q2. Which are the major companies in the solar tree market?
A. Beam Global, Smartflower, SolarBotanic Trees Ltd are some of the key players in the global solar tree market.
Q3. Which region, among others, possesses greater investment opportunities in the future?
A. Asia-Pacific possesses great investment opportunities for investors in the future.
Q4. What will be the growth rate of the Asia-Pacific solar tree market?
A. Asia-Pacific solar tree market is anticipated to grow at 6.1% CAGR during the forecast period.
Q5. What are the strategies opted by the leading players in this market?
A. Agreement and investment are the two key strategies opted by the operating companies in this market.
Q6. Which companies are investing more on R&D practices?
A. Solar Forma, Spotlight Solar, and Power Tree are the companies investing more on R&D activities for developing new products and technologies.
1. Research Methodology
1.1. Desk Research
1.2. Real time insights and validation
1.3. Forecast model
1.4. Assumptions and forecast parameters
1.5. Market size estimation
1.5.1. Top-down approach
1.5.2. Bottom-up approach
2. Report Scope
2.1. Market definition
2.2. Key objectives of the study
2.3. Report overview
2.4. Market segmentation
2.5. Overview of the impact of COVID-19 on global Solar Tree market
3. Executive Summary
4. Market Overview
4.1. Introduction
4.2. Growth impact forces
4.2.1. Drivers
4.2.2. Restraints
4.2.3. Opportunities
4.3. Market value chain analysis
4.3.1. List of raw material suppliers
4.3.2. List of manufacturers
4.3.3. List of distributors
4.4. Innovation & sustainability matrices
4.4.1. Technology matrix
4.4.2. Regulatory matrix
4.5. Porter’s five forces analysis
4.5.1. Bargaining power of suppliers
4.5.2. Bargaining power of consumers
4.5.3. Threat of substitutes
4.5.4. Threat of new entrants
4.5.5. Competitive rivalry intensity
4.6. PESTLE analysis
4.6.1. Political
4.6.2. Economical
4.6.3. Social
4.6.4. Technological
4.6.5. Legal
4.6.6. Environmental
4.7. Impact of COVID-19 on Solar Tree market
4.7.1. Pre-covid market scenario
4.7.2. Post-covid market scenario
5. Solar Tree Market Analysis, by Connectivity
5.1. Overview
5.2. Off-Grid
5.2.1. Definition, key trends, growth factors, and opportunities
5.2.2. Market size analysis, by region, 2022-2032
5.2.3. Market share analysis, by country, 2022-2032
5.3. On-Grid
5.3.1. Definition, key trends, growth factors, and opportunities
5.3.2. Market size analysis, by region, 2022-2032
5.3.3. Market share analysis, by country, 2022-2032
5.4. Research Dive Exclusive Insights
5.4.1. Market attractiveness
5.4.2. Competition heatmap
6. Solar Tree Market Analysis, by Component
6.1. Battery
6.1.1. Definition, key trends, growth factors, and opportunities
6.1.2. Market size analysis, by region, 2022-2032
6.1.3. Market share analysis, by country, 2022-2032
6.2. Solar PV Modules
6.2.1. Definition, key trends, growth factors, and opportunities
6.2.2. Market size analysis, by region, 2022-2032
6.2.3. Market share analysis, by country, 2022-2032
6.3. Cables & Connectors
6.3.1. Definition, key trends, growth factors, and opportunities
6.3.2. Market size analysis, by region, 2022-2032
6.3.3. Market share analysis, by country, 2022-2032
6.4. Others
6.4.1. Definition, key trends, growth factors, and opportunities
6.4.2. Market size analysis, by region, 2022-2032
6.4.3. Market share analysis, by country, 2022-2032
6.5. Research Dive Exclusive Insights
6.5.1. Market attractiveness
6.5.2. Competition heatmap
7. Solar Tree Market Analysis, by Application
7.1. Residential
7.1.1. Definition, key trends, growth factors, and opportunities
7.1.2. Market size analysis, by region, 2022-2032
7.1.3. Market share analysis, by country, 2022-2032
7.2. Commercial & Industrial
7.2.1. Definition, key trends, growth factors, and opportunities
7.2.2. Market size analysis, by region, 2022-2032
7.2.3. Market share analysis, by country, 2022-2032
7.3. Utilities
7.3.1. Definition, key trends, growth factors, and opportunities
7.3.2. Market size analysis, by region, 2022-2032
7.3.3. Market share analysis, by country, 2022-2032
7.4. Research Dive Exclusive Insights
7.4.1. Market attractiveness
7.4.2. Competition heatmap
8. Solar Tree Market, by Region
8.1. North America
8.1.1. U.S.
8.1.1.1. Market size analysis, by Connectivity, 2022-2032
8.1.1.2. Market size analysis, by Application, 2022-2032
8.1.1.3. Market size analysis, by Component, 2022-2032
8.1.2. Canada
8.1.2.1. Market size analysis, by Connectivity, 2022-2032
8.1.2.2. Market size analysis, by Application, 2022-2032
8.1.2.3. Market size analysis, by Component, 2022-2032
8.1.3. Mexico
8.1.3.1. Market size analysis, by Connectivity, 2022-2032
8.1.3.2. Market size analysis, by Application, 2022-2032
8.1.3.3. Market size analysis, by Component, 2022-2032
8.1.4. Research Dive Exclusive Insights
8.1.4.1. Market attractiveness
8.1.4.2. Competition heatmap
8.2. Europe
8.2.1. Germany
8.2.1.1. Market size analysis, by Connectivity, 2022-2032
8.2.1.2. Market size analysis, by Application, 2022-2032
8.2.1.3. Market size analysis, by Component, 2022-2032
8.2.2. UK
8.2.2.1. Market size analysis, by Connectivity, 2022-2032
8.2.2.2. Market size analysis, by Application, 2022-2032
8.2.2.3. Market size analysis, by Component, 2022-2032
8.2.3. France
8.2.3.1. Market size analysis, by Connectivity, 2022-2032
8.2.3.2. Market size analysis, by Application, 2022-2032
8.2.3.3. Market size analysis, by Component, 2022-2032
8.2.4. Spain
8.2.4.1. Market size analysis, by Connectivity, 2022-2032
8.2.4.2. Market size analysis, by Application, 2022-2032
8.2.4.3. Market size analysis, by Component, 2022-2032
8.2.5. Italy
8.2.5.1. Market size analysis, by Connectivity, 2022-2032
8.2.5.2. Market size analysis, by Application, 2022-2032
8.2.5.3. Market size analysis, by Component, 2022-2032
8.2.6. Rest of Europe
8.2.6.1. Market size analysis, by Connectivity, 2022-2032
8.2.6.2. Market size analysis, by Application, 2022-2032
8.2.6.3. Market size analysis, by Component, 2022-2032
8.2.7. Research Dive Exclusive Insights
8.2.7.1. Market attractiveness
8.2.7.2. Competition heatmap
8.3. Asia-Pacific
8.3.1. China
8.3.1.1. Market size analysis, by Connectivity, 2022-2032
8.3.1.2. Market size analysis, by Application, 2022-2032
8.3.1.3. Market size analysis, by Component, 2022-2032
8.3.2. Japan
8.3.2.1. Market size analysis, by Connectivity, 2022-2032
8.3.2.2. Market size analysis, by Application, 2022-2032
8.3.2.3. Market size analysis, by Component, 2022-2032
8.3.3. India
8.3.3.1. Market size analysis, by Connectivity, 2022-2032
8.3.3.2. Market size analysis, by Application, 2022-2032
8.3.3.3. Market size analysis, by Component, 2022-2032
8.3.4. Australia
8.3.4.1. Market size analysis, by Connectivity, 2022-2032
8.3.4.2. Market size analysis, by Application, 2022-2032
8.3.4.3. Market size analysis, by Component, 2022-2032
8.3.5. South Korea
8.3.5.1. Market size analysis, by Connectivity, 2022-2032
8.3.5.2. Market size analysis, by Application, 2022-2032
8.3.5.3. Market size analysis, by Component, 2022-2032
8.3.6. Rest of Asia-Pacific
8.3.6.1. Market size analysis, by Connectivity, 2022-2032
8.3.6.2. Market size analysis, by Application, 2022-2032
8.3.6.3. Market size analysis, by Component, 2022-2032
8.3.7. Research Dive Exclusive Insights
8.3.7.1. Market attractiveness
8.3.7.2. Competition heatmap
8.4. LAMEA
8.4.1. Brazil
8.4.1.1. Market size analysis, by Connectivity, 2022-2032
8.4.1.2. Market size analysis, by Application, 2022-2032
8.4.1.3. Market size analysis, by Component, 2022-2032
8.4.2. Saudi Arabia
8.4.2.1. Market size analysis, by Connectivity, 2022-2032
8.4.2.2. Market size analysis, by Application, 2022-2032
8.4.2.3. Market size analysis, by Component, 2022-2032
8.4.3. UAE
8.4.3.1. Market size analysis, by Connectivity, 2022-2032
8.4.3.2. Market size analysis, by Application, 2022-2032
8.4.3.3. Market size analysis, by Component, 2022-2032
8.4.4. South Africa
8.4.4.1. Market size analysis, by Connectivity, 2022-2032
8.4.4.2. Market size analysis, by Application, 2022-2032
8.4.4.3. Market size analysis, by Component, 2022-2032
8.4.5. Rest of LAMEA
8.4.5.1. Market size analysis, by Connectivity, 2022-2032
8.4.5.2. Market size analysis, by Application, 2022-2032
8.4.5.3. Market size analysis, by Component, 2022-2032
8.4.6. Research Dive Exclusive Insights
8.4.6.1. Market attractiveness
8.4.6.2. Competition heatmap
9. Competitive Landscape
9.1. Top winning strategies, 2022
9.1.1. By strategy
9.1.2. By year
9.2. Strategic overview
9.3. Market share analysis, 2022
10. Company Profiles
10.1. Beam Global
10.1.1. Overview
10.1.2. Business segments
10.1.3. Product portfolio
10.1.4. Financial performance
10.1.5. Recent developments
10.1.6. SWOT analysis
10.2. Smartflower
10.2.1. Overview
10.2.2. Business segments
10.2.3. Product portfolio
10.2.4. Financial performance
10.2.5. Recent developments
10.2.6. SWOT analysis
10.3. SolarBotanic Trees Ltd
10.3.1. Overview
10.3.2. Business segments
10.3.3. Product portfolio
10.3.4. Financial performance
10.3.5. Recent developments
10.3.6. SWOT analysis
10.4. Solvis
10.4.1. Overview
10.4.2. Business segments
10.4.3. Product portfolio
10.4.4. Financial performance
10.4.5. Recent developments
10.4.6. SWOT analysis
10.5. Solar Forma
10.5.1. Overview
10.5.2. Business segments
10.5.3. Product portfolio
10.5.4. Financial performance
10.5.5. Recent developments
10.5.6. SWOT analysis
10.6. Spotlight Solar
10.6.1. Overview
10.6.2. Business segments
10.6.3. Product portfolio
10.6.4. Financial performance
10.6.5. Recent developments
10.6.6. SWOT analysis
10.7. Power Tree
10.7.1. Overview
10.7.2. Business segments
10.7.3. Product portfolio
10.7.4. Financial performance
10.7.5. Recent developments
10.7.6. SWOT analysis
10.8. IYSERT ENERGY
10.8.1. Overview
10.8.2. Business segments
10.8.3. Product portfolio
10.8.4. Financial performance
10.8.5. Recent developments
10.8.6. SWOT analysis
10.9. NESSA
10.9.1. Overview
10.9.2. Business segments
10.9.3. Product portfolio
10.9.4. Financial performance
10.9.5. Recent developments
10.9.6. SWOT analysis
10.10. ARTEMIDE S.P.A.
10.10.1. Overview
10.10.2. Business segments
10.10.3. Product portfolio
10.10.4. Financial performance
10.10.5. Recent developments
10.10.6. SWOT analysis
Personalize this research
- Triangulate with your own data
- Request your format and definition
- Get a deeper dive on a specific application, geography, customer or competitor
- + 1-888-961-4454 Toll - Free
- support@researchdive.com
