Water Quality Instrument Market Report
RA09187
Water Quality Instrument Market by Product Type (Portable and Bench-top), Test Type (Turbidity, pH, Dissolved Oxygen, Conductivity, TOC, and Others), End User (Water Treatment Plants, Laboratories, Industrial, Aquaculture, and Others), and Region (North America, Europe, Asia-Pacific, and LAMEA): Global Opportunity Analysis and Industry Forecast, 2023-2032
Water Quality Instrument Overview
A water quality instrument system is a fully developed device that analyzes water quality with the help of Internet of Things (IoT). It is recognized as a reliable analytic system for improving water quality. Regular water testing is critical for protecting water bodies from harmful chemicals. Water quality instrument is useful for keeping track of factors such as temperature, nitrates, phosphates, macroinvertebrates, pH, oxygen, and others.
A water quality instrument is designed to assess and monitor the various physical, chemical, and biological characteristics of water. This instrument measures parameters such as pH, temperature, dissolved oxygen, turbidity, and the presence of contaminants like bacteria or pollutants. They play a crucial role in ensuring the safety and suitability of water for various purposes, including drinking, environmental conservation, and industrial processes. Water quality instrument is an indispensable tool in assessing and maintaining the overall health and safety of aquatic ecosystems and human populations that rely on clean and safe water sources.
Global Water Quality Instrument Market Analysis
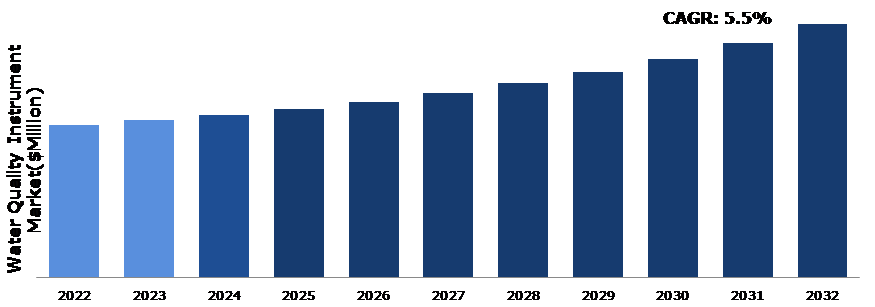
The global water quality instrument market size was $4,431.6 in 2022 and is predicted to grow with a CAGR of 5.5%, by generating a revenue of $7,383.8 million by 2032.
Source: Research Dive Analysis
Covid-19 Impacton the Water Quality Instrument Market
The COVID-19 pandemic had a significant impact on the water quality instrument market size. The increased emphasis on public health and safety has driven greater demand for these instruments to monitor water quality in various settings, including healthcare facilities, municipalities, and industrial sectors. In addition, disruptions in global supply chains have caused fluctuations in the availability and pricing of these essential tools, highlighting their importance in the pandemic response and recovery efforts. The pandemic highlighted the critical need for clean and safe water, leading to an increase in demand for advanced instrument and testing equipment. As governments and industries prioritize water quality and safety, the market has seen notable growth, with a surge in innovations and investments in these instruments to ensure the resilience of water supply systems in the face of future challenges.
Rise in Demand for Clean and Safe Water for Consumption and Industrial Use to Drive the Market Growth
The rise in global population and urbanization has led to an increase in demand for water resources, and water quality is becoming a key problem. Contaminants such as bacteria, viruses, chemicals, and heavy metals can cause health problems when consumed or used in industrial operations, leading to an increase in need for water quality monitors. The rise in demand for clean and safe water for both consumption and industrial use is a key factor driving the growth of the water quality instrument market growth. With growing awareness regarding the importance of water quality in safeguarding public health and sustaining industrial processes, there is an increase in need for accurate instrument and testing. This rise in demand has led to an increase in adoption of advanced water quality instruments, ensuring that water sources remain free from contaminants and meet the stringent standards necessary for human well-being and industrial efficiency. For instance, according to the 2018 edition of the United Nations World Water Development Report, approximately 6 billion people are predicted to face a water scarcity by 2050. Therefore, there is a major need to save water, establish clear policies to minimize pollution, and protect aquifers worldwide. As a result, the water analysis instrument industry is projected to benefit from a rise in demand for water quality analyzers in both established and developing countries in the upcoming years.
High Cost of Equipment to Restrain the Market Growth
The cost of ownership of water quality instrument includes the initial purchase price as well as the maintenance cost, which includes the cost of consumables and replacement parts. Consumable expenditures are incurred for standard chemical solutions and reagent preparation. Furthermore, maintenance expenses for analyzers is a significant factor contributing to the entire cost of the equipment. After installation, the major instrument cost of ownership is in-plant maintenance and spare parts inventory administration. These expenses are then added to the total cost of manufacturing, which has a substantial influence on the overall profit margin. As a result of these reasons, water quality instrument is becoming an increasingly expensive product, which is anticipated to limit their use and hinder market revenue growth during the forecast period.
Rising Demand for Water and Wastewater Treatment to Drive Excellent Opportunities
Water wastage has become a major concern in both developed and developing countries, owing to increasing manufacturing activities. Therefore, many governments and non-governmental organizations are working hard to save water and natural resources. There are approximately 1.8 billion people worldwide who drink water that contains microorganisms, which cause health problems, such as cholera, dysentery, typhoid, polio, and others. Rapid industrialization and urbanization have led to increase in need for water treatment, and insufficient freshwater resources has prompted concerned authorities to impose regulations on water use and discharge of used water in natural water reserves. Industries and organizations are now required to treat and recycle wastewater before it is discharged into natural water bodies. Instrument systems are used in water and wastewater facilities in order to receive early warnings of water quality issues and equipment malfunctions. Sensors in these instruments measure pH, conductivity, oxidation-reduction potential (ORP), toroidal conductivity, flow rate, and vibration. Thus, increasing concerns regarding health and the environment is driving demand for water and wastewater treatment and thereby excellent growth opportunities in the market.
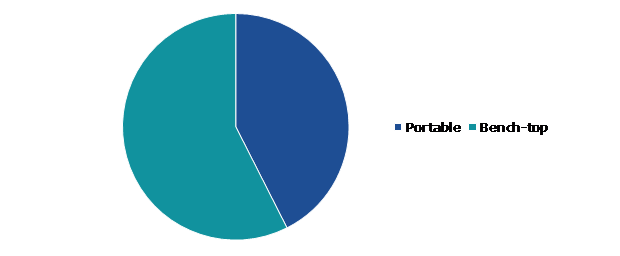
Global Water Quality Instrument Market Share, by Product Type, 2022
Source: Research Dive Analysis
The bench-top sub-segment accounted for the highest market share in 2022. Benchtop water quality equipment continues to dominate the market due to the increase in need for laboratory application. When combined with particular electrodes, the benchtop water quality instrument is appropriate for use in laboratories and give a more specific testing range. In addition, the bench-top segment of the water quality instrument market growth due to increasing demand for precise and convenient water analysis in laboratories. Key driving factors include the rising emphasis on water safety, stringent regulatory standards, and the need for accurate testing methods. Bench-top instrument offer efficient and reliable testing, contributing to their widespread adoption and market expansion.
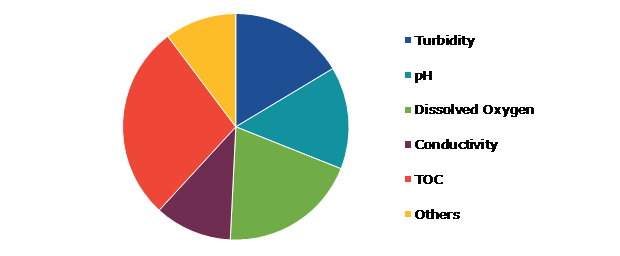
Global Water Quality Instrument Market Share, by Test Type, 2022
Source: Research Dive Analysis
The TOC sub-segment accounted for the highest market share in 2022. The Total Organic Carbon (TOC) segment is a key driving force in the water quality instrument market. Growing concerns about water contamination and stringent regulations necessitate precise TOC measurement tools for organic pollutants. Increasing industrial activities, wastewater discharges, and the need for reliable water quality assessment boost the demand for TOC analyzers. These instruments play a crucial role in ensuring water safety, environmental compliance, and efficient water treatment processes. As industries prioritize sustainable practices, the TOC segment's importance is projected to increase, driving innovation and adoption of advanced water quality instrument to safeguard water resources and meet regulatory standards.
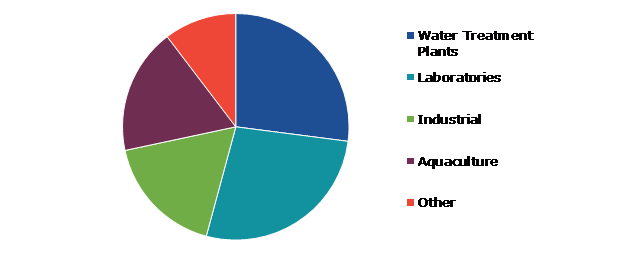
Global Water Quality Instrument Market Share, by End User, 2022
Source: Research Dive Analysis
The laboratories sub-segment accounted for the highest market share in 2022. The growing water quality instrument market is driven by a robust demand within the laboratories segment, due to rising concerns over water contamination. Laboratories rely on advanced instruments to ensure precise analysis, complying with stringent quality standards. The increasing emphasis on environmental sustainability and regulatory compliance increases the need for sophisticated water quality testing tools in research and testing facilities. Technological advancements, such as real-time instrument capabilities and automation, further boost the market growth. Laboratories prioritize these instruments to guarantee accurate assessments, playing a pivotal role in protecting global water resources and supporting sustainable ecosystems.
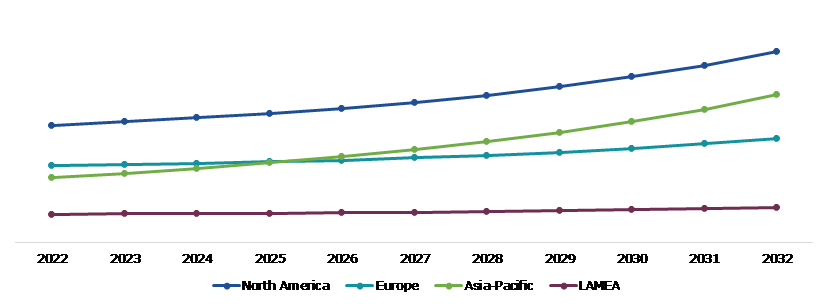
Global Water Quality Instrument Market Size & Forecast, by Region, 2022-2032 ($Million)
Source: Research Dive Analysis
The North America water quality instrument market generated the highest revenue in 2022. Due to technical improvements, increased environmental concerns, and major environmental rules implemented by government authorities, there is an increase in demand for water quality instruments in the regional wastewater treatment sector to ensure clean water. This is one of the major factors further driving the market revenue growth in North America. The growing government activities and funding for water pollution and contamination are also driving market expansion in the region. The government is undertaking several activities, such as lowering and monitor chemical pollutants, treating industrial effluent, and managing and reducing urban and agricultural pollution. Thus, the rising demand for water quality instruments in the region is projected to be boosted by the government's and various organizations' increasing efforts to reduce the contamination of water.
Competitive Scenario in the Global Water Quality Instrument Market
Investment and agreement are common strategies followed by major market players. For instance, in July 2021, HORIBA Advanced Techno launched the HD-960LR, a new dissolved oxygen meter for semiconductor and semiconductor production equipment manufacturers. This invention would allow for more precise monitoring of the dissolved oxygen level of chemicals throughout the semiconductor production process.

Source: Research Dive Analysis
Some of the companies operating in the water quality instrument market are Hanna Instrument, Honeywell International Inc, Mettler Toledo, Xylem, Inc., Evoqua Water Technologies LLC, Heron Instrument Inc, Jenco Instrument Inc, Sea-Bird Scientific, HORIBA Group, and LaMotte Company.
| Aspect | Particulars |
| Historical Market Estimations | 2020-2021 |
| Base Year for Market Estimation | 2022 |
| Forecast Timeline for Market Projection | 2023-2032 |
| Geographical Scope | North America, Europe, Asia-Pacific, and LAMEA |
| Segmentation by Product Type |
|
| Segmentation by Test Type |
|
|
Segmentation by End User
|
|
| Key Companies Profiled |
|
Q1. What is the size of the global water quality instrument market?
A. The size of the global water quality instrument market share was over $4,431.6 million in 2022 and is projected to reach $7,383.8 million by 2032.
Q2. Which are the major companies in the water quality instrument market?
A. Hanna Instrument, Honeywell International Inc, Mettler Toledo, and Xylem, Inc. are some of the key players in the global water quality instrument market.
Q3. Which region, among others, possesses greater investment opportunities in the future?
A. Asia-Pacific possesses great investment opportunities for investors in the future.
Q4. What will be the growth rate of the Asia-Pacific water quality instrument market?
A. The Asia-Pacific water quality instrument market share is anticipated to grow at 8.8% CAGR during the forecast period.
Q5. What are the strategies opted by the leading players in this market?
A. Agreement and investment are the two key strategies opted by the operating companies in this market.
Q6. Which companies are investing more on R&D practices?
A. Hanna Instrument, Honeywell International Inc, Mettler Toledo, and Xylem, Inc. are the companies investing more on R&D activities for developing new products and technologies.
1. Research Methodology
1.1. Desk Research
1.2. Real time insights and validation
1.3. Forecast model
1.4. Assumptions and forecast parameters
1.5. Market size estimation
1.5.1. Top-down approach
1.5.2. Bottom-up approach
2. Report Scope
2.1. Market definition
2.2. Key objectives of the study
2.3. Report overview
2.4. Market segmentation
2.5. Overview of the impact of COVID-19 on global water quality instrument market
3. Executive Summary
4. Market Overview
4.1. Introduction
4.2. Growth impact forces
4.2.1. Drivers
4.2.2. Restraints
4.2.3. Opportunities
4.3. Market value chain analysis
4.3.1. List of raw material suppliers
4.3.2. List of manufacturers
4.3.3. List of distributors
4.4. Innovation & sustainability matrices
4.4.1. Technology matrix
4.4.2. Regulatory matrix
4.5. Porter’s five forces analysis
4.5.1. Bargaining power of suppliers
4.5.2. Bargaining power of consumers
4.5.3. Threat of substitutes
4.5.4. Threat of new entrants
4.5.5. Competitive rivalry intensity
4.6. PESTLE analysis
4.6.1. Political
4.6.2. Economical
4.6.3. Social
4.6.4. Technological
4.6.5. Legal
4.6.6. Environmental
4.7. Impact of COVID-19 on water quality instrument market
4.7.1. Pre-covid market scenario
4.7.2. Post-covid market scenario
5. Water Quality Instrument Market Analysis, by Product Type
5.1. Overview
5.2. Portable
5.2.1. Definition, key trends, growth factors, and opportunities
5.2.2. Market size analysis, by region, 2022-2032
5.2.3. Market share analysis, by country, 2022-2032
5.3. Bench-top
5.3.1. Definition, key trends, growth factors, and opportunities
5.3.2. Market size analysis, by region, 2022-2032
5.3.3. Market share analysis, by country, 2022-2032
5.4. Research Dive Exclusive Insights
5.4.1. Market attractiveness
5.4.2. Competition heatmap
6. Water Quality Instrument Market Analysis, by Test Type
6.1. Turbidity
6.1.1. Definition, key trends, growth factors, and opportunities
6.1.2. Market size analysis, by region, 2022-2032
6.1.3. Market share analysis, by country, 2022-2032
6.2. pH
6.2.1. Definition, key trends, growth factors, and opportunities
6.2.2. Market size analysis, by region, 2022-2032
6.2.3. Market share analysis, by country, 2022-2032
6.3. Dissolved Oxygen
6.3.1. Definition, key trends, growth factors, and opportunities
6.3.2. Market size analysis, by region, 2022-2032
6.3.3. Market share analysis, by country, 2022-2032
6.4. Conductivity
6.4.1. Definition, key trends, growth factors, and opportunities
6.4.2. Market size analysis, by region, 2022-2032
6.4.3. Market share analysis, by country, 2022-2032
6.5. TOC
6.5.1. Definition, key trends, growth factors, and opportunities
6.5.2. Market size analysis, by region, 2022-2032
6.5.3. Market share analysis, by country, 2022-2032
6.6. Others
6.6.1. Definition, key trends, growth factors, and opportunities
6.6.2. Market size analysis, by region, 2022-2032
6.6.3. Market share analysis, by country, 2022-2032
6.7. Research Dive Exclusive Insights
6.7.1. Market attractiveness
6.7.2. Competition heatmap
7. Water Quality Instrument Market Analysis, by End User
7.1. Water Treatment Plants
7.1.1. Definition, key trends, growth factors, and opportunities
7.1.2. Market size analysis, by region, 2022-2032
7.1.3. Market share analysis, by country, 2022-2032
7.2. Laboratories
7.2.1. Definition, key trends, growth factors, and opportunities
7.2.2. Market size analysis, by region, 2022-2032
7.2.3. Market share analysis, by country, 2022-2032
7.3. Industrial
7.3.1. Definition, key trends, growth factors, and opportunities
7.3.2. Market size analysis, by region, 2022-2032
7.3.3. Market share analysis, by country, 2022-2032
7.4. Aquaculture
7.4.1. Definition, key trends, growth factors, and opportunities
7.4.2. Market size analysis, by region, 2022-2032
7.4.3. Market share analysis, by country, 2022-2032
7.5. Others
7.5.1. Definition, key trends, growth factors, and opportunities
7.5.2. Market size analysis, by region, 2022-2032
7.5.3. Market share analysis, by country, 2022-2032
7.6. Research Dive Exclusive Insights
7.6.1. Market attractiveness
7.6.2. Competition heatmap
8. Water Quality Instrument Market, by Region
8.1. North America
8.1.1. U.S.
8.1.1.1. Market size analysis, by Product Type, 2022-2032
8.1.1.2. Market size analysis, by Test Type, 2022-2032
8.1.1.3. Market size analysis, by End User, 2022-2032
8.1.2. Canada
8.1.2.1. Market size analysis, by Product Type, 2022-2032
8.1.2.2. Market size analysis, by Test Type, 2022-2032
8.1.2.3. Market size analysis, by End User, 2022-2032
8.1.3. Mexico
8.1.3.1. Market size analysis, by Product Type, 2022-2032
8.1.3.2. Market size analysis, by Test Type, 2022-2032
8.1.3.3. Market size analysis, by End User, 2022-2032
8.1.4. Research Dive Exclusive Insights
8.1.4.1. Market attractiveness
8.1.4.2. Competition heatmap
8.2. Europe
8.2.1. Germany
8.2.1.1. Market size analysis, by Product Type, 2022-2032
8.2.1.2. Market size analysis, by Test Type, 2022-2032
8.2.1.3. Market size analysis, by End User, 2022-2032
8.2.2. UK
8.2.2.1. Market size analysis, by Product Type, 2022-2032
8.2.2.2. Market size analysis, by Test Type, 2022-2032
8.2.2.3. Market size analysis, by End User, 2022-2032
8.2.3. France
8.2.3.1. Market size analysis, by Product Type, 2022-2032
8.2.3.2. Market size analysis, by Test Type, 2022-2032
8.2.3.3. Market size analysis, by End User, 2022-2032
8.2.4. Spain
8.2.4.1. Market size analysis, by Product Type, 2022-2032
8.2.4.2. Market size analysis, by Test Type, 2022-2032
8.2.4.3. Market size analysis, by End User, 2022-2032
8.2.5. Italy
8.2.5.1. Market size analysis, by Product Type, 2022-2032
8.2.5.2. Market size analysis, by Test Type, 2022-2032
8.2.5.3. Market size analysis, by End User, 2022-2032
8.2.6. Rest of Europe
8.2.6.1. Market size analysis, by Product Type, 2022-2032
8.2.6.2. Market size analysis, by Test Type, 2022-2032
8.2.6.3. Market size analysis, by End User, 2022-2032
8.2.7. Research Dive Exclusive Insights
8.2.7.1. Market attractiveness
8.2.7.2. Competition heatmap
8.3. Asia-Pacific
8.3.1. China
8.3.1.1. Market size analysis, by Product Type, 2022-2032
8.3.1.2. Market size analysis, by Test Type, 2022-2032
8.3.1.3. Market size analysis, by End User, 2022-2032
8.3.2. Japan
8.3.2.1. Market size analysis, by Product Type, 2022-2032
8.3.2.2. Market size analysis, by Test Type, 2022-2032
8.3.2.3. Market size analysis, by End User, 2022-2032
8.3.3. India
8.3.3.1. Market size analysis, by Product Type, 2022-2032
8.3.3.2. Market size analysis, by Test Type, 2022-2032
8.3.3.3. Market size analysis, by End User, 2022-2032
8.3.4. Australia
8.3.4.1. Market size analysis, by Product Type, 2022-2032
8.3.4.2. Market size analysis, by Test Type, 2022-2032
8.3.4.3. Market size analysis, by End User, 2022-2032
8.3.5. South Korea
8.3.5.1. Market size analysis, by Product Type, 2022-2032
8.3.5.2. Market size analysis, by Test Type, 2022-2032
8.3.5.3. Market size analysis, by End User, 2022-2032
8.3.6. Rest of Asia-Pacific
8.3.6.1. Market size analysis, by Product Type, 2022-2032
8.3.6.2. Market size analysis, by Test Type, 2022-2032
8.3.6.3. Market size analysis, by End User, 2022-2032
8.3.7. Research Dive Exclusive Insights
8.3.7.1. Market attractiveness
8.3.7.2. Competition heatmap
8.4. LAMEA
8.4.1. Brazil
8.4.1.1. Market size analysis, by Product Type, 2022-2032
8.4.1.2. Market size analysis, by Test Type, 2022-2032
8.4.1.3. Market size analysis, by End User, 2022-2032
8.4.2. Saudi Arabia
8.4.2.1. Market size analysis, by Product Type, 2022-2032
8.4.2.2. Market size analysis, by Test Type, 2022-2032
8.4.2.3. Market size analysis, by End User, 2022-2032
8.4.3. UAE
8.4.3.1. Market size analysis, by Product Type, 2022-2032
8.4.3.2. Market size analysis, by Test Type, 2022-2032
8.4.3.3. Market size analysis, by End User, 2022-2032
8.4.4. South Africa
8.4.4.1. Market size analysis, by Product Type, 2022-2032
8.4.4.2. Market size analysis, by Test Type, 2022-2032
8.4.4.3. Market size analysis, by End User, 2022-2032
8.4.5. Rest of LAMEA
8.4.5.1. Market size analysis, by Product Type, 2022-2032
8.4.5.2. Market size analysis, by Test Type, 2022-2032
8.4.5.3. Market size analysis, by End User, 2022-2032
8.4.6. Research Dive Exclusive Insights
8.4.6.1. Market attractiveness
8.4.6.2. Competition heatmap
9. Competitive Landscape
9.1. Top winning strategies, 2022
9.1.1. By strategy
9.1.2. By year
9.2. Strategic overview
9.3. Market share analysis, 2022
10. Company Profiles
10.1. Hanna Instruments
10.1.1. Overview
10.1.2. Business segments
10.1.3. Product portfolio
10.1.4. Financial performance
10.1.5. Recent developments
10.1.6. SWOT analysis
10.2. Honeywell International Inc
10.2.1. Overview
10.2.2. Business segments
10.2.3. Product portfolio
10.2.4. Financial performance
10.2.5. Recent developments
10.2.6. SWOT analysis
10.3. Mettler Toledo
10.3.1. Overview
10.3.2. Business segments
10.3.3. Product portfolio
10.3.4. Financial performance
10.3.5. Recent developments
10.3.6. SWOT analysis
10.4. Xylem, Inc.
10.4.1. Overview
10.4.2. Business segments
10.4.3. Product portfolio
10.4.4. Financial performance
10.4.5. Recent developments
10.4.6. SWOT analysis
10.5. Evoqua Water Technologies LLC
10.5.1. Overview
10.5.2. Business segments
10.5.3. Product portfolio
10.5.4. Financial performance
10.5.5. Recent developments
10.5.6. SWOT analysis
10.6. Heron Instruments Inc
10.6.1. Overview
10.6.2. Business segments
10.6.3. Product portfolio
10.6.4. Financial performance
10.6.5. Recent developments
10.6.6. SWOT analysis
10.7. Jenco Instruments Inc
10.7.1. Overview
10.7.2. Business segments
10.7.3. Product portfolio
10.7.4. Financial performance
10.7.5. Recent developments
10.7.6. SWOT analysis
10.8. Sea-Bird Scientific
10.8.1. Overview
10.8.2. Business segments
10.8.3. Product portfolio
10.8.4. Financial performance
10.8.5. Recent developments
10.8.6. SWOT analysis
10.9. HORIBA Group
10.9.1. Overview
10.9.2. Business segments
10.9.3. Product portfolio
10.9.4. Financial performance
10.9.5. Recent developments
10.9.6. SWOT analysis
10.10. LaMotte Company
10.10.1. Overview
10.10.2. Business segments
10.10.3. Product portfolio
10.10.4. Financial performance
10.10.5. Recent developments
10.10.6. SWOT analysis
Personalize this research
- Triangulate with your own data
- Request your format and definition
- Get a deeper dive on a specific application, geography, customer or competitor
- + 1-888-961-4454 Toll - Free
- support@researchdive.com
