Printed Electronics Market Report
RA09180
Printed Electronics Market by Material (Ink and Substrate), by Technology (Inkjet, Screen, Gravure, Flexographic), by Device (Display, Photovoltaic, Lighting, RFID, Others) and Region (North America, Europe, Asia-Pacific, and LAMEA): Global Opportunity Analysis and Industry Forecast, 2023-2032
Printed Electronics Market Overview
Printing processes such as screen printing, inkjet printing, and flexographic printing are used in printed electronics to deposit conductive inks and other functional materials onto surfaces, resulting in electronic circuits and components. Printed electronics, as opposed to traditional electronics manufacturing, which depends on sophisticated and expensive procedures such as photolithography and vacuum deposition, simplify production through a more direct and additive method. This leads to less material waste, cheaper manufacturing costs, and the capacity to build electronics on unusual surfaces, allowing for the development of flexible and even wearable systems.
The printed electronics market intends to revolutionize the manufacturing of electronic devices by allowing the construction of electrical circuits using additive methods. Traditional electronics production relies on subtractive procedures such as etching and milling, which may be time-consuming and wasteful. Printed electronics, on the other hand, take a more environmentally friendly method, depositing electronic inks onto substrates in a precise and regulated manner. This additive manufacturing technology not only saves material waste, but it also opens up new avenues for building electronics on unusual surfaces. The printed electronics market is distinguished by its low cost and scalability. Inkjet and screen-printing technologies, for example, may be easily modified for high-volume production, lowering manufacturing costs as compared to older methods.
Global Printed Electronics Market Analysis
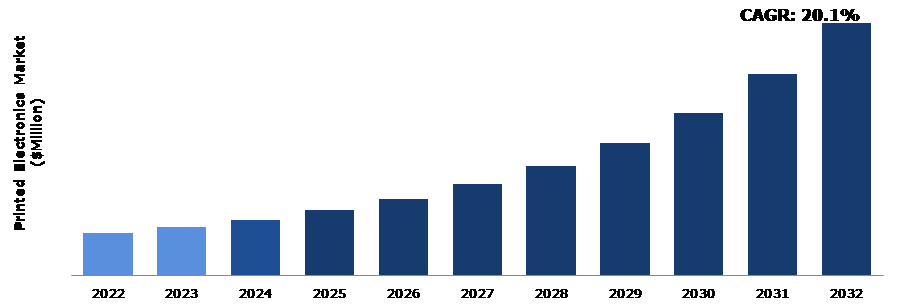
The global printed electronics market size was $9,386.10 million in 2022 and is predicted to grow with a CAGR of 20.1%, by generating a revenue of $55,661.40 million by 2032.
Source: Research Dive Analysis
COVID-19 Impact on Global Printed Electronics Market
One of the most immediate and significant consequences of the epidemic on printed electronics has been the interruption of supply networks. The sophisticated network of suppliers, producers, and distributors that forms the backbone of the printed electronics sector was disrupted by lockdowns, travel restrictions, and manpower shortages. This caused delays in the acquisition of critical materials such as conductive inks, substrates, and other components required for the fabrication of printed electronic devices. As a result, several businesses in the printed electronics industry were forced to rethink their supply chain strategy and seek alternate sources to maintain a consistent flow of materials. The epidemic highlighted the significance of innovation in the printed electronics industry.
Companies who took a flexible and inventive strategy not only survived the immediate obstacles, but also positioned themselves for long-term success. For instance, there was a boom in R&D activity targeted at developing printed electronics solutions to stop virus propagation. This includes the creation of printable sensors for pathogen detection, smart fabrics with antiviral capabilities, and flexible electrical devices for contactless vital sign monitoring. The crisis stimulated innovation by pushing the limits of what printed electronics could achieve in terms of utility and flexibility.
Thin and Lightweight Form Factor of Printed Electronics to Drive the Market Growth
The thin and lightweight nature of printed electronics allows for the fabrication of portable and wearable gadgets. The benefits of mobility and wearability are obvious, from flexible screens to lightweight sensors built into clothes. This is especially useful in industries such as healthcare, where wearable sensors may monitor vital signs, and sports, where players can benefit from unobtrusive performance-tracking technology. The small form of printed electronics enables the effective integration of electronic components. This is especially useful in areas where size limits are important, such as aerospace or automotive applications.
Reduced and lightweight electronics enable the creation of streamlined and efficient systems without sacrificing performance, resulting in breakthroughs in small and efficient electronic designs. Printed electronics provide unrivalled design flexibility. The ability to print electrical components on a variety of substrates offers up new avenues for innovative and unusual designs. This adaptability is especially useful in businesses where aesthetics and form factors are important, such as the consumer electronics and fashion industries. The incorporation of electronics into unusual forms and materials improves the overall user experience and broadens the design options.
Material Limitation to Restrain the Market Growth
Conductive inks are one of the key material restrictions in printed electronics. While these inks are critical in the fabrication of circuitry on flexible substrates, their conductivity, durability, and compatibility with various printing processes remain key hurdles. When compared to traditional materials, the conductivity of these inks frequently falls short, affecting the efficiency and performance of printed electrical devices. Furthermore, maintaining uniform conductivity throughout large-scale production processes is a significant challenge, limiting the scalability of printed electronics. Printed electronics frequently involves the integration of many materials to build multipurpose devices. Obtaining flawless compatibility between incompatible materials, on the other hand, is a difficult process. Mismatched thermal expansion coefficients, adhesion difficulties, and disparities in material characteristics can all lead to decreased device reliability and performance. This constraint not only reduces the efficiency of printed electronics, but it also stifles innovation by restricting the sorts of components that may be incorporated into a single device. Certain applications need specialized materials with distinct features, and the scarcity of suitable materials is a major barrier in printed electronics. Medical gadgets, for instance, may require biocompatible materials, whereas wearable electronics may demand flexible and elastic substrates. The absence of a varied variety of materials that match these precise characteristics limits the use of printed electronics in specialist areas, limiting progress in these disciplines.
Smart Packaging in Printed Electronics to Drive Excellent Opportunities
At its core, smart packaging is the inclusion of intelligent elements into packaging materials, allowing them to function beyond their traditional duty of mere confinement. Consumers' increase in the aspirations for improved product information, sustainability, and interactive experiences are driving this change. With its ability to effortlessly incorporate electrical components onto flexible substrates, printed electronics provides a broad platform for the creation of smart packaging solutions. One of the most important opportunities given by smart packaging in printed electronics is the improvement of product traceability and authenticity. Manufacturers can trace and monitor the whole supply chain in real time by combining printed sensors with RFID (Radio-Frequency Identification) tags. This not only helps to avoid counterfeit products, but it also allows for more effective inventory management, minimizing waste and maintaining product integrity. Consumers, on the other hand, gain from improved transparency by being able to make educated decisions based on the product's route from manufacture to consumption. In addition, smart packaging tackles rise in environmental concerns by providing sustainable solutions. The capacity to print electrical components on flexible and recyclable materials is consistent with the global trend for environmentally friendly packaging. Smart packaging in printed electronics provides opportunities for the development of biodegradable sensors and energy-efficient devices, therefore contributing to a decrease in total environmental impact throughout the package lifespan.
Global Printed Electronics Market Share, by Material, 2022

Source: Research Dive Analysis
The ink sub-segment accounted for the highest market share in 2022. Ink in printed electronics allows for the modification and customization of electrical devices. Extensive pattern and circuit printing offers personalized wearables, electronic skins, and smart surfaces. This level of customization not only improves the appearance of electrical devices, but also enables personalized solutions for specific applications. Printing with ink is completely compatible with additive manufacturing processes. This additive process allows for precise control over material deposition, resulting in the layer-by-layer creation of complex electrical devices. The use of ink in combination with additive manufacturing technologies provides design freedom and promotes innovation in the manufacture of electrical components. Ink compositions are constantly improving, with researchers generating superior conductive, semiconductive, and insulating inks. This continuing material improvement improves the performance of printed electrical devices, making them more efficient, long-lasting, and dependable.
Global Printed Electronics Market Share, by Technology, 2022

Source: Research Dive Analysis
The screen care sub-segment accounted for the highest market share in 2022. Screens in printed electronics may be engineered to be extremely energy efficient. The adoption of organic light-emitting diodes (OLEDs) and other low-power display technologies allows for longer battery life in electronic gadgets. This not only helps with ecological initiatives, but it also improves the viability of portable and wearable devices, where energy efficiency is crucial. Printed screens, which are frequently comprised of strong materials, can survive harsh climatic conditions. This resilience is notably useful in outdoor signs, vehicle displays, and other applications exposed to severe environments. Furthermore, the production methods connected with printed electronics contribute to greater dependability, lowering the chance of failures as compared to older screen technologies. The scalability of printed electronics enables mass manufacture, meeting worldwide market demands. The capacity to create displays on a large scale, whether for consumer electronics, smart packaging, or industrial applications, helps economies of scale, making sophisticated display technologies more affordable to a wider audience.
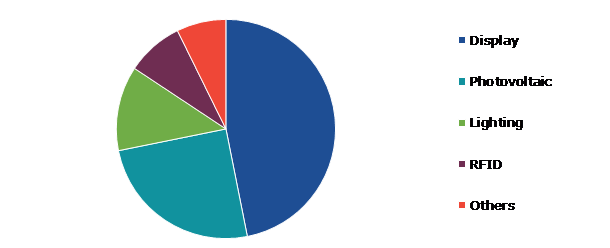
Global Printed Electronics Market Share, by Device, 2022
Source: Research Dive Analysis
The display care sub-segment accounted for the highest market share in 2022. The most obvious advantage of printed displays is the increased design freedom they provide. Devices are no longer limited by the flat and inflexible nature of conventional screens, allowing for more creative designs. Wearable gadgets can mould to the body, vehicle displays can merge effortlessly into curved dashboards, and smart home interfaces may be incorporated in unusual surfaces, ushering in a new era of design possibilities. Because printed display technologies are naturally scalable, they are well suited for mass manufacturing. The roll-to-roll manufacturing technologies used in printed electronics enable large-scale production, meeting worldwide market needs. This scalability coincides with consumer electronics production constraints, ensuring that the benefits of printed screens reach a broader audience. The biocompatibility of printed electronics is a game changer in healthcare. Printed screens may be effortlessly incorporated into wearable health monitoring devices, giving real-time data while minimizing wearer discomfort. Displays that are flexible and skin-like can adjust to the human body, allowing for continuous monitoring and improving patient outcomes.
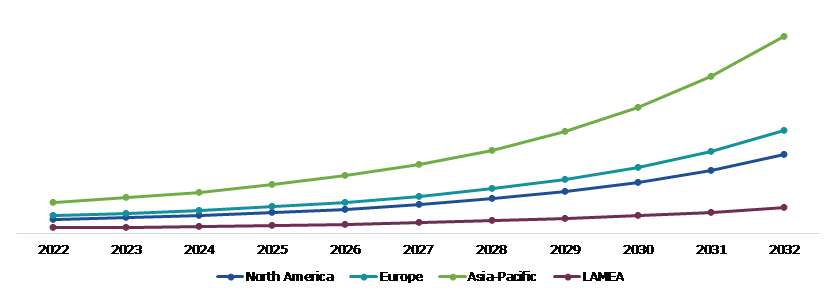
Global Printed Electronics Market Size & Forecast, by Region, 2022-2032 ($Million)
Source: Research Dive Analysis
The Asia-Pacific printed electronics market generated the highest revenue in 2022. Governments in the Asia-Pacific region see the strategic relevance of printed electronics and are enacting measures to promote its growth. To stimulate creativity and build an environment suitable for the development and use of printed electronics, financial incentives, research grants, and collaborative platforms are being provided. Printed electronics' versatility and speed enable quick prototyping and reduced time to market for innovative electrical products. This is especially advantageous for businesses in the Asia-Pacific area, where the rate of technical innovation is rapid and the capacity to bring goods to market quickly is a competitive advantage. Printed electronics are used in a variety of industries, such as healthcare, automotive, consumer electronics, and others. This adaptability helps to the technology's global acceptance, allowing Asian enterprises to explore and capitalize on varied markets.
Competitive Scenario in the Global Printed Electronics Market
Research and development (R&D) and focus on sustainable and flexible materials are common strategies followed by major market players. For instance, in oct. 13, 2021, Panasonic Industrial Devices Sales Company of America, a division of Panasonic Corporation of North America, has presented BEYOLEXTM, a new thermoset stretchable film for printed electronics, through its Electronic Materials Division. The unique material is based on Panasonic researchers at the Electronic Materials laboratory in Kadoma, Osaka, Japan, who created a proprietary non-silicone thermoset polymer chemistry.
Source: Research Dive Analysis
Some of the leading printed electronics players are Samsung Electronics Co., Ltd., LG Display Co., Ltd., Molex LLC, Agfa-Gevaert Group, Palo Alto Research Center Incorporated (PARC), DuPont de Nemours, Inc., Nissha Co., Ltd., BASF, Nova Centrix, and E Ink Holdings Inc.
| Aspect | Particulars |
| Historical Market Estimations | 2020-2021 |
| Base Year for Market Estimation | 2022 |
| Forecast Timeline for Market Projection | 2023-2032 |
| Geographical Scope | North America, Europe, Asia-Pacific, and LAMEA |
| Segmentation by Material |
|
| Segmentation by Technology |
|
| Segmentation by Device |
|
| Key Companies Profiled |
|
Q1. What is the size of the global printed electronics market?
A. The size of the global printed electronics market was $9,386.10 million in 2022 and is projected to reach $55,661.40 million by 2032.
Q2. Which are the major companies in the printed electronics market?
A. Samsung Electronics Co., Ltd., LG Display Co., Ltd., Molex LLC, Agfa-Gevaert Group, Palo Alto Research Center Incorporated (PARC), DuPont de Nemours, Inc., Nissha Co., Ltd., BASF, Nova Centrix, and E Ink Holdings Inc. are some of the key players in the global printed electronics market.
Q3. Which region, among others, possesses greater investment opportunities in the future?
A. Asia-Pacific possesses great investment opportunities for investors in the future.
Q4. What will be the growth rate of the Asia-Pacific printed electronics market?
A. The Asia-pacific printed electronics market is expected to grow at 20.9% CAGR during the forecast period.
Q5. What are the strategies opted by the leading players in this market?
A. Research and development (R&D) and focus on sustainable and flexible materials are the two key strategies opted by the operating companies in this market.
Q6. Which companies are investing more in R&D practices?
A. DuPont de Nemours and Nissha Co., Ltd are the companies investing more in R&D activities for developing new products and technologies.
1. Research Methodology
1.1. Desk Research
1.2. Real time insights and validation
1.3. Forecast model
1.4. Assumptions and forecast parameters
1.5. Market size estimation
1.5.1. Top-down approach
1.5.2. Bottom-up approach
2. Report Scope
2.1. Market definition
2.2. Key objectives of the study
2.3. Report overview
2.4. Market segmentation
2.5. Overview of the impact of COVID-19 on global printed electronics market
3. Executive Summary
4. Market Overview
4.1. Introduction
4.2. Growth impact forces
4.2.1. Drivers
4.2.2. Restraints
4.2.3. Opportunities
4.3. Market value chain analysis
4.3.1. List of raw material suppliers
4.3.2. List of manufacturers
4.3.3. List of distributors
4.4. Innovation & sustainability matrices
4.4.1. Technology matrix
4.4.2. Regulatory matrix
4.5. Porter’s five forces analysis
4.5.1. Bargaining power of suppliers
4.5.2. Bargaining power of consumers
4.5.3. Threat of substitutes
4.5.4. Threat of new entrants
4.5.5. Competitive Rivalry Intensity
4.6. PESTLE analysis
4.6.1. Political
4.6.2. Economical
4.6.3. Social
4.6.4. Technological
4.6.5. Environmental
4.6.6. Legal
4.7. Impact of COVID-19 on printed electronics market
4.7.1. Pre-covid market scenario
4.7.2. Post-covid market scenario
5. Printed Electronics Market Analysis, By Material
5.1. Overview
5.2. Ink
5.2.1. Definition, key trends, growth factors, and opportunities
5.2.2. Market size analysis, by region, 2022-2032
5.2.3. Market share analysis, by country, 2022-2032
5.3. Substrate
5.3.1. Definition, key trends, growth factors, and opportunities
5.3.2. Market size analysis, by region, 2022-2032
5.3.3. Market share analysis, by country, 2022-2032
5.4. Research Dive Exclusive Insights
5.4.1. Market attractiveness
5.4.2. Competition heatmap
6. Printed Electronics Market Analysis, by Technology
6.1. Overview
6.2. Inkjet
6.2.1. Definition, key trends, growth factors, and opportunities
6.2.2. Market size analysis, by region, 2022-2032
6.2.3. Market share analysis, by country, 2022-2032
6.3. Screen
6.3.1. Definition, key trends, growth factors, and opportunities
6.3.2. Market size analysis, by region, 2022-2032
6.3.3. Market share analysis, by country, 2022-2032
6.4. Gravure
6.4.1. Definition, key trends, growth factors, and opportunities
6.4.2. Market size analysis, by region, 2022-2032
6.4.3. Market share analysis, by country, 2022-2032
6.5. Flexographic
6.5.1. Definition, key trends, growth factors, and opportunities
6.5.2. Market size analysis, by region, 2022-2032
6.5.3. Market share analysis, by country, 2022-2032
6.6. Research Dive Exclusive Insights
6.6.1. Market attractiveness
6.6.2. Competition heatmap
7. Printed Electronics Market Analysis, by Device
7.1. Overview
7.2. Display
7.2.1. Definition, key trends, growth factors, and opportunities
7.2.2. Market size analysis, by region, 2022-2032
7.2.3. Market share analysis, by country, 2022-2032
7.3. Photovoltaic
7.3.1. Definition, key trends, growth factors, and opportunities
7.3.2. Market size analysis, by region, 2022-2032
7.3.3. Market share analysis, by country, 2022-2032
7.4. Lighting
7.4.1. Definition, key trends, growth factors, and opportunities
7.4.2. Market size analysis, by region, 2022-2032
7.4.3. Market share analysis, by country, 2022-2032
7.5. RFID
7.5.1. Definition, key trends, growth factors, and opportunities
7.5.2. Market size analysis, by region, 2022-2032
7.5.3. Market share analysis, by country, 2022-2032
7.6. Others
7.6.1. Definition, key trends, growth factors, and opportunities
7.6.2. Market size analysis, by region, 2022-2032
7.6.3. Market share analysis, by country, 2022-2032
7.7. Research Dive Exclusive Insights
7.7.1. Market attractiveness
7.7.2. Competition heatmap
8. Printed Electronics Market, by region
8.1. North America
8.1.1. U.S.
8.1.1.1. Market size analysis, by Material, 2022-2032
8.1.1.2. Market size analysis, by Technology, 2022-2032
8.1.1.3. Market size analysis, by Device, 2022-2032
8.1.2. Canada
8.1.2.1. Market size analysis, by Material, 2022-2032
8.1.2.2. Market size analysis, by Technology, 2022-2032
8.1.2.3. Market size analysis, by Device, 2022-2032
8.1.3. Mexico
8.1.3.1. Market size analysis, by Material, 2022-2032
8.1.3.2. Market size analysis, by Technology, 2022-2032
8.1.3.3. Market size analysis, by Device, 2022-2032
8.1.4. Research Dive Exclusive Insights
8.1.4.1. Market attractiveness
8.1.4.2. Competition heatmap
8.2. Europe
8.2.1. Germany
8.2.1.1. Market size analysis, by Material, 2022-2032
8.2.1.2. Market size analysis, by Technology, 2022-2032
8.2.1.3. Market size analysis, by Device, 2022-2032
8.2.2. UK
8.2.2.1. Market size analysis, by Material, 2022-2032
8.2.2.2. Market size analysis, by Technology, 2022-2032
8.2.2.3. Market size analysis, by Device, 2022-2032
8.2.3. France
8.2.3.1. Market size analysis, by Material, 2022-2032
8.2.3.2. Market size analysis, by Technology, 2022-2032
8.2.3.3. Market size analysis, by Device, 2022-2032
8.2.4. Spain
8.2.4.1. Market size analysis, by Material, 2022-2032
8.2.4.2. Market size analysis, by Technology, 2022-2032
8.2.4.3. Market size analysis, by Device, 2022-2032
8.2.5. Italy
8.2.5.1. Market size analysis, by Material, 2022-2032
8.2.5.2. Market size analysis, by Technology, 2022-2032
8.2.5.3. Market size analysis, by Device, 2022-2032
8.2.6. Rest of Europe
8.2.6.1. Market size analysis, by Material, 2022-2032
8.2.6.2. Market size analysis, by Technology, 2022-2032
8.2.6.3. Market size analysis, by Device, 2022-2032
8.2.7. Research Dive Exclusive Insights
8.2.7.1. Market attractiveness
8.2.7.2. Competition heatmap
8.3. Asia-Pacific
8.3.1. China
8.3.1.1. Market size analysis, by Material, 2022-2032
8.3.1.2. Market size analysis, by Technology, 2022-2032
8.3.1.3. Market size analysis, by Device, 2022-2032
8.3.2. Japan
8.3.2.1. Market size analysis, by Material, 2022-2032
8.3.2.2. Market size analysis, by Technology, 2022-2032
8.3.2.3. Market size analysis, by Device, 2022-2032
8.3.3. India
8.3.3.1. Market size analysis, by Material, 2022-2032
8.3.3.2. Market size analysis, by Technology, 2022-2032
8.3.3.3. Market size analysis, by Device, 2022-2032
8.3.4. Australia
8.3.4.1. Market size analysis, by Material, 2022-2032
8.3.4.2. Market size analysis, by Technology, 2022-2032
8.3.4.3. Market size analysis, by Device, 2022-2032
8.3.5. Indonesia
8.3.5.1. Market size analysis, by Material, 2022-2032
8.3.5.2. Market size analysis, by Technology, 2022-2032
8.3.5.3. Market size analysis, by Device, 2022-2032
8.3.6. Rest of Asia-Pacific
8.3.6.1. Market size analysis, by Material, 2022-2032
8.3.6.2. Market size analysis, by Technology, 2022-2032
8.3.6.3. Market size analysis, by Device, 2022-2032
8.3.7. Research Dive Exclusive Insights
8.3.7.1. Market attractiveness
8.3.7.2. Competition heatmap
8.4. LAMEA
8.4.1. Brazil
8.4.1.1. Market size analysis, by Material, 2022-2032
8.4.1.2. Market size analysis, by Technology, 2022-2032
8.4.1.3. Market size analysis, by Device, 2022-2032
8.4.2. UAE
8.4.2.1. Market size analysis, by Material, 2022-2032
8.4.2.2. Market size analysis, by Technology, 2022-2032
8.4.2.3. Market size analysis, by Device, 2022-2032
8.4.3. South Africa
8.4.3.1. Market size analysis, by Material, 2022-2032
8.4.3.2. Market size analysis, by Technology, 2022-2032
8.4.3.3. Market size analysis, by Device, 2022-2032
8.4.4. Argentina
8.4.4.1. Market size analysis, by Material, 2022-2032
8.4.4.2. Market size analysis, by Technology, 2022-2032
8.4.4.3. Market size analysis, by Device, 2022-2032
8.4.5. Rest of LAMEA
8.4.5.1. Market size analysis, by Material, 2022-2032
8.4.5.2. Market size analysis, by Technology, 2022-2032
8.4.5.3. Market size analysis, by Device, 2022-2032
8.4.6. Research Dive Exclusive Insights
8.4.6.1. Market attractiveness
8.4.6.2. Competition heatmap
9. Competitive Landscape
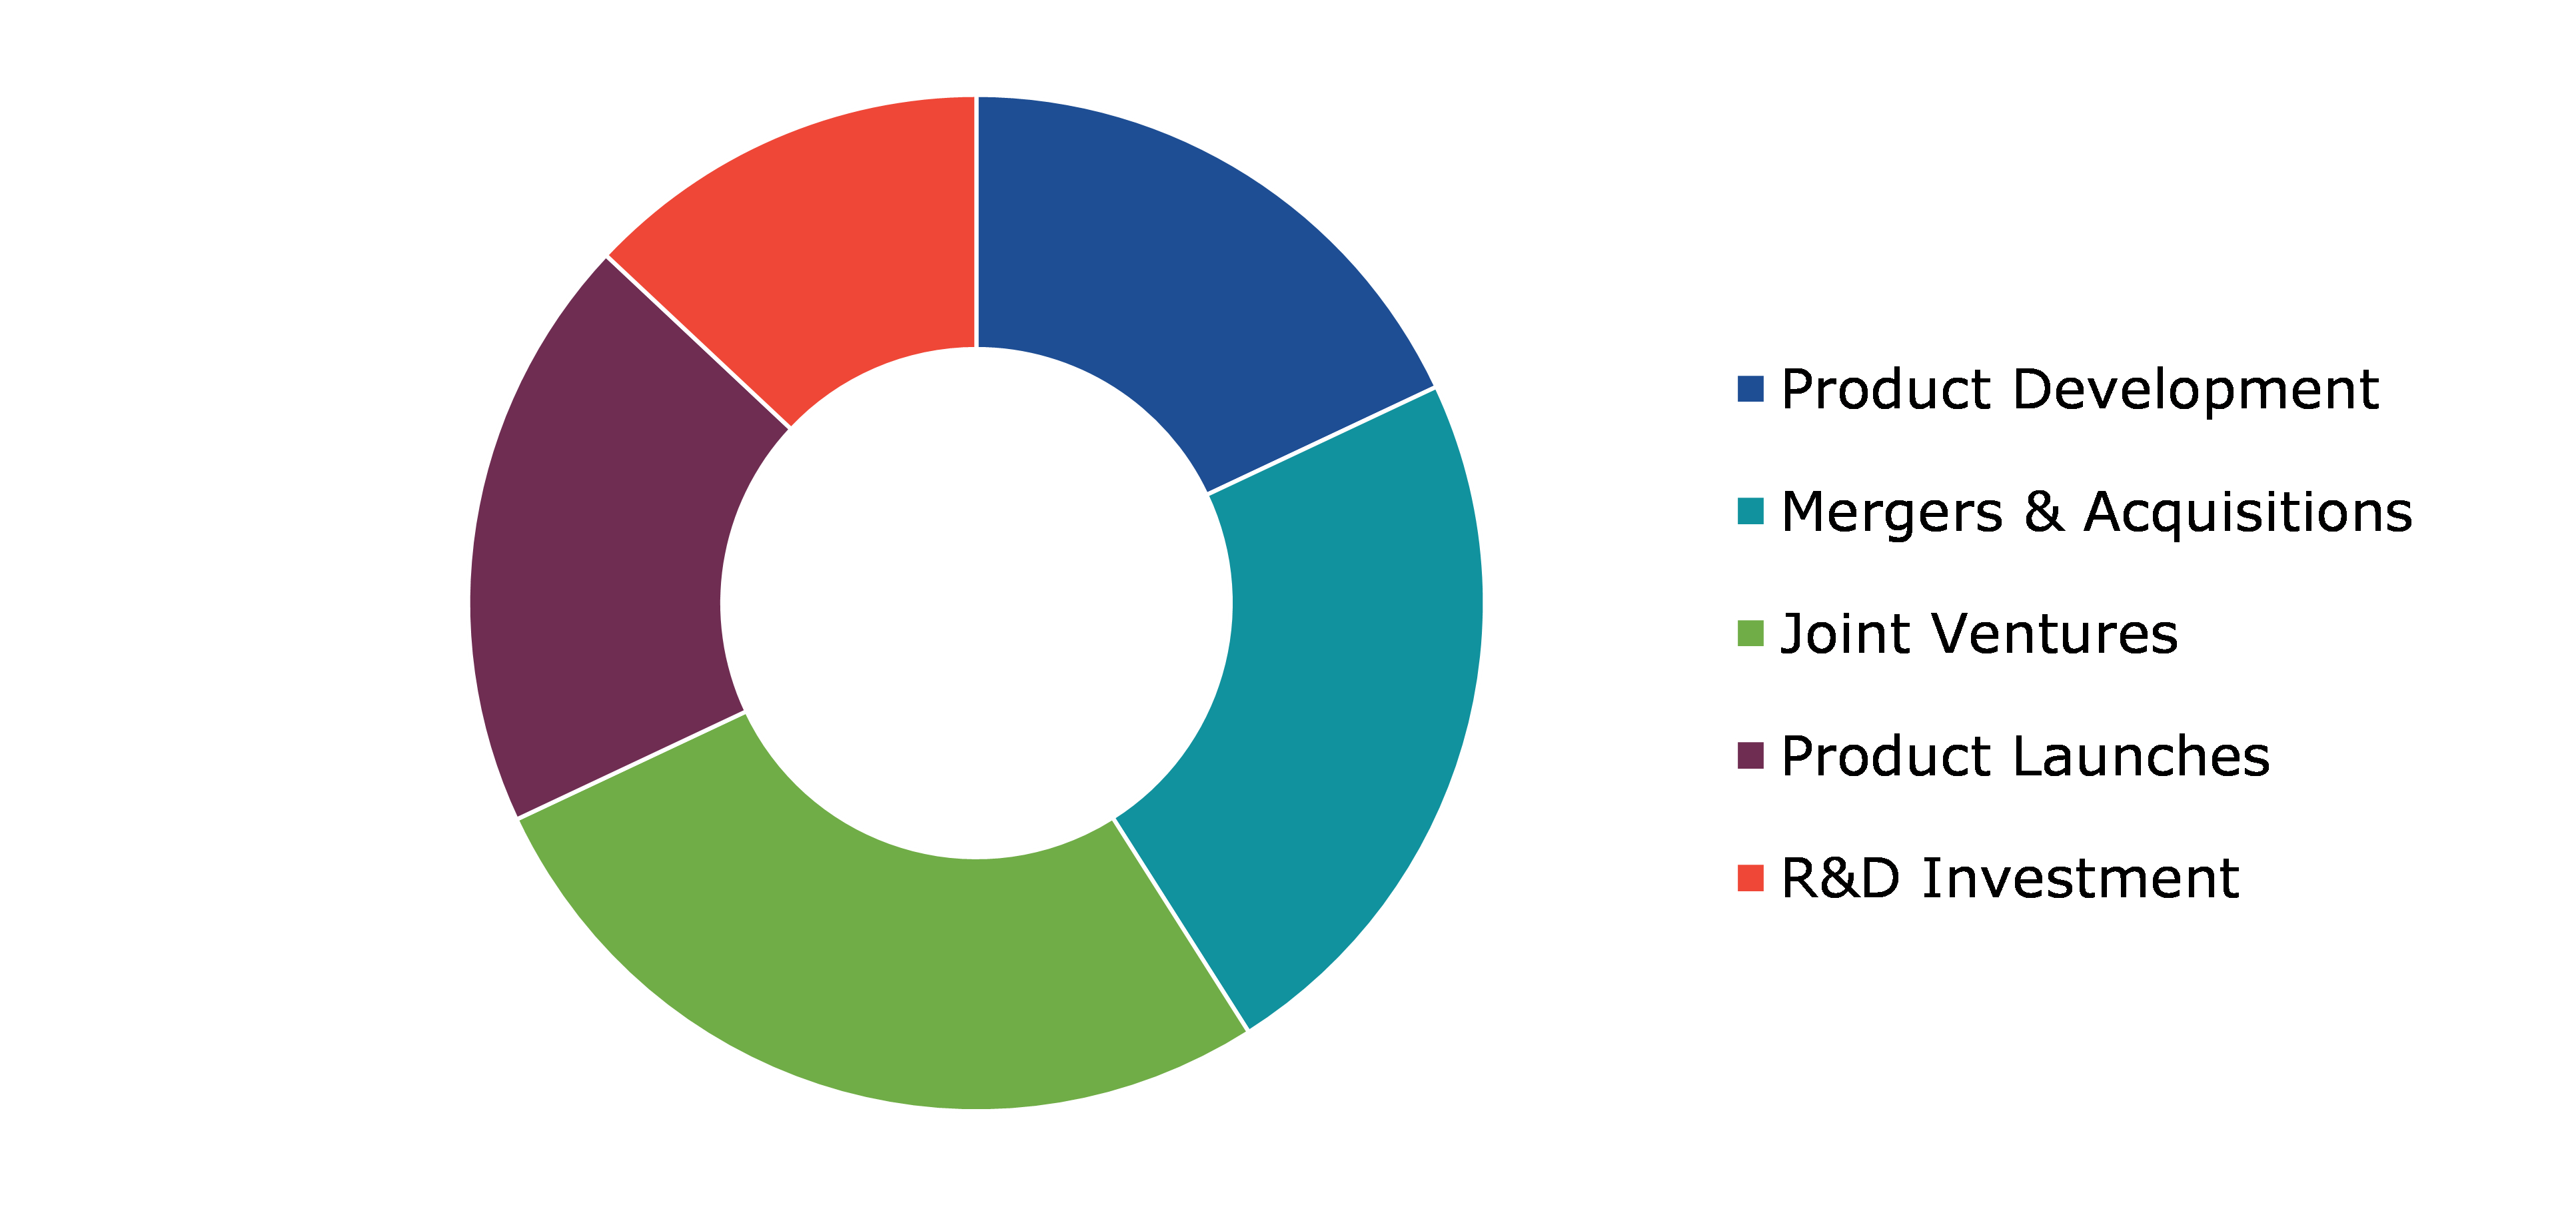
9.1. Top winning strategies, 2022
9.1.1. By strategy
9.1.2. By year
9.2. Strategic overview
9.3. Market share analysis, 2022
10. Company Profiles
10.1. Samsung Electronics Co., Ltd
10.1.1. Overview
10.1.2. Business segments
10.1.3. Product portfolio
10.1.4. Financial performance
10.1.5. Recent developments
10.1.6. SWOT analysis
10.2. LG Display Co., Ltd.
10.2.1. Overview
10.2.2. Business segments
10.2.3. Product portfolio
10.2.4. Financial performance
10.2.5. Recent developments
10.2.6. SWOT analysis
10.3. Molex LLC
10.3.1. Overview
10.3.2. Business segments
10.3.3. Product portfolio
10.3.4. Financial performance
10.3.5. Recent developments
10.3.6. SWOT analysis
10.4. Agfa-Gevaert Group
10.4.1. Overview
10.4.2. Business segments
10.4.3. Product portfolio
10.4.4. Financial performance
10.4.5. Recent developments
10.4.6. SWOT analysis
10.5. Palo Alto Research Center Incorporated (PARC)
10.5.1. Overview
10.5.2. Business segments
10.5.3. Product portfolio
10.5.4. Financial performance
10.5.5. Recent developments
10.5.6. SWOT analysis
10.6. DuPont de Nemours, Inc
10.6.1. Overview
10.6.2. Business segments
10.6.3. Product portfolio
10.6.4. Financial performance
10.6.5. Recent developments
10.6.6. SWOT analysis
10.7. Nissha Co., Ltd.
10.7.1. Overview
10.7.2. Business segments
10.7.3. Product portfolio
10.7.4. Financial performance
10.7.5. Recent developments
10.7.6. SWOT analysis
10.8. BASF
10.8.1. Overview
10.8.2. Business segments
10.8.3. Product portfolio
10.8.4. Financial performance
10.8.5. Recent developments
10.8.6. SWOT analysis
10.9. Nova Centrix
10.9.1. Overview
10.9.2. Business segments
10.9.3. Product portfolio
10.9.4. Financial performance
10.9.5. Recent developments
10.9.6. SWOT analysis
10.10. E Ink Holdings Inc
10.10.1. Overview
10.10.2. Business segments
10.10.3. Product portfolio
10.10.4. Financial performance
10.10.5. Recent developments
10.10.6. SWOT analysis
Personalize this research
- Triangulate with your own data
- Request your format and definition
- Get a deeper dive on a specific application, geography, customer or competitor
- + 1-888-961-4454 Toll - Free
- support@researchdive.com
