Gaming Software Market Report
RA09169
Gaming Software Market by Purchase Type (Box/CD Game, Shareware, Freeware, In-App & Purchase-based, and Digital), Type (PC Games, Browser Games, Console Games, and Smartphone/Tablet Games), and Region (North America, Europe, Asia-Pacific, and LAMEA): Global Opportunity Analysis and Industry Forecast, 2023-2032
Gaming Software Overview
Gaming can be defined as playing electronic games via computers, mobile phones, consoles, or another medium altogether. There is an increase in the prevalence of high-speed internet connections, especially in emerging economies, which has made online gaming practical for more people in recent years.
Gaming has found a wide range of applications and is especially popular for educational purposes. A game development software or platform is a tool that assists in the creation of web, desktop, or mobile games. These tools enable conversion of 3D models and textures into a gaming format along with script compilation and level editing. The software or platforms are often provided as a packaged solution/software suite, which supports game development for 2D, 3D, or both. Some of these packaged solutions/software suites also offer cross-platform capabilities, which create games across all operating systems such as Microsoft, iOS, and Android.
Global Gaming Software Market Analysis
The global gaming software market size was $1,27,142.4 million in 2022 and is predicted to grow with a CAGR of 9.3%, by generating a revenue of $ 3,01,538.8 million by 2032.

Source: Research Dive Analysis
COVID-19 Impact on Global Gaming Software Market
COVID-19 has had a significant impact on the growth of the global gaming software market. Lockdowns caused a surge in internet usage globally, which resulted in the younger generation to engage in gaming. Additionally, the sector is anticipated to benefit from the rising popularity of the work-from-home trend and the continued development and use of virtual reality and mixed reality in gaming software. Thus, during the time of COVID-19 lockdowns and social distancing regulations, people's greatly increased screen time and digital presence, which significantly boosted the market's growth.
The post-COVID-19 era has witnessed a significant surge in the demand for gaming software. With people spending more time indoors, the gaming industry experienced rapid growth. Online multiplayer games, virtual reality experiences, and mobile gaming saw increased engagement, driving innovation and expansion in the sector.
Cross-Platform Gaming Support Advancements to Drive Market Growth
Cross-platform publishing and video games are expected to boost the gaming software industry throughout the forecast period. Companies in the personal computer (PC) games industry are releasing cross-platform publishing and video games to make gaming more flexible for players. The market is experiencing growth due to significant advancements in cross-platform gaming support. As players increasingly seek seamless gaming experiences across various devices, including consoles, PCs, and mobile, game developers are responding by enhancing compatibility and multiplayer features. This convenience-driven trend is breaking down barriers and encouraging more players to join the gaming community. Additionally, key factors fueling this market growth include the growing demand for multi-device gaming, improving technology that enables smoother cross-platform gameplay, and the desire for unified gaming communities. Moreover, cross-platform support attracts more players, enhances player engagement, and offers lucrative opportunities for game developers and platform providers... The flexibility provided by cross-platform publication and video games will boost the video game software market share throughout the projection period.
Hardware Limitations and Upgrades to Restrain the Market Growth
High-quality gaming demands a variety of modern graphic cards, CPUs, and significant investments in advanced technology capable of optimally running the latest games. Sometimes, the focus on developing costly hardware has overshadowed the assessment of gaming software. As a result, this creates a potential barrier for some gamers who may not be able to afford frequent hardware upgrades. The cost of maintaining the latest gaming equipment restricts the market's development potential, particularly in countries where disposable income is limited. Furthermore, established game publishers and developers frequently dominate the gaming software sector, making it more difficult for younger entrants to establish themselves. Such factors are predicted to restrict the gaming software market growth throughout the forecast period.
Increasing Demand for Streaming Games to Drive Excellent Opportunities
The rising demand for streaming games has created excellent growth opportunities within the gaming software market. As players increasingly pursue instant access to a wide range of games on various devices, the market responds with innovations in cloud gaming and streaming services. This trend not only enhances user convenience but also fosters competition and collaboration among industry players, making it a dynamic and promising sector for future development. Gaming software companies are rapidly developing streaming video game services to capitalize on upcoming 5G and cloud computing technology. Several nations are currently adopting 5G, which has significantly increased internet speed. This will boost the number of game downloads and streams. Streaming allows users to play the most recent version of the game without having to update it at all. Cloud computing and faster internet connections will allow consumers to play games from any computer, increasing accessibility. For example, in August 2019, Hatch Premium launched its unlimited mobile cloud gaming on Sprint's 5G networks in the United States. It allows games to be broadcast to mobile devices over the cloud. Monument Valley, Beach Buggy Racing, and Angry Birds Go are among the games.
Global Gaming Software Market Share, by Purchase Type, 2022

Source: Research Dive Analysis
The box/CD games sub-segment accounted for the highest market share in 2022. The increased purchasing power of gamers is an important market driver. Increased purchasing power, along with the need for a more intense gaming experience, has driven gamers to choose a higher generation of box/CD games with 3D features, fueling the adoption of box/CD games. Furthermore, premium price of home box/CD games and related accessories may drive the growth of box/CD games throughout the projection period. In addition, In the gaming software market, the boxed/CD games segment is being driven by several key factors. These include the enduring demand for physical copies, collector's editions, and retail presence. Additionally, limited edition releases and nostalgia-driven purchases are driving the growth of this segment. As a result, the category is predicted to grow gradually throughout the forecast period.
Global Gaming Software Market Share, by Type, 2022

Source: Research Dive Analysis
The smartphones/tablet game sub-segment accounted for the highest market share in 2022. Technological advancements and increasing smartphone adoption throughout the world are expected to play a significant role in the smartphones/tablet sub-segment's growth. Additionally, increased profits in the globally smart phones/tablet sub-segment, along with an increasing number of casual (those who play games infrequently or for leisure) and significant players (serious gamers who are highly engaged in gaming activities), has prompted the creation of new products. Many of the newly released titles are free-to-play games with optional in-app purchases, which are becoming significant income sources. In-app purchases are frequently used by gamers to personalize characters or gain access to premium features. For example, Activision Blizzard's flagship game, Call of Duty (smartphone) rapidly gained traction, gaining over 35 million downloads in four days after its October 2019 launched. After a successful launch, manufacturers began porting popular console and PC games to mobile devices utilizing powerful gaming engines, spurring more development in this segment.
Global Gaming Software Market Size & Forecast, by Region, 2022-2032 ($Million)

Source: Research Dive Analysis
The North America gaming software market generated the highest revenue in 2022. The regional market growth is driven by the strong gaming culture, high disposable income and advanced technological infrastructure. This region is majorly known for technological innovation and the key development of cutting-edge gaming software. For instance, Silicon Valley and various technology hubs help to create new gaming experiences such as virtual reality (VR), augmented reality (AR), and e-sports powerhouse. E-sports is the biggest tournament and league, attracting a massive audience and generating significant revenue. In addition, favorable legislative framework, rising demand for cloud gaming, wide availability of a range of technologically advanced mobile phones and high-speed Internet connections are some factors supporting the online gambling industry and contributing to revenue growth of the market in the region. In addition, rapid innovations in software and an increase in the number of online gambling sites are some factors expected to drive revenue growth of the gaming software market share in the region.
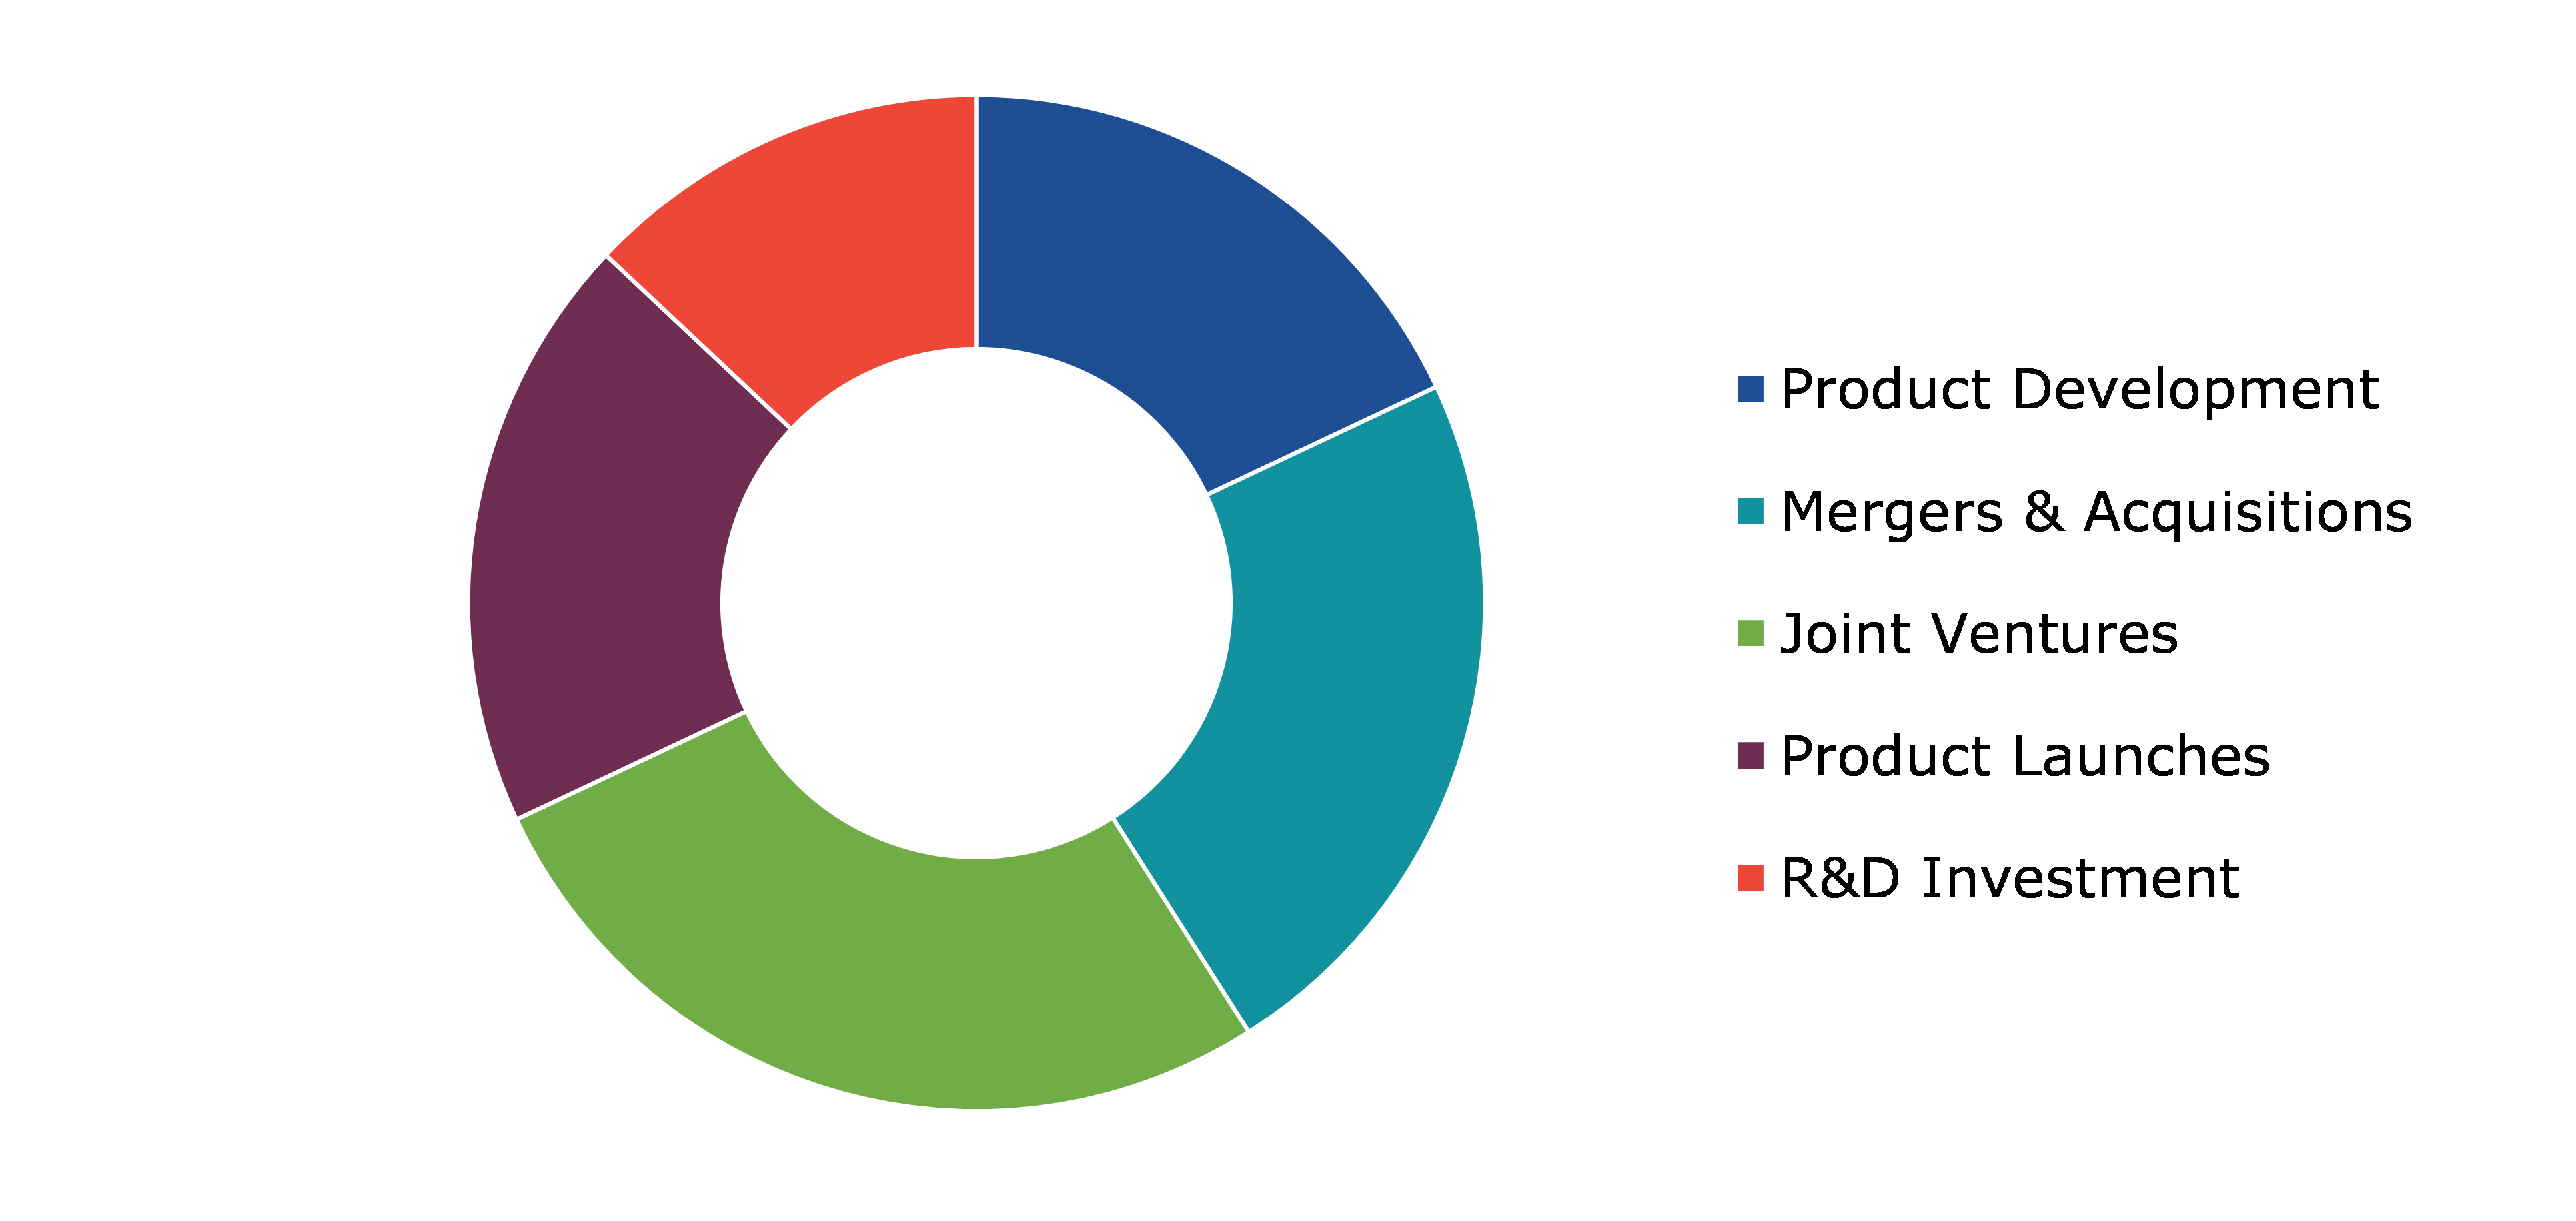
Competitive Scenario in the Global Gaming Software Market
Investment and agreement are common strategies followed by major market players. One of the leading market players in the industry is Sony. In March 2022, Sony announced the acquisition of Montreal-based Haven Entertainment Studios Inc. Haven Studios, created in March 2021 with SIE investment, is managed by a team of world-class game developers with over 10 years of expertise in some of the industry's most successful games and brands. Sony, a leading gaming software company, is known for its PlayStation consoles and exclusive game titles. It continues to innovate, delivering immersive gaming experiences to a global audience.
Source: Research Dive Analysis
Some of the companies operating in the gaming software market are Sony Corporation, Valve Corporation, Ubisoft Entertainment S.A., Rockstar Games Inc., Nintendo Co., Ltd., Nexon Co, Ltd., Gameloft, Microsoft Corporation, Nvidia Computer Game Company, Electronic Arts Inc.
| Aspect | Particulars |
| Historical Market Estimations | 2020-2021 |
| Base Year for Market Estimation | 2022 |
| Forecast Timeline for Market Projection | 2023-2032 |
| Geographical Scope | North America, Europe, Asia-Pacific, and LAMEA |
| Segmentation by Purchase Type |
|
| Segmentation by Type |
|
| Key Companies Profiled |
|
Q1. What is the size of the global gaming software market?
A. The size of the global gaming software market size was over $1,27,142.4 million in 2022 and is projected to reach $3,01,538.8 million by 2032.
Q2. Which are the major companies in the gaming software market?
A. Sony Corporation, Valve Corporation, Ubisoft Entertainment S.A., Rockstar Games Inc. are some of the key players in the global gaming software market.
Q3. Which region, among others, possesses greater investment opportunities in the near future?
A. Asia-Pacific possesses great investment opportunities for investors in the future.
Q4. What will be the growth rate of the Asia-Pacific gaming software market?
A. The Asia-Pacific gaming software market share is anticipated to grow at 10.6% CAGR during the forecast period.
Q5. What are the strategies opted by the leading players in this market?
A. Agreement and investment are the two key strategies opted by the operating companies in this market.
Q6. Which companies are investing more on R&D practices?
A. Sony Corporation, Valve Corporation, Ubisoft Entertainment S.A., Rockstar Games Inc. are the companies investing more on R&D activities for developing new products and technologies.
1. Research Methodology
1.1. Desk Research
1.2. Real time insights and validation
1.3. Forecast model
1.4. Assumptions and forecast parameters
1.5. Market size estimation
1.5.1. Top-down approach
1.5.2. Bottom-up approach
2. Report Scope
2.1. Market definition
2.2. Key objectives of the study
2.3. Report overview
2.4. Market segmentation
2.5. Overview of the impact of COVID-19 on global gaming software market
3. Executive Summary
4. Market Overview
4.1. Introduction
4.2. Growth impact forces
4.2.1. Drivers
4.2.2. Restraints
4.2.3. Opportunities
4.3. Market value chain analysis
4.3.1. List of raw material suppliers
4.3.2. List of manufacturers
4.3.3. List of distributors
4.4. Innovation & sustainability matrices
4.4.1. Technology matrix
4.4.2. Regulatory matrix
4.5. Porter’s five forces analysis
4.5.1. Bargaining power of suppliers
4.5.2. Bargaining power of consumers
4.5.3. Threat of substitutes
4.5.4. Threat of new entrants
4.5.5. Competitive rivalry intensity
4.6. PESTLE analysis
4.6.1. Political
4.6.2. Economical
4.6.3. Social
4.6.4. Technological
4.6.5. Environmental
4.7. Impact of COVID-19 on gaming software market
4.7.1. Pre-covid market scenario
4.7.2. Post-covid market scenario
5. Gaming Software Market Analysis, by Purchase Type
5.1. Overview
5.2. Box/CD Game
5.2.1. Definition, key trends, growth factors, and opportunities
5.2.2. Market size analysis, by region, 2022-2032
5.2.3. Market share analysis, by country, 2022-2032
5.3. Shareware
5.3.1. Definition, key trends, growth factors, and opportunities
5.3.2. Market size analysis, by region, 2022-2032
5.3.3. Market share analysis, by country, 2022-2032
5.4. Freeware
5.4.1. Definition, key trends, growth factors, and opportunities
5.4.2. Market size analysis, by region, 2022-2032
5.4.3. Market share analysis, by country, 2022-2032
5.5. In-App and Purchase-based
5.5.1. Definition, key trends, growth factors, and opportunities
5.5.2. Market size analysis, by region, 2022-2032
5.5.3. Market share analysis, by country, 2022-2032
5.6. Digital
5.6.1. Definition, key trends, growth factors, and opportunities
5.6.2. Market size analysis, by region, 2022-2032
5.6.3. Market share analysis, by country, 2022-2032
5.7. Research Dive Exclusive Insights
5.7.1. Market attractiveness
5.7.2. Competition heatmap
6. Gaming Software Market Analysis, by Type
6.1. PC Games
6.1.1. Definition, key trends, growth factors, and opportunities
6.1.2. Market size analysis, by region, 2022-2032
6.1.3. Market share analysis, by country, 2022-2032
6.2. Browser Games
6.2.1. Definition, key trends, growth factors, and opportunities
6.2.2. Market size analysis, by region, 2022-2032
6.2.3. Market share analysis, by country, 2022-2032
6.3. Console Games
6.3.1. Definition, key trends, growth factors, and opportunities
6.3.2. Market size analysis, by region, 2022-2032
6.3.3. Market share analysis, by country, 2022-2032
6.4. Smart Phone/Tablet Games
6.4.1. Definition, key trends, growth factors, and opportunities
6.4.2. Market size analysis, by region, 2022-2032
6.4.3. Market share analysis, by country, 2022-2032
6.5. Research Dive Exclusive Insights
6.5.1. Market attractiveness
6.5.2. Competition heatmap
7. Gaming Software Market, by Region
7.1. North America
7.1.1. U.S.
7.1.1.1. Market size analysis, by Purchase Type, 2022-2032
7.1.1.2. Market size analysis, by Type, 2022-2032
7.1.2. Canada
7.1.2.1. Market size analysis, by Purchase Type, 2022-2032
7.1.2.2. Market size analysis, by Type, 2022-2032
7.1.3. Mexico
7.1.3.1. Market size analysis, by Purchase Type, 2022-2032
7.1.3.2. Market size analysis, by Type, 2022-2032
7.1.4. Research Dive Exclusive Insights
7.1.4.1. Market attractiveness
7.1.4.2. Competition heatmap
7.2. Europe
7.2.1. Germany
7.2.1.1. Market size analysis, by Purchase Type, 2022-2032
7.2.1.2. Market size analysis, by Type, 2022-2032
7.2.2. UK
7.2.2.1. Market size analysis, by Purchase Type, 2022-2032
7.2.2.2. Market size analysis, by Type, 2022-2032
7.2.3. France
7.2.3.1. Market size analysis, by Purchase Type, 2022-2032
7.2.3.2. Market size analysis, by Type, 2022-2032
7.2.4. Spain
7.2.4.1. Market size analysis, by Purchase Type, 2022-2032
7.2.4.2. Market size analysis, by Type, 2022-2032
7.2.5. Italy
7.2.5.1. Market size analysis, by Purchase Type, 2022-2032
7.2.5.2. Market size analysis, by Type, 2022-2032
7.2.6. Rest of Europe
7.2.6.1. Market size analysis, by Purchase Type, 2022-2032
7.2.6.2. Market size analysis, by Type, 2022-2032
7.2.7. Research Dive Exclusive Insights
7.2.7.1. Market attractiveness
7.2.7.2. Competition heatmap
7.3. Asia-Pacific
7.3.1. China
7.3.1.1. Market size analysis, by Purchase Type, 2022-2032
7.3.1.2. Market size analysis, by Type, 2022-2032
7.3.2. Japan
7.3.2.1. Market size analysis, by Purchase Type, 2022-2032
7.3.2.2. Market size analysis, by Type, 2022-2032
7.3.3. India
7.3.3.1. Market size analysis, by Purchase Type, 2022-2032
7.3.3.2. Market size analysis, by Type, 2022-2032
7.3.4. Australia
7.3.4.1. Market size analysis, by Purchase Type, 2022-2032
7.3.4.2. Market size analysis, by Type, 2022-2032
7.3.5. South Korea
7.3.5.1. Market size analysis, by Purchase Type, 2022-2032
7.3.5.2. Market size analysis, by Type, 2022-2032
7.3.6. Rest of Asia-Pacific
7.3.6.1. Market size analysis, by Purchase Type, 2022-2032
7.3.6.2. Market size analysis, by Type, 2022-2032
7.3.7. Research Dive Exclusive Insights
7.3.7.1. Market attractiveness
7.3.7.2. Competition heatmap
7.4. LAMEA
7.4.1. Brazil
7.4.1.1. Market size analysis, by Purchase Type, 2022-2032
7.4.1.2. Market size analysis, by Type, 2022-2032
7.4.2. Saudi Arabia
7.4.2.1. Market size analysis, by Purchase Type, 2022-2032
7.4.2.2. Market size analysis, by Type, 2022-2032
7.4.3. UAE
7.4.3.1. Market size analysis, by Purchase Type, 2022-2032
7.4.3.2. Market size analysis, by Type, 2022-2032
7.4.4. South Africa
7.4.4.1. Market size analysis, by Purchase Type, 2022-2032
7.4.4.2. Market size analysis, by Type, 2022-2032
7.4.5. Rest of LAMEA
7.4.5.1. Market size analysis, by Purchase Type, 2022-2032
7.4.5.2. Market size analysis, by Type, 2022-2032
7.4.6. Research Dive Exclusive Insights
7.4.6.1. Market attractiveness
7.4.6.2. Competition heatmap
8. Competitive Landscape
8.1. Top winning strategies, 2022
8.1.1. By strategy
8.1.2. By year
8.2. Strategic overview
8.3. Market share analysis, 2022
9. Company Profiles
9.1. Sony Corporation
9.1.1. Overview
9.1.2. Business segments
9.1.3. Product portfolio
9.1.4. Financial performance
9.1.5. Recent developments
9.1.6. SWOT analysis
9.2. Valve Corporation
9.2.1. Overview
9.2.2. Business segments
9.2.3. Product portfolio
9.2.4. Financial performance
9.2.5. Recent developments
9.2.6. SWOT analysis
9.3. Ubisoft Entertainment S.A.
9.3.1. Overview
9.3.2. Business segments
9.3.3. Product portfolio
9.3.4. Financial performance
9.3.5. Recent developments
9.3.6. SWOT analysis
9.4. Rockstar Games Inc.
9.4.1. Overview
9.4.2. Business segments
9.4.3. Product portfolio
9.4.4. Financial performance
9.4.5. Recent developments
9.4.6. SWOT analysis
9.5. Nintendo Co., Ltd.
9.5.1. Overview
9.5.2. Business segments
9.5.3. Product portfolio
9.5.4. Financial performance
9.5.5. Recent developments
9.5.6. SWOT analysis
9.6. Nexon Co, Ltd.
9.6.1. Overview
9.6.2. Business segments
9.6.3. Product portfolio
9.6.4. Financial performance
9.6.5. Recent developments
9.6.6. SWOT analysis
9.7. Gameloft
9.7.1. Overview
9.7.2. Business segments
9.7.3. Product portfolio
9.7.4. Financial performance
9.7.5. Recent developments
9.7.6. SWOT analysis
9.8. Microsoft Corporation
9.8.1. Overview
9.8.2. Business segments
9.8.3. Product portfolio
9.8.4. Financial performance
9.8.5. Recent developments
9.8.6. SWOT analysis
9.9. Nvidia Computer Game Company
9.9.1. Overview
9.9.2. Business segments
9.9.3. Product portfolio
9.9.4. Financial performance
9.9.5. Recent developments
9.9.6. SWOT analysis
9.10. Electronic Arts Inc.
9.10.1. Overview
9.10.2. Business segments
9.10.3. Product portfolio
9.10.4. Financial performance
9.10.5. Recent developments
9.10.6. SWOT analysis
Personalize this research
- Triangulate with your own data
- Request your format and definition
- Get a deeper dive on a specific application, geography, customer or competitor
- + 1-888-961-4454 Toll - Free
- support@researchdive.com
