Global PERC Solar Panel Market Report
RA08759
Global PERC Solar Panel Market by Type (Mono-crystalline and Polycrystalline), Application (Residential, Commercial, and Utility), Mounting (Roof-top, and Ground-mounted), Installation (On-grid, Off-grid, and Hybrid), and Region (North America, Europe, Asia-Pacific, and LAMEA): Opportunity Analysis and Industry Forecast, 2023-2032
PERC Solar Panel Overview
The design of passivation emitter and rear contact (PERC) solar cells involves adding an additional layer to the rear side of the cell, known as the passivation layer. This layer helps to reduce electron recombination, which is the loss of electrons before they can be extracted as electrical energy. By minimizing recombination, PERC cells can achieve higher levels of efficiency. The passivation layer on the rear side of the PERC solar cell allows for better reflection and absorption of sunlight, resulting in increased current and improved overall performance. Another way to increase cell efficiency is to decrease the surface recombination at the rear of the cell. The passivated emitter and rear contact cell reduce recombination at the rear by placing a patterned dielectric layer between the silicon and the aluminum, such that the aluminum only comes into contact with a small fraction of the cell area. This technology enables the cell to capture more photons and convert them into usable electricity. Furthermore, the accelerated efficiency of PERC solar panels makes them a favorable choice for residential, commercial, and utility-scale solar installations. They offer higher power output and can generate extra electricity from the same surface area compared to traditional solar panels.
Global PERC Solar Panel Market Analysis
The global PERC solar panel market size was $140,345.60 million in 2022 and is predicted to grow with a CAGR of 8.2%, by generating a revenue of $304,871.40 million by 2032.

Source: Research Dive Analysis
COVID-19 Impact on Global PERC Solar Panel Market
The COVID-19 pandemic had a negative impact on the solar industry. The global pandemic led to disruptions in supply chains, affecting the availability of raw materials and components required for solar panel manufacturing. PERC solar panel manufacturers faced challenges in sourcing these materials, impacting their production capabilities and overall market supply. Moreover, economic uncertainties and lockdown measures imposed by many countries resulted in reduced demand for solar panels, including PERC panels. Installation projects were delayed or canceled, which affected the market growth and adoption of PERC technology.
Many governments have introduced economic stimulus packages and renewable energy incentives to aid post-pandemic recovery. These initiatives are expected to positively influence the solar industry, including the PERC solar panel market, by encouraging installations and supporting the demand for solar energy. In the post-pandemic period, PERC solar panels are experiencing rapid growth and adoption due to their enhanced efficiency compared to traditional solar panels. Factors such as technological advancements, declining costs, and increasing demand for renewable energy are driving the growth of PERC solar panels. They are becoming increasingly popular in both residential and commercial solar installations, contributing to the expansion of the global PERC solar panel market.
Growing Demand for Cost-Effective Solar Panels and Energy Efficiency Improvement to Drive the Market Growth
PERC solar panels offer higher energy conversion efficiency compared to traditional solar cells. Higher efficiency in solar panels means that more electricity can be generated from the same surface area. This converts into a higher return on investment for solar power system owners. By increasing the energy conversion efficiency, PERC panels can generate more electricity per unit area also making them more cost-effective over the long term. Moreover, PERC solar panels have demonstrated improved performance in low-light conditions compared to traditional solar cells. This feature makes them particularly suitable for regions with variable weather patterns or locations where sunlight availability is limited. The higher efficiency of PERC panels ensures that electricity generation remains relatively stable even under suboptimal lighting conditions. In urban environments or areas with limited space for solar installations, achieving higher efficiency is crucial. PERC panels offer a means to generate more electricity from a smaller footprint, allowing for greater flexibility in system design. This advantage makes PERC technology attractive for residential, commercial, and industrial applications where space is limited. Furthermore, continuous advancements in materials, manufacturing processes, and design techniques contribute to efficiency improvements in PERC solar panels. As R&D efforts focus on enhancing the performance of PERC cells, the overall efficiency of these panels is expected to increase further driving their adoption in the market. In addition, government policies and incentives aimed at promoting renewable energy adoption often prioritize higher-efficiency solar panels. By providing financial incentives or regulatory requirements for using more efficient technologies, governments can encourage the adoption of PERC panels and other high-efficiency solar technologies.
To know more about global PERC solar panel market drivers, get in touch with our analysts here.
High Cost of Solar Panels to Restrain the Market Growth
PERC solar panels involve additional manufacturing steps compared to conventional solar panels. The rear surface of PERC cells requires additional passivation layers and rear contacts, which adds complexity to the production process. This complexity can lead to higher manufacturing costs. The passivation layer and rear contact materials used in PERC cells can be more expensive compared to the materials used in conventional solar panels. For example, the use of higher-quality silicon nitride for passivation or silver paste for rear contacts can increase the overall material costs. PERC technology has gained significant traction in the solar industry but has not yet reached the same economies of scale as conventional solar panel technologies. Higher production volumes of conventional panels lead to cost reductions through economies of scale, making them more cost-effective. Price-sensitive markets, where cost is a critical factor, may present a challenge for PERC solar panels. In such markets, the relatively higher manufacturing costs of PERC panels compared to conventional panels can put them at a disadvantage. Customers in these markets may prioritize lower upfront costs over the potential long-term benefits of PERC technology, which is anticipated to hamper the PERC solar panel market growth.
Technological Advancements to Drive Excellent Opportunities
PERC solar panel companies can leverage new technologies including improved cell and module designs, advanced materials, and enhanced manufacturing techniques. Advancements in materials can play a significant role in improving the performance of PERC solar panels. Researchers are investigating novel materials for passivation layers, anti-reflection coatings, and contacts that can enhance the overall efficiency and durability of PERC cells. These materials can offer better light management, reduced optical losses, and improved long-term stability. Moreover, innovations in manufacturing processes can contribute to increased production efficiency for PERC solar panels. Improved printing and deposition techniques, such as screen printing, inkjet printing, and atomic layer deposition (ALD), can enable precise control over layer thickness and composition, resulting in higher-quality cells. Advanced manufacturing technologies can also enhance scalability and reduce production costs, making PERC panels more commercially viable. Researchers are continually exploring new designs to enhance the efficiency of PERC solar cells. This includes optimizing the passivation layers, emitter design, and rear surface structure to minimize recombination losses and increase light absorption. By improving the design of PERC cells, higher conversion efficiencies can be achieved, leading to more efficient solar panels. This can make PERC panels more competitive with other solar technologies and further drive excellent opportunities for market growth.
To know more about global PERC solar panel market opportunities, get in touch with our analysts here.
Global PERC Solar Panel Market Share, by Type, 2022

Source: Research Dive Analysis
The mono-crystalline sub-segment accounted for the highest market share in 2022. Mono-crystalline PERC solar panels are known for their higher efficiency compared to other solar panel technologies. The passivated emitter rear contact (PERC) design allows for improved light absorption and reduced electron recombination, resulting in higher energy conversion rates. The higher efficiency of mono-crystalline PERC panels makes them attractive for installations where space is limited or where higher energy output is desired. Moreover, the manufacturing costs of mono-crystalline PERC solar panels have been decreasing. Advances in production techniques, economies of scale, and technological advancements have led to cost reductions in the production of mono-crystalline PERC panels. Therefore, the cost per watt of mono-crystalline PERC panels has become more competitive, making them an economically viable choice for solar installations. Furthermore, rising awareness about the need for clean and sustainable energy sources has led to a rise in environmental consciousness. Solar power including mono-crystalline PERC panels is considered a clean and renewable energy source that helps reduce greenhouse gas emissions and dependence on fossil fuels. This increasing environmental concern has created a demand for solar energy solutions and positively influenced the adoption of mono-crystalline PERC panels.
Global PERC Solar Panel Market Share, by Application, 2022
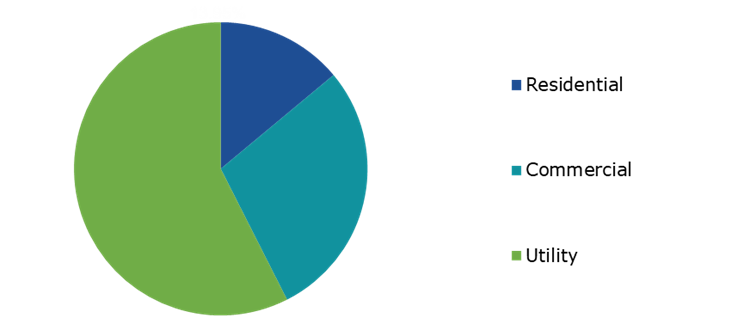
Source: Research Dive Analysis
The utility sub-segment accounted for the highest market share in 2022. PERC solar panels offer higher conversion efficiency compared to traditional solar cell technologies. By incorporating a passivated emitter and rear cell design, PERC panels reduce recombination losses, resulting in increased energy generation. This higher efficiency makes PERC panels an attractive choice for utility-scale solar projects, where maximizing power output is crucial. Moreover, the manufacturing costs of PERC solar panels have significantly decreased. The initial investment in PERC technology may be higher than conventional solar panels, but the improved efficiency and energy output justify the cost. Moreover, as economies of scale kick in and production processes become more streamlined, the cost of PERC panels is expected to continue to decrease, making them more competitive in the utility segment. Furthermore, PERC solar panels are known for their enhanced reliability and durability. The passivation layer on the rear side of the cell reduces the chance of degradation, such as light-induced degradation (LID) and potential-induced degradation (PID). This improved performance over the long term makes PERC panels a reliable choice for utility-scale solar installations that have a lifespan of several decades.
Global PERC Solar Panel Market Share, by Mounting, 2022

Source: Research Dive Analysis
The ground-mounted sub-segment accounted for the highest market share in 2022. Ground-mounted solar installations are often more cost-effective compared to rooftop installations. The economies of scale associated with larger ground-mounted projects result in lower installation and maintenance costs per watt of installed capacity. This cost advantage makes ground-mounted solar panels attractive for utility-scale projects and large commercial installations. Moreover, ground-mounted solar panels require ample space, which is often available in open areas such as fields, deserts, or unused land. Unlike rooftop installations, ground-mounted systems are not constrained by the size and orientation of a building. This abundant space enables the installation of larger solar arrays and allows for higher capacity and energy generation potential. Furthermore, ground-mounted solar installations can accommodate a higher number of solar panels compared to rooftop installations. This increased capacity is particularly advantageous for utility-scale projects where a large amount of electricity generation is required. Ground-mounted systems can be designed with thousands of panels leading to significant energy production and contributing to the overall renewable energy mix.
Global PERC Solar Panel Market Share, by Installation, 2022

Source: Research Dive Analysis
The on-grid sub-segment accounted for the highest market share in 2022. On-grid solar installations are connected to the utility grid allowing for a reliable and stable power supply. Unlike off-grid systems that rely on battery storage, on-grid systems can feed excess electricity back into the grid, reducing the need for extensive energy storage solutions. This grid connectivity provides reliability and eliminates concerns about energy availability, making on-grid PERC solar panels a preferred choice for many residential, commercial, and industrial customers. Moreover, many governments around the world have introduced favorable policies and incentives to promote the adoption of solar energy. These policies include feed-in tariffs, tax credits, and subsidies, which encourage the installation of solar panels and their connection to the grid. Such incentives make on-grid solar systems more financially attractive to consumers, growing the demand for PERC solar panels in the on-grid segment.
Global PERC Solar Panel Market Size & Forecast, by Region, 2022-2032 ($Million)
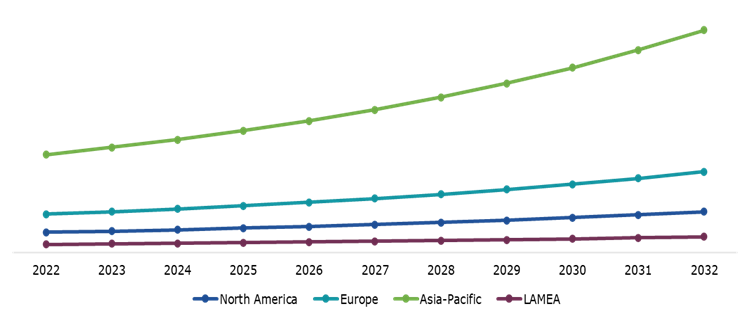
Source: Research Dive Analysis
The Asia-Pacific PERC solar panel market generated the highest revenue in 2022. Asia-Pacific has witnessed a significant increase in the demand for renewable energy sources, driven by the need to reduce carbon emissions and dependence on fossil fuels. Therefore, governments and businesses are actively promoting solar energy, creating a favorable market for PERC solar panels. Moreover, many countries in the region have implemented supportive policies and incentives to encourage the adoption of solar energy. These policies include feed-in tariffs, tax credits, and subsidies for solar installations. Such measures make PERC solar panels more attractive to consumers and businesses. The cost of manufacturing PERC solar panels has decreased significantly. This cost reduction is due to advancements in production technologies, economies of scale, and increased competition in the solar industry. As the cost of PERC solar panels becomes more competitive with traditional solar panels, the demand for PERC technology in Asia-Pacific is expected to increase.
Competitive Scenario in the Global PERC Solar Panel Market
Investment and agreement are common strategies followed by major market players. in June 2023, Solarge, a Dutch solar manufacturer, launched two lightweight mono-PERC solar panel variations designed exclusively for rooftop applications. These modules have high-performance capabilities with power outputs ranging from 470 W to 520 W. These solar panels convert sunshine into usable electrical energy at an amazing rate, with efficiencies ranging from 17.4% to 19.2%.

Source: Research Dive Analysis
Some of the leading PERC solar panel market players are Sunnova Energy International, Inc., Jinko Solar, Canadian Solar, SolarEdge, First Solar, Inc., Trina Solar, JA Solar Holdings Co. Ltd., SunPower Corporation, Wuxi Suntech Power Co., Ltd., and REC Solar Holdings AS.
| Aspect | Particulars |
| Historical Market Estimations | 2020-2021 |
| Base Year for Market Estimation | 2022 |
| Forecast Timeline for Market Projection | 2023-2032 |
| Geographical Scope | North America, Europe, Asia-Pacific, and LAMEA |
| Segmentation by Type |
|
| Segmentation by Application |
|
|
Segmentation by Mounting
|
|
| Segmentation by Installation |
|
| Key Companies Profiled |
|
Q1. What is the size of the global PERC solar panel market?
A. The size of the global PERC solar panel market was over $140,345.60 million in 2022 and is projected to reach $304,871.40 million by 2032.
Q2. Which are the major companies in the PERC solar panel market?
A. Sunnova Energy International, Inc., Jinko Solar, and Canadian Solar are some of the key players in the global PERC solar panel market.
Q3. Which region, among others, possesses greater investment opportunities in the future?
A. Asia-Pacific possesses great investment opportunities for investors in the future.
Q4. What will be the growth rate of the Asia-Pacific PERC solar panel market?
A. Asia-Pacific PERC solar panel market is anticipated to grow at 8.7% CAGR during the forecast period.
Q5. What are the strategies opted by the leading players in this market?
A. Agreement and investment are the two key strategies opted by the operating companies in this market.
Q6. Which companies are investing more on R&D practices?
A. Solar Edge, First Solar, Inc., and Trina Solar are the companies investing more on R&D activities for developing new products and technologies.
1.Research Methodology
1.1.Desk Research
1.2.Real time insights and validation
1.3.Forecast model
1.4.Assumptions and forecast parameters
1.5.Market size estimation
1.5.1.Top-down approach
1.5.2.Bottom-up approach
2.Report Scope
2.1.Market definition
2.2.Key objectives of the study
2.3.Report overview
2.4.Market segmentation
2.5.Overview of the impact of COVID-19 on Global PERC solar panel market
3.Executive Summary
4.Market Overview
4.1.Introduction
4.2.Growth impact forces
4.2.1.Drivers
4.2.2.Restraints
4.2.3.Opportunities
4.3.Market value chain analysis
4.3.1.List of raw material suppliers
4.3.2.List of manufacturers
4.3.3.List of distributors
4.4.Innovation & sustainability matrices
4.4.1.Technology matrix
4.4.2.Regulatory matrix
4.5.Porter’s five forces analysis
4.5.1.Bargaining power of suppliers
4.5.2.Bargaining power of consumers
4.5.3.Threat of substitutes
4.5.4.Threat of new entrants
4.5.5.Competitive rivalry intensity
4.6.PESTLE analysis
4.6.1.Political
4.6.2.Economical
4.6.3.Social
4.6.4.Technological
4.6.5.Environmental
4.7.Impact of COVID-19 on PERC solar panel market
4.7.1.Pre-covid market scenario
4.7.2.Post-covid market scenario
5.PERC Solar Panel Market Analysis, by Type
5.1.Overview
5.2.Mono-crystalline
5.2.1.Definition, key trends, growth factors, and opportunities
5.2.2.Market size analysis, by region, 2022-2032
5.2.3.Market share analysis, by country, 2022-2032
5.3.Polycrystalline
5.3.1.Definition, key trends, growth factors, and opportunities
5.3.2.Market size analysis, by region, 2022-2032
5.3.3.Market share analysis, by country, 2022-2032
5.4.Research Dive Exclusive Insights
5.4.1.Market attractiveness
5.4.2.Competition heatmap
6.PERC Solar Panel Market Analysis, by Application
6.1.Residential
6.1.1.Definition, key trends, growth factors, and opportunities
6.1.2.Market size analysis, by region, 2022-2032
6.1.3.Market share analysis, by country, 2022-2032
6.2.Commercial
6.2.1.Definition, key trends, growth factors, and opportunities
6.2.2.Market size analysis, by region, 2022-2032
6.2.3.Market share analysis, by country, 2022-2032
6.3.Utility
6.3.1.Definition, key trends, growth factors, and opportunities
6.3.2.Market size analysis, by region, 2022-2032
6.3.3.Market share analysis, by country, 2022-2032
6.4.Research Dive Exclusive Insights
6.4.1.Market attractiveness
6.4.2.Competition heatmap
7.PERC Solar Panel Market Analysis, by Mounting
7.1.Roof-top
7.1.1.Definition, key trends, growth factors, and opportunities
7.1.2.Market size analysis, by region, 2022-2032
7.1.3.Market share analysis, by country, 2022-2032
7.2.Ground-mounted
7.2.1.Definition, key trends, growth factors, and opportunities
7.2.2.Market size analysis, by region, 2022-2032
7.2.3.Market share analysis, by country, 2022-2032
7.3.Research Dive Exclusive Insights
7.3.1.Market attractiveness
7.3.2.Competition heatmap
8.PERC Solar Panel Market Analysis, by Installation
8.1.On-grid
8.1.1.Definition, key trends, growth factors, and opportunities
8.1.2.Market size analysis, by region, 2022-2032
8.1.3.Market share analysis, by country, 2022-2032
8.2.Off-grid
8.2.1.Definition, key trends, growth factors, and opportunities
8.2.2.Market size analysis, by region, 2022-2032
8.2.3.Market share analysis, by country, 2022-2032
8.3.Hybrid
8.3.1.Definition, key trends, growth factors, and opportunities
8.3.2.Market size analysis, by region, 2022-2032
8.3.3.Market share analysis, by country, 2022-2032
8.4.Research Dive Exclusive Insights
8.4.1.Market attractiveness
8.4.2.Competition heatmap
9.PERC Solar Panel Market, by Region
9.1.North America
9.1.1.U.S.
9.1.1.1.Market size analysis, by Type, 2022-2032
9.1.1.2.Market size analysis, by Application, 2022-2032
9.1.1.3.Market size analysis, by Mounting, 2022-2032
9.1.1.4.Market size analysis, by Installation, 2022-2032
9.1.2.Canada
9.1.2.1.Market size analysis, by Type, 2022-2032
9.1.2.2.Market size analysis, by Application, 2022-2032
9.1.2.3.Market size analysis, by Mounting, 2022-2032
9.1.2.4.Market size analysis, by Installation, 2022-2032
9.1.3.Mexico
9.1.3.1.Market size analysis, by Type, 2022-2032
9.1.3.2.Market size analysis, by Application, 2022-2032
9.1.3.3.Market size analysis, by Mounting, 2022-2032
9.1.3.4.Market size analysis, by Installation, 2022-2032
9.1.4.Research Dive Exclusive Insights
9.1.4.1.Market attractiveness
9.1.4.2.Competition heatmap
9.2.Europe
9.2.1.Germany
9.2.1.1.Market size analysis, by Type, 2022-2032
9.2.1.2.Market size analysis, by Application, 2022-2032
9.2.1.3.Market size analysis, by Mounting, 2022-2032
9.2.1.4.Market size analysis, by Installation, 2022-2032
9.2.2.UK
9.2.2.1.Market size analysis, by Type, 2022-2032
9.2.2.2.Market size analysis, by Application, 2022-2032
9.2.2.3.Market size analysis, by Mounting, 2022-2032
9.2.2.4.Market size analysis, by Installation, 2022-2032
9.2.3.France
9.2.3.1.Market size analysis, by Type, 2022-2032
9.2.3.2.Market size analysis, by Application, 2022-2032
9.2.3.3.Market size analysis, by Mounting, 2022-2032
9.2.3.4.Market size analysis, by Installation, 2022-2032
9.2.4.Spain
9.2.4.1.Market size analysis, by Type, 2022-2032
9.2.4.2.Market size analysis, by Application, 2022-2032
9.2.4.3.Market size analysis, by Mounting, 2022-2032
9.2.4.4.Market size analysis, by Installation, 2022-2032
9.2.5.Italy
9.2.5.1.Market size analysis, by Type, 2022-2032
9.2.5.2.Market size analysis, by Application, 2022-2032
9.2.5.3.Market size analysis, by Mounting, 2022-2032
9.2.5.4.Market size analysis, by Installation, 2022-2032
9.2.6.Rest of Europe
9.2.6.1.Market size analysis, by Type, 2022-2032
9.2.6.2.Market size analysis, by Application, 2022-2032
9.2.6.3.Market size analysis, by Mounting, 2022-2032
9.2.6.4.Market size analysis, by Installation, 2022-2032
9.2.7.Research Dive Exclusive Insights
9.2.7.1.Market attractiveness
9.2.7.2.Competition heatmap
9.3.Asia-Pacific
9.3.1.China
9.3.1.1.Market size analysis, by Type, 2022-2032
9.3.1.2.Market size analysis, by Application, 2022-2032
9.3.1.3.Market size analysis, by Mounting, 2022-2032
9.3.1.4.Market size analysis, by Installation, 2022-2032
9.3.2.Japan
9.3.2.1.Market size analysis, by Type, 2022-2032
9.3.2.2.Market size analysis, by Application, 2022-2032
9.3.2.3.Market size analysis, by Mounting, 2022-2032
9.3.2.4.Market size analysis, by Installation, 2022-2032
9.3.3.India
9.3.3.1.Market size analysis, by Type, 2022-2032
9.3.3.2.Market size analysis, by Application, 2022-2032
9.3.3.3.Market size analysis, by Mounting, 2022-2032
9.3.3.4.Market size analysis, by Installation, 2022-2032
9.3.4.Australia
9.3.4.1.Market size analysis, by Type, 2022-2032
9.3.4.2.Market size analysis, by Application, 2022-2032
9.3.4.3.Market size analysis, by Mounting, 2022-2032
9.3.4.4.Market size analysis, by Installation, 2022-2032
9.3.5.South Korea
9.3.5.1.Market size analysis, by Type, 2022-2032
9.3.5.2.Market size analysis, by Application, 2022-2032
9.3.5.3.Market size analysis, by Mounting, 2022-2032
9.3.5.4.Market size analysis, by Installation, 2022-2032
9.3.6.Rest of Asia-Pacific
9.3.6.1.Market size analysis, by Type, 2022-2032
9.3.6.2.Market size analysis, by Application, 2022-2032
9.3.6.3.Market size analysis, by Mounting, 2022-2032
9.3.6.4.Market size analysis, by Installation, 2022-2032
9.3.7.Research Dive Exclusive Insights
9.3.7.1.Market attractiveness
9.3.7.2.Competition heatmap
9.4.LAMEA
9.4.1.Brazil
9.4.1.1.Market size analysis, by Type, 2022-2032
9.4.1.2.Market size analysis, by Application, 2022-2032
9.4.1.3.Market size analysis, by Mounting, 2022-2032
9.4.1.4.Market size analysis, by Installation, 2022-2032
9.4.2.Saudi Arabia
9.4.2.1.Market size analysis, by Type, 2022-2032
9.4.2.2.Market size analysis, by Application, 2022-2032
9.4.2.3.Market size analysis, by Mounting, 2022-2032
9.4.2.4.Market size analysis, by Installation, 2022-2032
9.4.3.UAE
9.4.3.1.Market size analysis, by Type, 2022-2032
9.4.3.2.Market size analysis, by Application, 2022-2032
9.4.3.3.Market size analysis, by Mounting, 2022-2032
9.4.3.4.Market size analysis, by Installation, 2022-2032
9.4.4.South Africa
9.4.4.1.Market size analysis, by Type, 2022-2032
9.4.4.2.Market size analysis, by Application, 2022-2032
9.4.4.3.Market size analysis, by Mounting, 2022-2032
9.4.4.4.Market size analysis, by Installation, 2022-2032
9.4.5.Rest of LAMEA
9.4.5.1.Market size analysis, by Type, 2022-2032
9.4.5.2.Market size analysis, by Application, 2022-2032
9.4.5.3.Market size analysis, by Mounting, 2022-2032
9.4.5.4.Market size analysis, by Installation, 2022-2032
9.4.6.Research Dive Exclusive Insights
9.4.6.1.Market attractiveness
9.4.6.2.Competition heatmap
10.Competitive Landscape
10.1.Top winning strategies, 2022
10.1.1.By strategy
10.1.2.By year
10.2.Strategic overview
10.3.Market share analysis, 2022
11.Company Profiles
11.1.Sunnova Energy International, Inc.
11.1.1.Overview
11.1.2.Business segments
11.1.3.Product portfolio
11.1.4.Financial performance
11.1.5.Recent developments
11.1.6.SWOT analysis
11.2.Jinko Solar
11.2.1.Overview
11.2.2.Business segments
11.2.3.Product portfolio
11.2.4.Financial performance
11.2.5.Recent developments
11.2.6.SWOT analysis
11.3.Canadian Solar
11.3.1.Overview
11.3.2.Business segments
11.3.3.Product portfolio
11.3.4.Financial performance
11.3.5.Recent developments
11.3.6.SWOT analysis
11.4.SolarEdge
11.4.1.Overview
11.4.2.Business segments
11.4.3.Product portfolio
11.4.4.Financial performance
11.4.5.Recent developments
11.4.6.SWOT analysis
11.5.First Solar, Inc.
11.5.1.Overview
11.5.2.Business segments
11.5.3.Product portfolio
11.5.4.Financial performance
11.5.5.Recent developments
11.5.6.SWOT analysis
11.6.Trina Solar
11.6.1.Overview
11.6.2.Business segments
11.6.3.Product portfolio
11.6.4.Financial performance
11.6.5.Recent developments
11.6.6.SWOT analysis
11.7.JA Solar Holdings Co. Ltd.
11.7.1.Overview
11.7.2.Business segments
11.7.3.Product portfolio
11.7.4.Financial performance
11.7.5.Recent developments
11.7.6.SWOT analysis
11.8.SunPower Corporation
11.8.1.Overview
11.8.2.Business segments
11.8.3.Product portfolio
11.8.4.Financial performance
11.8.5.Recent developments
11.8.6.SWOT analysis
11.9.Wuxi Suntech Power Co., Ltd.
11.9.1.Overview
11.9.2.Business segments
11.9.3.Product portfolio
11.9.4.Financial performance
11.9.5.Recent developments
11.9.6.SWOT analysis
11.10.REC Solar Holdings AS
11.10.1.Overview
11.10.2.Business segments
11.10.3.Product portfolio
11.10.4.Financial performance
11.10.5.Recent developments
11.10.6.SWOT analysis
Personalize this research
- Triangulate with your own data
- Request your format and definition
- Get a deeper dive on a specific application, geography, customer or competitor
- + 1-888-961-4454 Toll - Free
- support@researchdive.com
