Global Education Computing Devices Market Report
RA08751
Global Education Computing Devices Market by Product (Smartphones, Laptops, Tablets, and Others), End User (Primary, Secondary, and Higher Secondary), and Region (North America, Europe, Asia-Pacific, and LAMEA): Opportunity Analysis and Industry Forecast, 2023-2032
Education Computing Devices Overview
Laptops, computers, and mobile phones have evolved into powerful learning tools in classrooms and outdoors. Over the last two decades, mobile, computers have steadily been brought into educational settings. Most individuals carry their own personal compact computers with remarkable computing capacities, such as laptops, personal digital assistants (PDAs), tablets, personal computers (PCs), smartphones, and e-book readers, due to advances in mobile technology. This high computing power and mobility, combined with wireless connection and context-aware technologies, makes one-to-one computing a powerful learning tool for regular classrooms and outside casual learning.
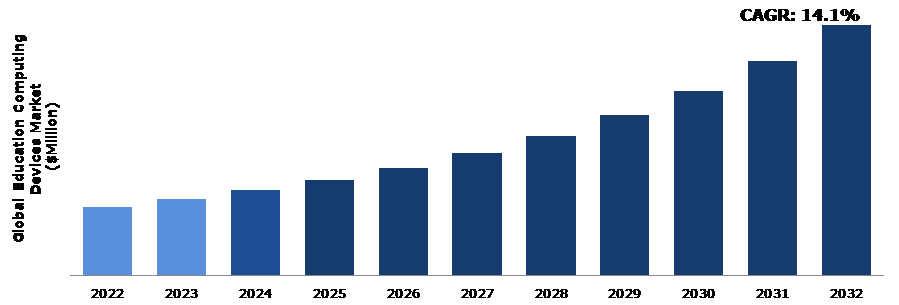
Global Education Computing Devices Market Analysis
The global education computing devices market size was $101,281.30 million in 2022 and is predicted to grow with a CAGR of 14.1%, by generating a revenue of $368,072.50 million by 2032.
Source: Research Dive Analysis
COVID-19 Impact on Global Education Computing Devices Market
The COVID-19 pandemic, as well as the subsequent social distancing restrictions and lockdowns, have had an impact on various aspects of societies, including schooling. However, the education sector appeared to be the most hampered and most affected sector throughout the world. The pandemic caused school closures throughout the world. Therefore, the education sector has undergone a radical transformation, with the distinct emergence of e-learning, in which teaching and learning is carried out remotely and on digital platforms. The COVID-19 pandemic led to closure of schools and educational institutions, resulting in widespread disruption of learning. Students were unable to attend physical classrooms and had to shift to remote learning, which posed challenges in terms of access to resources, technology, and effective teaching methodologies.
COVID-19 impact necessitated a shift to remote learning, and education computing devices played a crucial role in facilitating this transition. In the post-pandemic period, remote learning is likely to continue to some extent, with education computing devices remaining essential tools for accessing online resources, participating in virtual classrooms, and engaging in distance education. The pandemic highlighted the importance of robust technological infrastructure in education. In the post-COVID-19 era, educational institutions and governments are likely to invest in improving Internet connectivity, providing adequate devices, and upgrading network infrastructure to support seamless access to education computing devices.
Rising Adoption of Digital Technologies in the Educational Sector to Drive the Market Growth
Educational institutions are increasingly embracing digital technologies to enhance teaching and learning experiences. This includes the integration of computing devices that provide access to educational content, interactive tools, and online resources. The need to keep up with the digital transformation in the educational sector is a significant driver for the education computing devices market growth. The development and utilization of online learning platforms enable students to access educational materials, resources, and interactive courses remotely. These platforms often incorporate multimedia elements, interactive exercises, and communication tools to facilitate engagement and collaboration. Learning management systems (LMS) facilitate the administration, delivery, and tracking of educational courses and materials. LMS platforms typically include features for content management, communication, grading and assessment, streamlining administrative processes, and enhancing learner engagement. Data analytics and learning analytics leverage student ability to gain insights into learning patterns, identify areas for improvement, and personalize learning experiences. These analytics can inform instructional decisions, curriculum design, and student support interventions.
To know more about global education computing devices market drivers, get in touch with our analysts here.
High Initial Cost to Restrain the Education Computing Devices Market Growth
Education computing devices, such as laptops, tablets, and interactive whiteboards, can be expensive, making them unaffordable for many educational institutions, particularly those with limited budgets. The cost of purchasing and maintaining these devices, along with the required software and infrastructure, can be a significant barrier to adoption. Education computing devices store and process sensitive student data, raising concerns about privacy and security. Educational institutions must prioritize data protection and comply with relevant privacy regulations to ensure the secure handling of student information. Addressing these concerns can pose challenges and require additional investments in cybersecurity measures. These are the major factors anticipated to hamper the market revenue growth in the upcoming years.
Advancements in Technology to Drive Excellent Opportunities
Artificial Intelligence (AI) is all around, swiftly improving the way industries operate, including the education sector. AI, and its subcategories, such as machine learning and deep learning, have the potential to address existing issues. Currently, education institutes are facing issues such as student retention and teacher shortages. Personalized AI assistants can help to overcome the education sector's teacher shortage. Another benefit of such tools is that they can be used for students with special needs. It can design educational approaches that are unique and best suited to the youngster. This can have a significant impact on the student’s development. Students will have a personalized helper, a robot, throughout their school in the future to help them get the finest education possible. Teachers will have AI-powered assistants to assist them in grading homework and revising handbooks. AI will assist in linking classrooms and connecting students all over the world. It will aid in the creation of a comprehensive environment in classrooms. All these factors are anticipated to boost the education computing devices market expansion in the future.
To know more about global education computing devices market opportunities, get in touch with our analysts here.
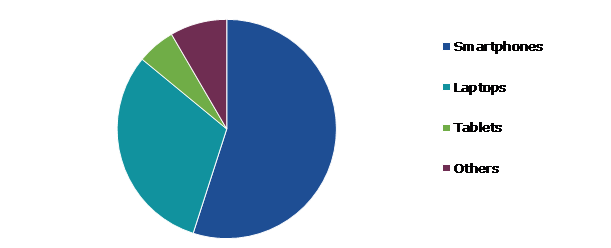
Global Education Computing Devices Market Share, by Product Type, 2022
Source: Research Dive Analysis
The smartphones sub-segment accounted for the highest market share in 2022. Smartphones are widely accessible and portable, making them an ideal device for delivering educational content. They provide students with the flexibility to access learning materials and resources from anywhere at any time, facilitating remote learning, independent study, and on-the-go learning. Smartphones provide opportunities for personalized learning experiences. With various educational apps, adaptive learning platforms, and personalized content recommendations, students can tailor their learning to their individual needs, pace, and learning styles. Smartphones allow for self-paced learning and the ability to revisit and review materials as needed. Smartphones come with built-in productivity tools, such as calendars, reminders, note-taking apps, and task management apps. These tools help students stay organized, manage their assignments, set study schedules, and track progress. Smartphones also enable easy access to cloud storage services, allowing students to store and retrieve their educational materials and assignments.
Global Education Computing Devices Market Size, by End User, 2022

Source: Research Dive Analysis
The higher secondary sub-segment accounted for the highest market share in 2022. The higher secondary segment, which refers to the last two years of secondary education (typically grades 11 and 12 or equivalent), is an important market for education computing devices. Higher secondary education often involves project-based learning and assignments that require students to create presentations, write essays, analyze data, and develop multimedia content. Computing devices equipped with productivity software, word processors, spreadsheets, and presentation tools enable students to complete these tasks efficiently and produce high-quality work. Computing devices play a crucial role in test preparation for higher secondary students. Online practice tests, educational apps, and interactive learning platforms help students review concepts, solve sample questions, and track their progress. In addition, computing devices enable the administration of online assessments, which provide instant feedback and streamline the evaluation process.
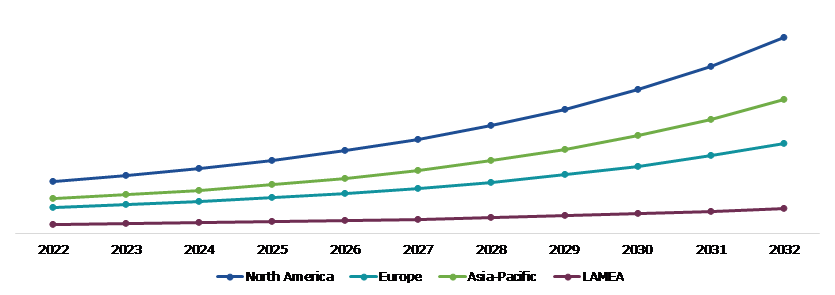
Global Education Computing Devices Market Size & Forecast, by Region, 2022-2032 ($Million)
Source: Research Dive Analysis
The North America education computing devices market generated the highest revenue in 2022. North American educational institutions have been aggressively implementing projects using advance technology, such as 1:1 device programs and digital learning initiatives. This has increased the need for computing equipment in local schools, colleges, and universities. A sizable percentage of the market for educational computing devices in North America is made up of K–12 institutions of higher learning. Numerous schools have adopted a 1:1 device program, where each student is given a computer for educational use, like a laptop or tablet. Therefore, there is now considerable demand for computing devices in the North America market
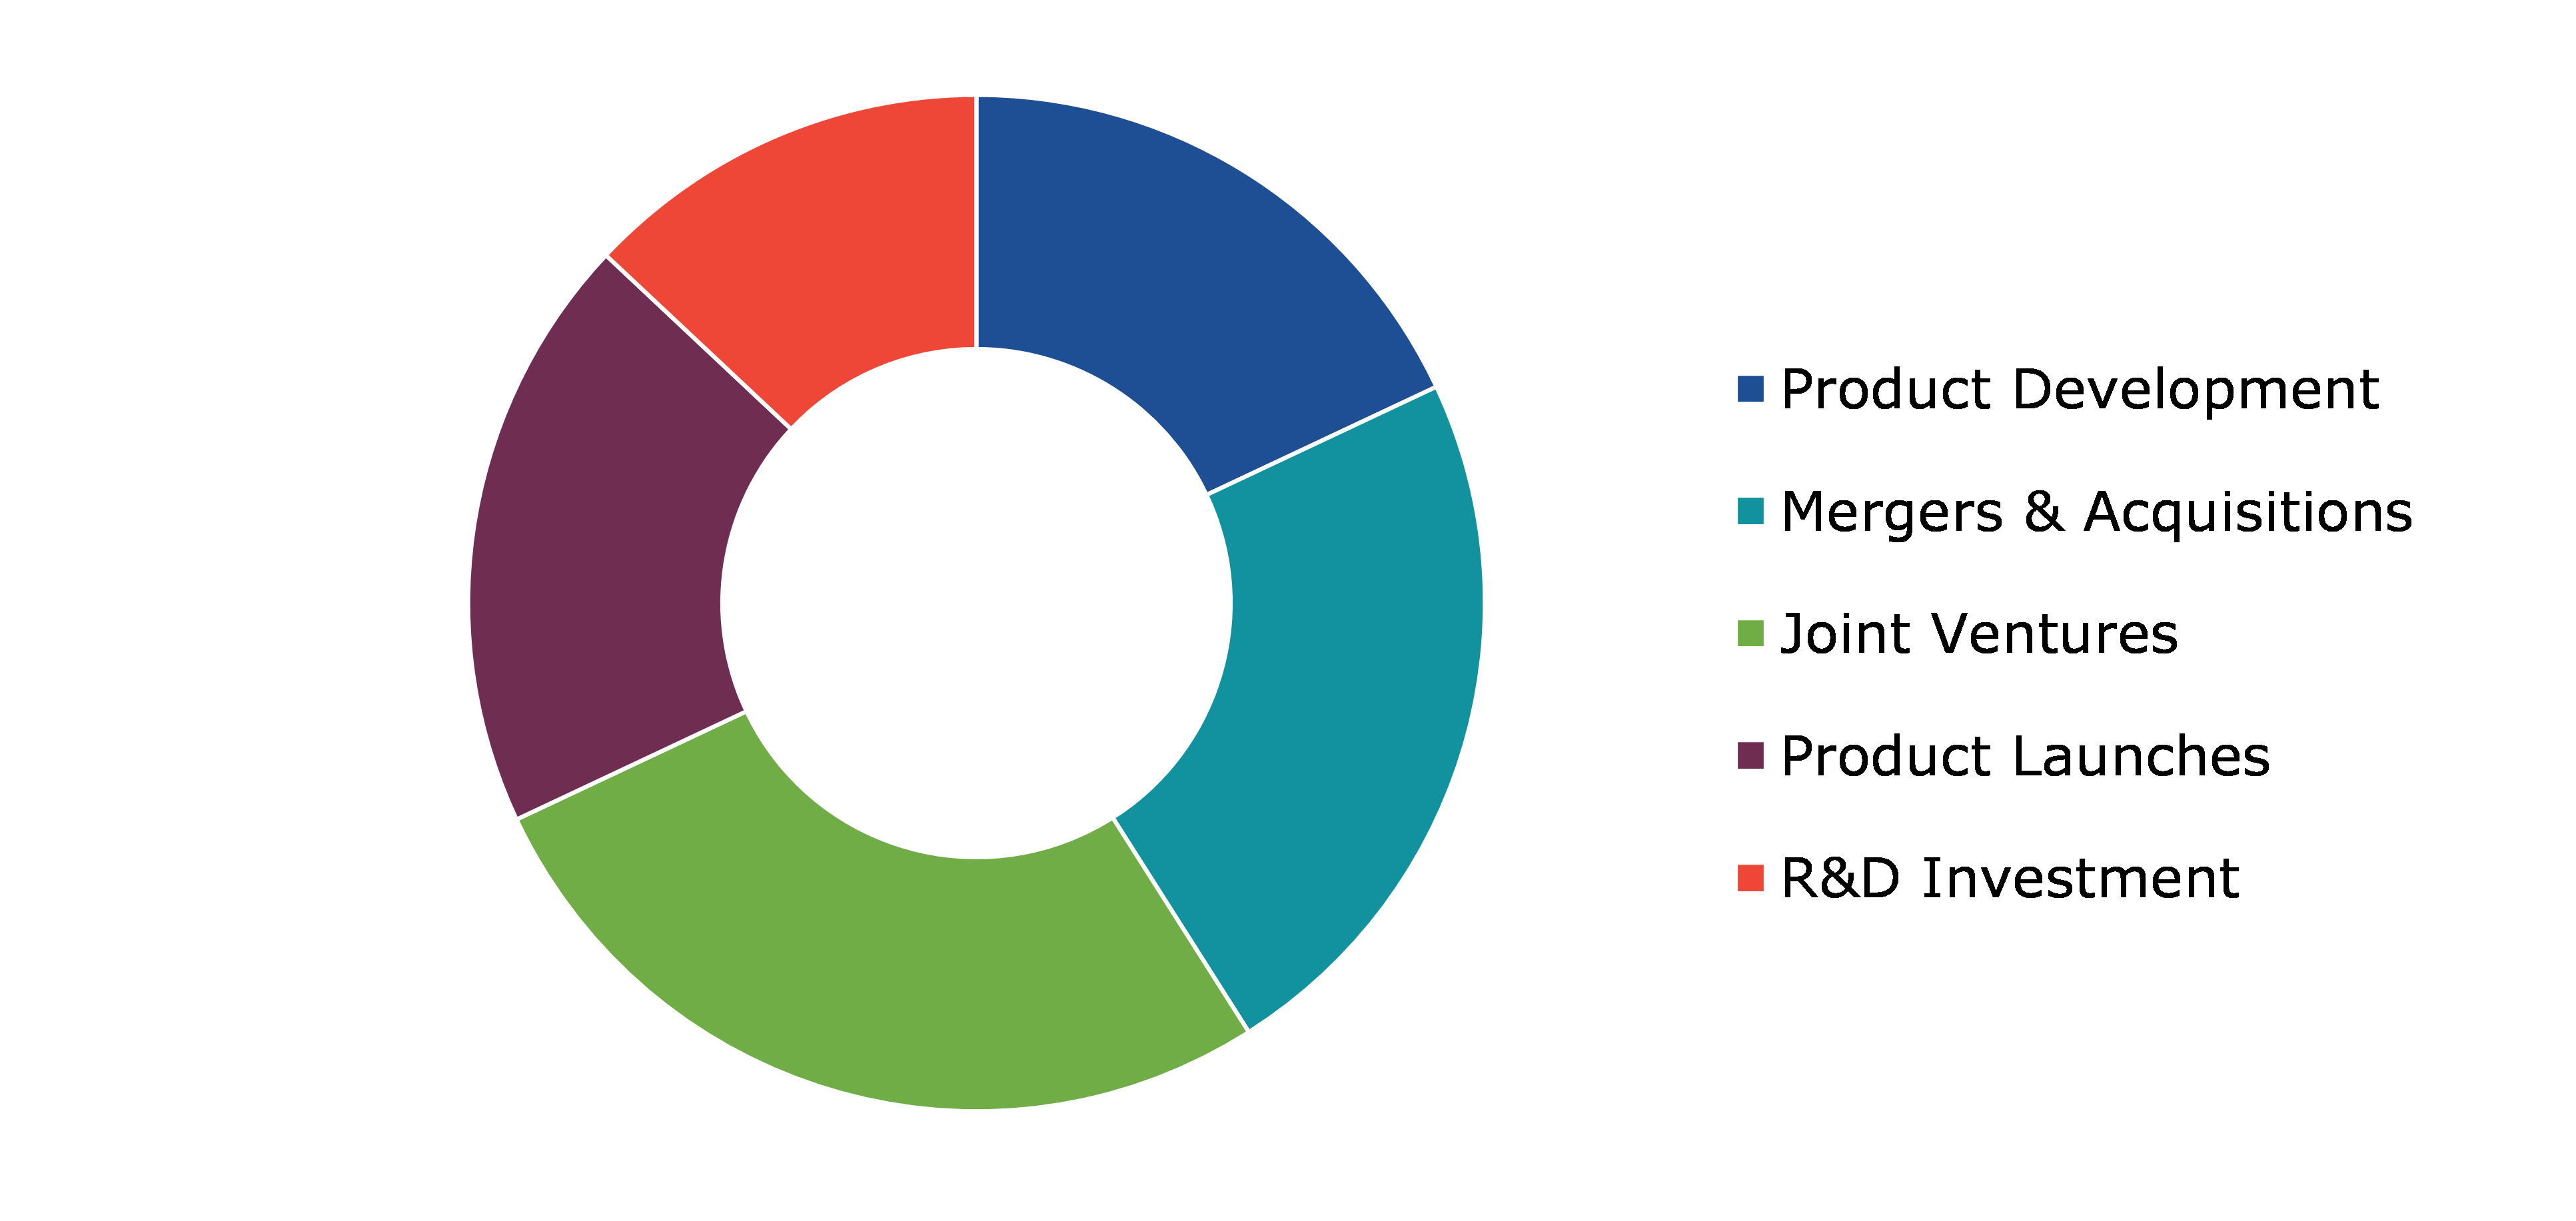
Competitive Scenario in the Global Education Computing Devices Market
Investment and agreement are common strategies followed by major market players. For instance, in March 2021, the Indian mobile handset brand, Lava International launched the student-centric tablets series. Lava's e-education series includes three tablets: Magnum XL, Aura, and Ivory. All three devices include a large screen, a robust battery, and outstanding audio quality, providing students with an uninterrupted learning experience.
Source: Research Dive Analysis
Some of the leading education computing devices market players are Acer Inc., Apple Inc., ASUSTeK Computer Inc., Dell Technologies, Hewlett-Packard Development Company, Lenovo, OPPO, Samsung Electronics, Vivo Mobile Communication Co., Ltd., and Xiaomi Corporation
| Aspect | Particulars |
| Historical Market Estimations | 2021-2022 |
| Base Year for Market Estimation | 2022 |
| Forecast Timeline for Market Projection | 2023-2032 |
| Geographical Scope | North America, Europe, Asia-Pacific, and LAMEA |
| Segmentation by Product Type |
|
| Segmentation by End User |
|
| Key Companies Profiled |
|
Q1. What is the size of the global education computing devices market?
A. The size of the global education computing devices market was over $101,281.30 million in 2022 and is projected to reach $368,072.50 million by 2032.
Q2. Which are the major companies in the education computing devices market?
A. Apple Inc., Dell Technologies, and Hewlett-Packard Development Company are some of the key players in the global education computing devices market.
Q3. Which region, among others, possesses greater investment opportunities in the future?
A. Asia-Pacific possesses great investment opportunities for investors in the future.
Q4. What will be the growth rate of the Asia-Pacific education computing devices market?
A. Asia-Pacific education computing devices market is anticipated to grow at 14.8% CAGR during the forecast period.
Q5. What are the strategies opted by the leading players in this market?
A. Agreement and investment are the two key strategies opted by the operating companies in this market.
Q6. Which companies are investing more on R&D practices?
A. Samsung Electronics, Vivo Mobile Communication Co., Ltd., and Xiaomi Corporation are the companies investing more on R&D activities for developing new products and technologies.
1.Research Methodology
1.1.Desk Research
1.2.Real time insights and validation
1.3.Forecast model
1.4.Assumptions and forecast parameters
1.5.Market size estimation
1.5.1.Top-down approach
1.5.2.Bottom-up approach
2.Report Scope
2.1.Market definition
2.2.Key objectives of the study
2.3.Report overview
2.4.Market segmentation
2.5.Overview of the impact of COVID-19 on Global education computing devices market
3.Executive Summary
4.Market Overview
4.1.Introduction
4.2.Growth impact forces
4.2.1.Drivers
4.2.2.Restraints
4.2.3.Opportunities
4.3.Market value chain analysis
4.3.1.List of raw material suppliers
4.3.2.List of manufacturers
4.3.3.List of distributors
4.4.Innovation & sustainability matrices
4.4.1.Technology matrix
4.4.2.Regulatory matrix
4.5.Porter’s five forces analysis
4.5.1.Bargaining power of suppliers
4.5.2.Bargaining power of consumers
4.5.3.Threat of substitutes
4.5.4.Threat of new entrants
4.5.5.Competitive Rivalry intensity
4.6.PESTLE analysis
4.6.1.Political
4.6.2.Economical
4.6.3.Social
4.6.4.Technological
4.6.5.Environmental
4.7.Impact of COVID-19 on the education computing devices market
4.7.1.Pre-covid market scenario
4.7.2.Post-covid market scenario
5.Education Computing Devices Market Analysis, by Product Type
5.1.Overview
5.2.Smartphones
5.2.1.Definition, key trends, growth factors, and opportunities
5.2.2.Market size analysis, by region, 2023-2032
5.2.3.Market share analysis, by country, 2023-2032
5.3.Laptops
5.3.1.Definition, key trends, growth factors, and opportunities
5.3.2.Market size analysis, by region, 2023-2032
5.3.3.Market share analysis, by country, 2023-2032
5.4.Tablets
5.4.1.Definition, key trends, growth factors, and opportunities
5.4.2.Market size analysis, by region, 2023-2032
5.4.3.Market share analysis, by country, 2023-2032
5.5.Others
5.5.1.Definition, key trends, growth factors, and opportunities
5.5.2.Market size analysis, by region, 2023-2032
5.5.3.Market share analysis, by country, 2023-2032
5.6.Research Dive Exclusive Insights
5.6.1.Market attractiveness
5.6.2.Competition heatmap
6.Education Computing Devices Market Analysis, by End User
6.1.Primary
6.1.1.Definition, key trends, growth factors, and opportunities
6.1.2.Market size analysis, by region, 2023-2032
6.1.3.Market share analysis, by country, 2023-2032
6.2.Secondary
6.2.1.Definition, key trends, growth factors, and opportunities
6.2.2.Market size analysis, by region, 2023-2032
6.2.3.Market share analysis, by country, 2023-2032
6.3.Higher Secondary
6.3.1.Definition, key trends, growth factors, and opportunities
6.3.2.Market size analysis, by region, 2023-2032
6.3.3.Market share analysis, by country, 2023-2032
6.4.Research Dive Exclusive Insights
6.4.1.Market attractiveness
6.4.2.Competition heatmap
7.Education Computing Devices Market, by Region
7.1.North America
7.1.1.U.S.
7.1.1.1.Market size analysis, by Product Type, 2023-2032
7.1.1.2.Market size analysis, by End User, 2023-2032
7.1.2.Canada
7.1.2.1.Market size analysis, by Product Type, 2023-2032
7.1.2.2.Market size analysis, by End User, 2023-2032
7.1.3.Mexico
7.1.3.1.Market size analysis, by Product Type, 2023-2032
7.1.3.2.Market size analysis, by End User, 2023-2032
7.1.4.Research Dive Exclusive Insights
7.1.4.1.Market attractiveness
7.1.4.2.Competition heatmap
7.2.Europe
7.2.1.Germany
7.2.1.1.Market size analysis, by Product Type, 2023-2032
7.2.1.2.Market size analysis, by End User, 2023-2032
7.2.2.UK
7.2.2.1.Market size analysis, by Product Type, 2023-2032
7.2.2.2.Market size analysis, by End User, 2023-2032
7.2.3.France
7.2.3.1.Market size analysis, by Product Type, 2023-2032
7.2.3.2.Market size analysis, by End User, 2023-2032
7.2.4.Spain
7.2.4.1.Market size analysis, by Product Type, 2023-2032
7.2.4.2.Market size analysis, by End User, 2023-2032
7.2.5.Italy
7.2.5.1.Market size analysis, by Product Type, 2023-2032
7.2.5.2.Market size analysis, by End User, 2023-2032
7.2.6.Rest of Europe
7.2.6.1.Market size analysis, by Product Type, 2023-2032
7.2.6.2.Market size analysis, by End User, 2023-2032
7.2.7.Research Dive Exclusive Insights
7.2.7.1.Market attractiveness
7.2.7.2.Competition heatmap
7.3.Asia-Pacific
7.3.1.China
7.3.1.1.Market size analysis, by Product Type, 2023-2032
7.3.1.2.Market size analysis, by End User, 2023-2032
7.3.2.Japan
7.3.2.1.Market size analysis, by Product Type, 2023-2032
7.3.2.2.Market size analysis, by End User, 2023-2032
7.3.3.India
7.3.3.1.Market size analysis, by Product Type, 2023-2032
7.3.3.2.Market size analysis, by End User, 2023-2032
7.3.4.Australia
7.3.4.1.Market size analysis, by Product Type, 2023-2032
7.3.4.2.Market size analysis, by End User, 2023-2032
7.3.5.South Korea
7.3.5.1.Market size analysis, by Product Type, 2023-2032
7.3.5.2.Market size analysis, by End User, 2023-2032
7.3.6.Rest of Asia-Pacific
7.3.6.1.Market size analysis, by Product Type, 2023-2032
7.3.6.2.Market size analysis, by End User, 2023-2032
7.3.7.Research Dive Exclusive Insights
7.3.7.1.Market attractiveness
7.3.7.2.Competition heatmap
7.4.LAMEA
7.4.1.Brazil
7.4.1.1.Market size analysis, by Product Type, 2023-2032
7.4.1.2.Market size analysis, by End User, 2023-2032
7.4.2.Saudi Arabia
7.4.2.1.Market size analysis, by Product Type, 2023-2032
7.4.2.2.Market size analysis, by End User, 2023-2032
7.4.3.UAE
7.4.3.1.Market size analysis, by Product Type, 2023-2032
7.4.3.2.Market size analysis, by End User, 2023-2032
7.4.4.South Africa
7.4.4.1.Market size analysis, by Product Type, 2023-2032
7.4.4.2.Market size analysis, by End User, 2023-2032
7.4.5.Rest of LAMEA
7.4.5.1.Market size analysis, by Product Type, 2023-2032
7.4.5.2.Market size analysis, by End User, 2023-2032
7.4.6.Research Dive Exclusive Insights
7.4.6.1.Market attractiveness
7.4.6.2.Competition heatmap
8.Competitive Landscape
8.1.Top winning strategies, 2022
8.1.1.By strategy
8.1.2.By year
8.2.Strategic overview
8.3.Market share analysis, 2021
9.Company Profiles
9.1.Acer Inc.
9.1.1.Overview
9.1.2.Business segments
9.1.3.Product portfolio
9.1.4.Financial performance
9.1.5.Recent developments
9.1.6.SWOT analysis
9.2.Apple Inc.
9.2.1.Overview
9.2.2.Business segments
9.2.3.Product portfolio
9.2.4.Financial performance
9.2.5.Recent developments
9.2.6.SWOT analysis
9.3.ASUSTeK Computer Inc.
9.3.1.Overview
9.3.2.Business segments
9.3.3.Product portfolio
9.3.4.Financial performance
9.3.5.Recent developments
9.3.6.SWOT analysis
9.4.Dell Technologies
9.4.1.verview
9.4.2.Business segments
9.4.3.Product portfolio
9.4.4.Financial performance
9.4.5.Recent developments
9.4.6.SWOT analysis
9.5.Hewlett-Packard Development Company
9.5.1.Overview
9.5.2.Business segments
9.5.3.Product portfolio
9.5.4.Financial performance
9.5.5.Recent developments
9.5.6.SWOT analysis
9.6.Lenovo
9.6.1.Overview
9.6.2.Business segments
9.6.3.Product portfolio
9.6.4.Financial performance
9.6.5.Recent developments
9.6.6.SWOT analysis
9.7.OPPO
9.7.1.Overview
9.7.2.Business segments
9.7.3.Product portfolio
9.7.4.Financial performance
9.7.5.Recent developments
9.7.6.SWOT analysis
9.8.Samsung Electronics
9.8.1.Overview
9.8.2.Business segments
9.8.3.Product portfolio
9.8.4.Financial performance
9.8.5.Recent developments
9.8.6.SWOT analysis
9.9.Vivo Mobile Communication Co., Ltd.
9.9.1.Overview
9.9.2.Business segments
9.9.3.Product portfolio
9.9.4.Financial performance
9.9.5.Recent developments
9.9.6.SWOT analysis
9.10.Xiaomi Corporation
9.10.1.Overview
9.10.2.Business segments
9.10.3.Product portfolio
9.10.4.Financial performance
9.10.5.Recent developments
9.10.6.SWOT analysis
Personalize this research
- Triangulate with your own data
- Request your format and definition
- Get a deeper dive on a specific application, geography, customer or competitor
- + 1-888-961-4454 Toll - Free
- support@researchdive.com
