Global Clot Busting Drugs Market Report
RA08735
Global Clot Busting Drugs Market by Product (Thrombolytic Drugs, Anti-Platelet Drugs, Anticoagulants, and Others), Indication (Pulmonary Embolism, Deep Vein Thrombosis, Atrial Fibrillation, and Others), Route of Administration (Oral and Injectable), Distribution Channel (Hospital Pharmacy, Online Pharmacy, and Retail Pharmacy), and Region (North America, Europe, Asia-Pacific, and LAMEA): Opportunity Analysis and Industry Forecast, 2023-2032
Clot Busting Drugs Overview
Clot-busting drugs, often known as thrombolytic drugs, are used to dissolve blood clots. These medications act by boosting the breakdown of fibrin, a protein implicated in blood clot formation. Clot-busting medications restore blood flow to the damaged area by breaking the clot. Tissue plasminogen activator (tPA), a naturally occurring enzyme in the body, is the most often used clot-busting medication. tPA aids in the conversion of plasminogen, an inactive protein, into plasmin, an enzyme that degrades fibrin and dissolves the clot.
Clot-busting medications are typically used in life-threatening situations where a blood clot offers a major health risk. They are commonly used to treat heart attacks, ischemic strokes (which occur when a clot forms in a blood vessel supplying the brain), and pulmonary embolisms (clots in the lungs).
Global Clot Busting Drugs Market Analysis
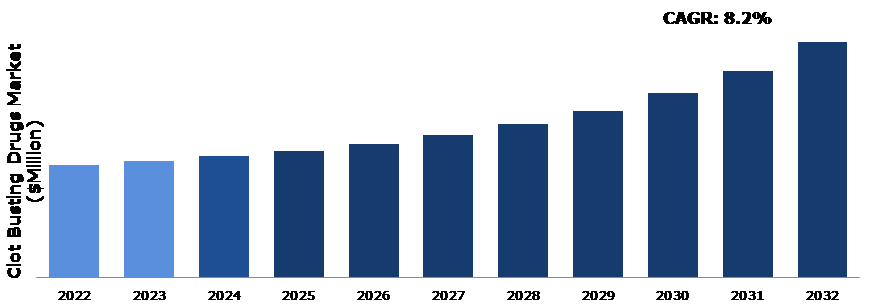
The global clot busting drugs market size was $28,616.40 million in 2022 and is predicted to grow with a CAGR of 8.2%, by generating a revenue of $60,009.20 million by 2032.
Source: Research Dive Analysis
COVID-19 Impact on Global Clot Busting Drugs Market
The COVID-19 pandemic has had a significant impact on the clot busting drugs market demand, due to supply chain disruptions during the lockdown. There was clearly a significant rise in venous thromboembolism (VTE) cases among the COVID-19 patients. The WHO stated in its January 2021 report that patients with COVID-19, both confirmed and suspected, must have access to follow-up care with low-dose anticoagulants. Such circumstances have increased the use of clot busting medications. However, the continued increase in heart disease patients in the post-pandemic period will result in the launch of more generic medications, hampering the sale of items such as heparin from large makers to some extent.
Increase in Prevalence of Cardiovascular Diseases to Drive Market Growth
The market for medications that dissolve clots is expanding significantly due to increasing cardiovascular diseases. Worldwide, ischemic strokes and other cardiovascular diseases pose a severe threat to public health. When a blood clot blocks the flow of blood to the heart or brain, several issues arise. Blood flow must be restored in order to reduce damage from these illnesses, and clot-busting drugs like tissue plasminogen activator (tPA) are essential for doing this. Cardiovascular diseases are becoming more common due to sedentary lifestyles, poor diets, tobacco use, and aging population. The demand for efficient therapy, such as clot-busting drugs, is increasing owing to this rising prevalence. In addition, the improvement in cardiovascular emergency detection and response times is due to the development and modernization of emergency medical services (EMS) systems. EMS personnel are taught to recognize the signs and symptoms of heart attacks and strokes, allowing them to transport patients to healthcare facilities where clot-busting medications can be provided in a timely manner.
To know more about global clot busting drugs market drivers, get in touch with our analysts here.
Increase in Bleeding Risk to Restrain The Market Growth
The main issue with clot-busting medications is the increase in risk of bleeding. As these medications function by promoting the dissolution of blood clots, they can also influence the body's clotting processes, increasing the risk of bleeding. This might manifest as internal bleeding, gastrointestinal bleeding, or injection site bleeding. The extent of the bleeding might range from mild bruises to life-threatening hemorrhage. In addition to the risk of bleeding, clot-busting drugs can have other side effects. Allergic responses, fever, low blood pressure, abnormal heart rhythms, and neurological problems such as seizures are examples of its side effects. Although these adverse effects are uncommon, they should be considered. All these factors are projected to hamper the clot busting drugs market growth in the upcoming years.
Advancements in Technology to Drive Excellent Opportunities
Diagnostic imaging advances, such as computed tomography (CT) scans and magnetic resonance imaging (MRI), can help in the speedy and accurate diagnosis of cardiovascular diseases. These approaches aid in the detection and localization of blood clots, allowing for prompt therapy with clot-busting medications. In addition, innovative drug delivery devices can improve the administration and efficacy of clot-busting medications. Advances in catheter-based technologies, for example, can allow for the direct delivery of thrombolytic drugs to the location of the clot, boosting efficacy while minimizing systemic side effects. These technological innovations help to improve patient care, treatment outcomes, and the efficiency with which clot-busting medications are delivered. They also offer opportunities for pharmaceutical companies and healthcare professionals to develop and market novel clot-busting medications.
To know more about global clot busting drugs market opportunities, get in touch with our analysts here.
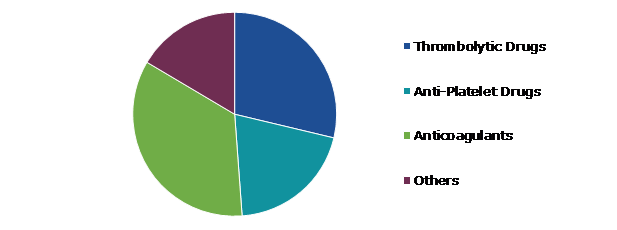
Global Clot Busting Drugs Market Share, by Product, 2022
Source: Research Dive Analysis
The anticoagulants sub-segment accounted for the highest market share in 2022. Chronic disease prevalence is rising alarmingly across the globe. The overall burden of sickness is influenced by a number of factors, including obesity, an unhealthy lifestyle, and excessive stress. Blood clots, which can result in a heart attack or other major problems, can be prevented and treated with anticoagulants, which are medications that are recommended to people with coronary artery disease (CAD). According to the Centers for Disease Control and Prevention (CDC), coronary heart disease, the most frequent kind of heart disease in the U.S., resulted in 382,820 fatalities in 2020. Currently, anticoagulants are used more frequently to halt the negative effects of these diseases. The prevalence of myocardial infection is also increasing globally, with a major share of individuals experiencing health concerns owing to stress and other precipitating factors.
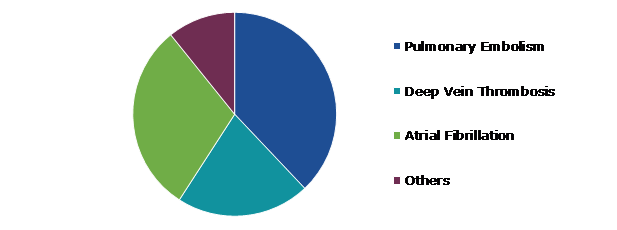
Global Clot Busting Drugs Market Size, by Indication, 2022
Source: Research Dive Analysis
The pulmonary embolism sub-segment accounted for the highest clot busting drugs market size in 2022. A pulmonary embolism (PE) occurs when a blood clot becomes lodged in a lung artery and blocks blood flow to a part of the lung. Blood clots typically begin in the legs, travel up the right side of the heart, and then enter the lungs. The medical term for this is deep vein thrombosis (DVT). Anticoagulant drugs, also known as blood thinners, are commonly used in the treatment of pulmonary embolism to prevent the growth of the existing clot and the production of new clots. These drugs lower the blood's ability to clot by preventing blood coagulation factors from working. Heparin, warfarin, and direct oral anticoagulants (DOACs) such apixaban, rivaroxaban, and dabigatran are typical anticoagulants used to treat pulmonary embolism. The requirement for clot-busting medications, specifically thrombolytic agents, is often found in severe pulmonary embolism situations where there is a considerable obstruction in the pulmonary arteries, resulting in restricted blood flow.
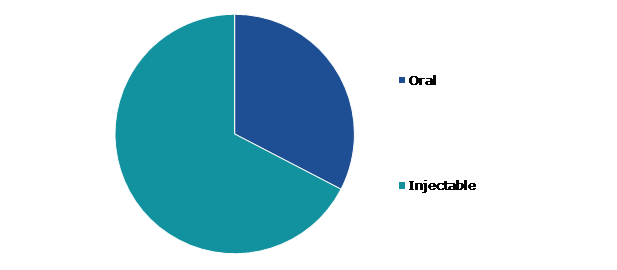
Global Clot Busting Drugs Market Growth, by Route of Administration, 2022
Source: Research Dive Analysis
The injectable sub-segment accounted for the highest clot busting drugs market share in 2022. A quick and effective method of thrombolysis is offered by injectable clot-busting medications. These medications can rapidly reach the site of the clot and start the clot-dissolving process by being injected directly into the bloodstream or the damaged blood artery. This facilitates prompt blood flow restoration, which is important in time-sensitive circumstances like acute myocardial infarction and ischemic stroke. In emergency medicine and critical care settings, where quick clot breakdown is necessary to stabilize patients with life-threatening diseases, injectable clot buster medications are often used. Acute ischemic stroke, major pulmonary embolism, acute limb ischemia, among other conditions, are frequently treated with these medications. The desire for efficient and quick-acting thrombolytic medications in emergency situations drives the injectable sub-segment growth.
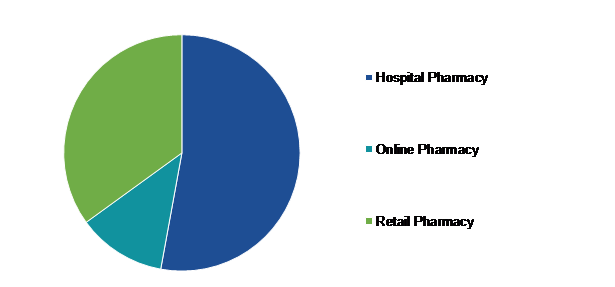
Global Clot Busting Drugs Market Analysis, by Distribution Channel, 2022
Source: Research Dive Analysis
The hospital pharmacy sub-segment accounted for the highest clot busting drugs market share in 2022. Hospital pharmacies are critical in supplying clot-busting medications for illnesses such as pulmonary embolism. These pharmacies are in charge of acquiring, storing, compounding (if necessary), and dispensing pharmaceuticals to hospitalized healthcare providers. When it comes to clot-busting pharmaceuticals, hospital pharmacy makes certain that they have an adequate amount on hand. Maintaining relationships with pharmaceutical suppliers, monitoring inventory levels, and managing the storage conditions required for these pharmaceuticals, which may have special temperature and handling requirements. Hospital pharmacy also collaborate closely with physicians and specialized teams such as pulmonologists, cardiologists, and critical care experts. When clot-busting medications are required for patient therapy, these healthcare personnel rely on the hospital pharmacy to provide them with medicines.
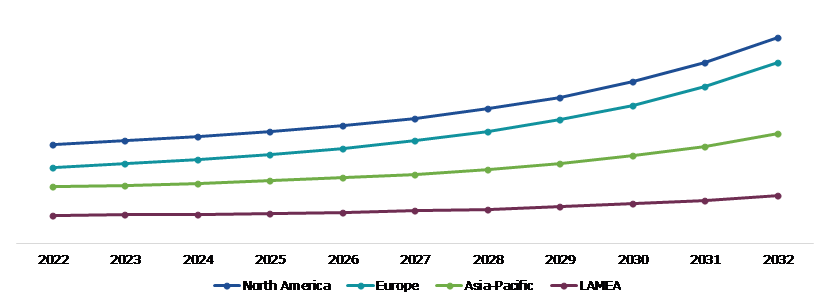
Global Clot Busting Drugs Market Size & Forecast, by Region, 2022-2032 ($Million)
Source: Research Dive Analysis
The North America clot busting drugs market analysis generated the highest revenue in 2022. The regional market is expected to expand due to the high prevalence of cardiovascular diseases that call for anticoagulant treatment and new product introductions. In addition, the market in North America is also anticipated to grow during the forecast period due to rising R&D initiatives, higher awareness of risk factors including obesity and diabetes, and their prevalence in the general population. Every year, there roughly 8 million people have a stroke in the U.S. More than 85% of these strokes are ischemic, in which a blood clot has blocked a vein that supplies blood to the brain. All these factors are anticipated to drive the clot busting drugs market growth in North America during the forecast years.
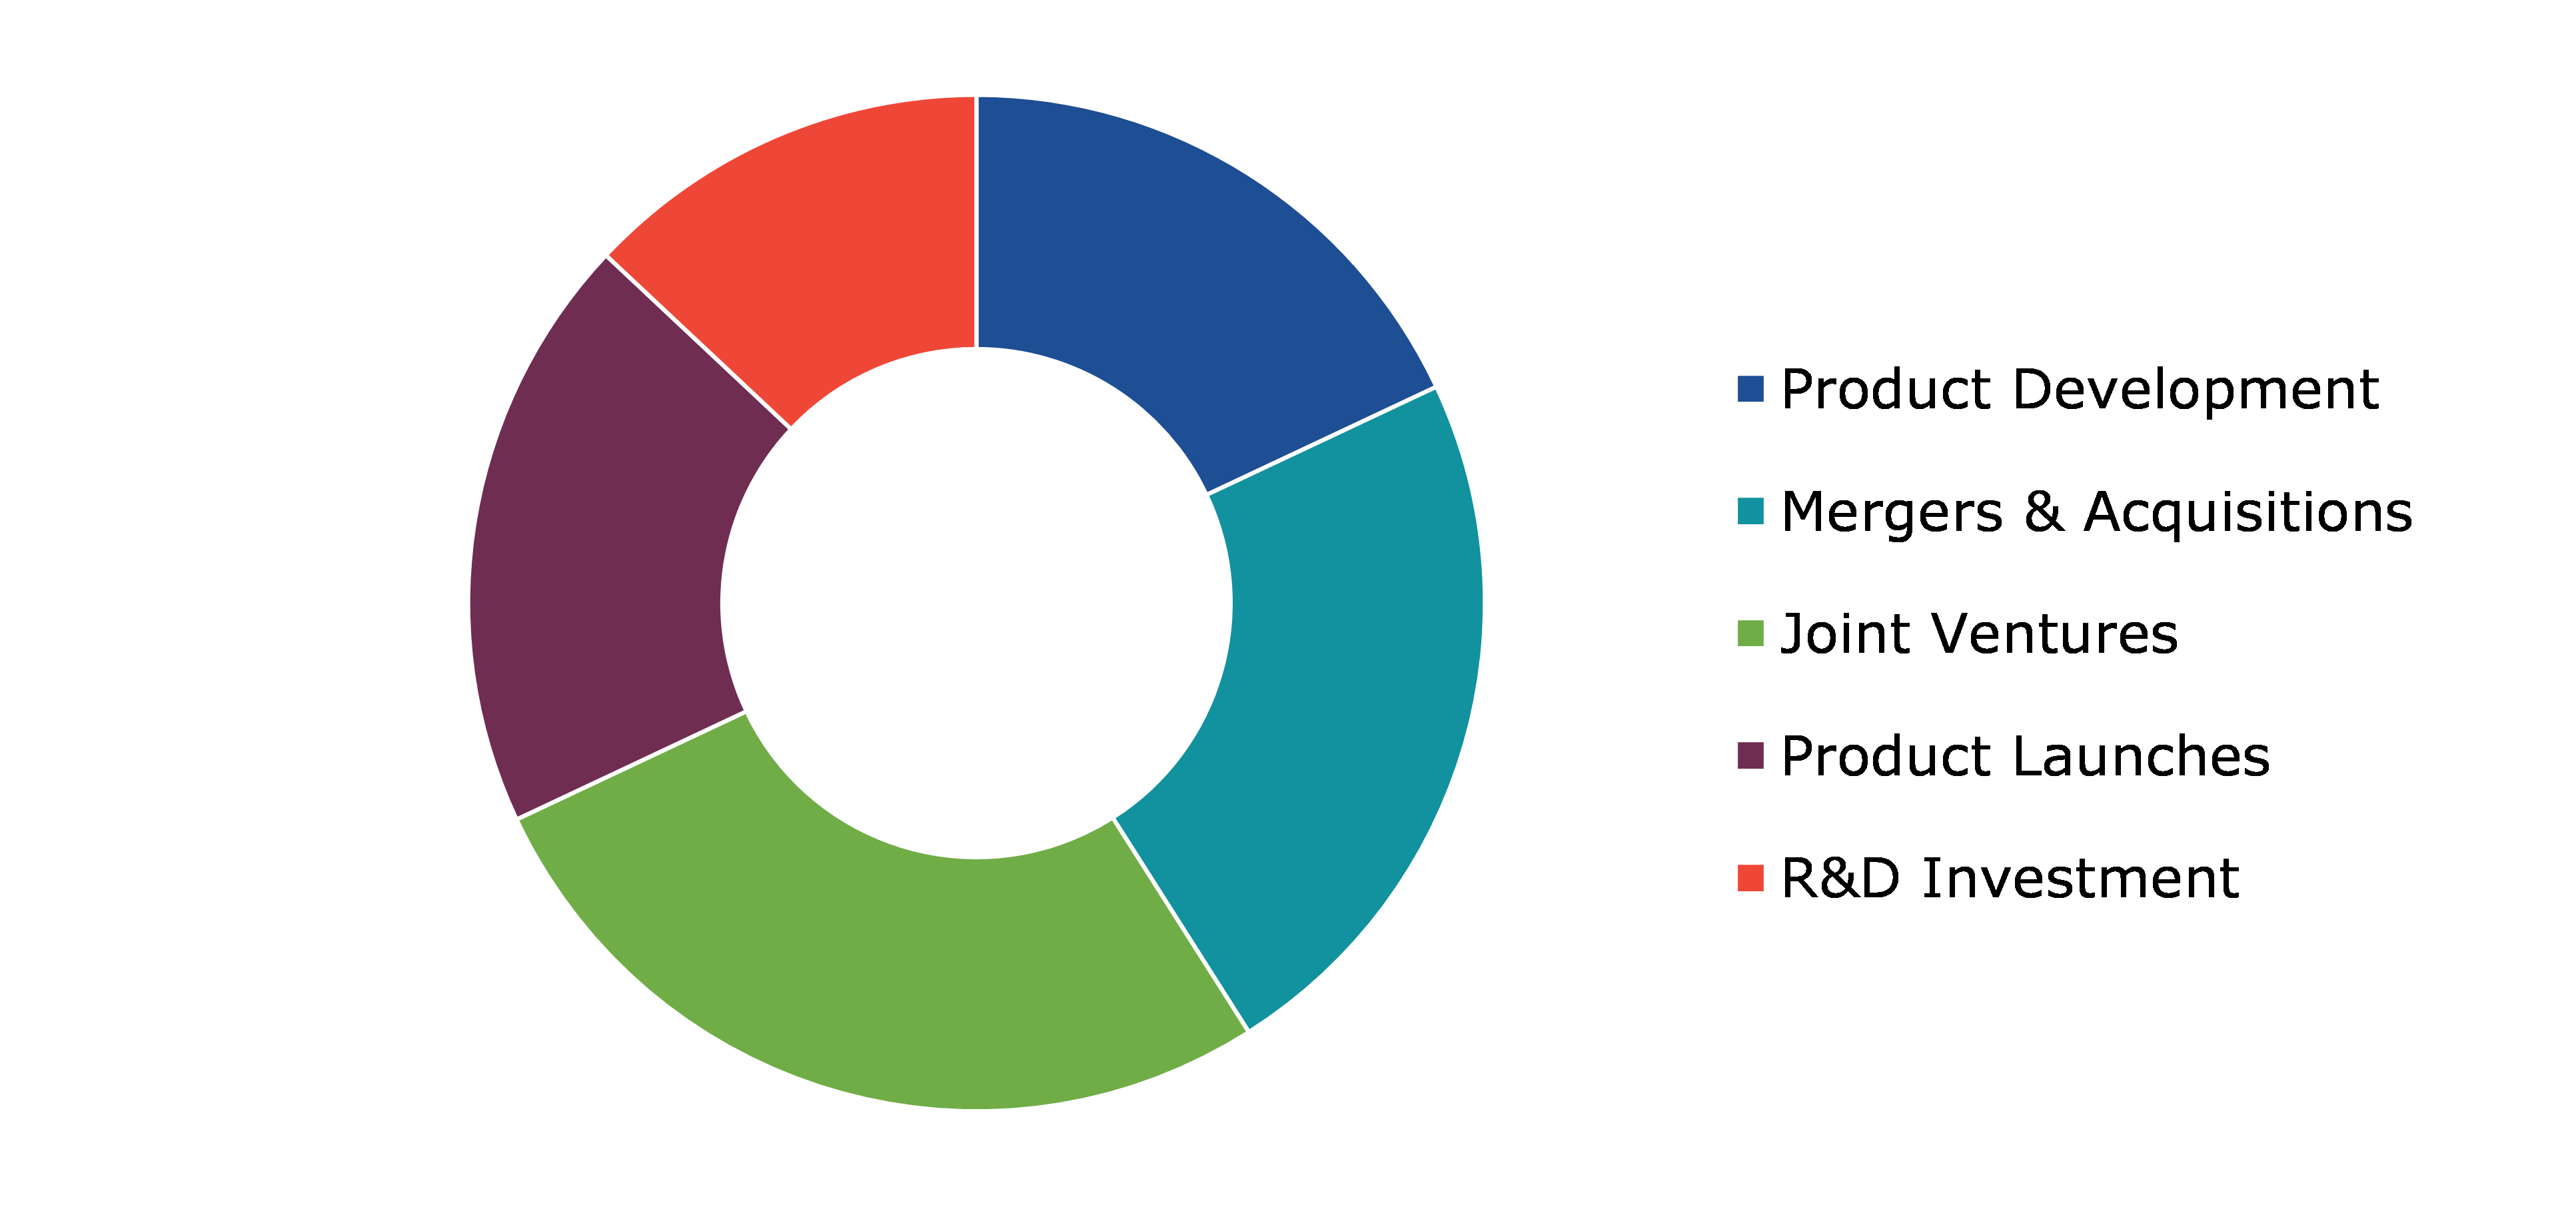
Competitive Scenario in the Global Clot Busting Drugs Market
Investment and agreement are common strategies followed by major market players. In December 2021, Janssen Pharmaceutical received the U.S. FDA approval for its oral anticoagulant called XARELTO (rivaroxaban). The drug was approved for 2 indications for pediatric category which includes prophylaxis of DVT or deep vein thrombosis resulting in pulmonary embolism.
Source: Research Dive Analysis
Some of the leading clot busting drugs market players are Pfizer Inc., Johnson & Johnson Services Inc, Sanofi, Dr. Reddy’s Laboratories, Bayer AG, Boehringer Ingelheim Gmbh, Genentech Inc., Eli Lilly and Company, Sun Pharmaceutical Industries Ltd., and Merck & Co.
| Aspect | Particulars |
| Historical Market Estimations | 2020-2021 |
| Base Year for Market Estimation | 2022 |
| Forecast Timeline for Market Projection | 2023-2032 |
| Geographical Scope | North America, Europe, Asia-Pacific, and LAMEA |
| Segmentation by Product |
|
| Segmentation by Indication Pulmonary |
|
|
Segmentation by Route of Administration
|
|
| Distribution Channel |
|
| Key Companies Profiled |
|
Q1. What is the size of the global clot busting drugs market?
A. The size of the global clot busting drugs market was over $28,616.40 million in 2022 and is projected to reach $60,009.20 million by 2032.
Q2. Which are the major companies in the clot busting drugs market?
A. Nudge Rewards Inc. and GuideSpark are some of the key players in the global clot busting drugs market.
Q3. Which region, among others, possesses greater investment opportunities in the future?
A. North America possesses great investment opportunities for investors in the future.
Q4. What will be the growth rate of the Asia-Pacific clot busting drugs market?
A. Asia-Pacific clot busting drugs market is anticipated to grow at 7.3% CAGR during the forecast period.
Q5. What are the strategies opted by the leading players in this market?
A. Agreement and investment are the two key strategies opted by the operating companies in this market.
Q6. Which companies are investing more on R&D practices?
A. Beekeeper AG, Sociabble, Inc., and Social Chorus. Inc. are the companies investing more on R&D activities for developing new products and technologies.
1.Research Methodology
1.1.Desk Research
1.2.Real time insights and validation
1.3.Forecast model
1.4.Assumptions and forecast parameters
1.5.Market size estimation
1.5.1.Top-down approach
1.5.2.Bottom-up approach
2.Report Scope
2.1.Market definition
2.2.Key objectives of the study
2.3.Report overview
2.4.Market segmentation
2.5.Overview of the impact of COVID-19 on Global Clot Busting Drugs market
3.Executive Summary
4.Market Overview
4.1.Introduction
4.2.Growth impact forces
4.2.1.Drivers
4.2.2.Restraints
4.2.3.Opportunities
4.3.Market value chain analysis
4.3.1.List of raw material suppliers
4.3.2.List of manufacturers
4.3.3.List of distributors
4.4.Innovation & sustainability matrices
4.4.1.Technology matrix
4.4.2.Regulatory matrix
4.5.Porter’s five forces analysis
4.5.1.Bargaining power of suppliers
4.5.2.Bargaining power of consumers
4.5.3.Threat of substitutes
4.5.4.Threat of new entrants
4.5.5.Competitive rivalry intensity
4.6.PESTLE analysis
4.6.1.Political
4.6.2.Economical
4.6.3.Social
4.6.4.Technological
4.6.5.Environmental
4.7.Impact of COVID-19 on Clot Busting Drugs market
4.7.1.Pre-covid market scenario
4.7.2.Post-covid market scenario
5.Clot Busting Drugs Market Analysis, by Product
5.1.Overview
5.2.Thrombolytic Drugs
5.2.1.Definition, key trends, growth factors, and opportunities
5.2.2.Market size analysis, by region, 2022-2032
5.2.3.Market share analysis, by country, 2022-2032
5.3.Anti-Platelet Drugs
5.3.1.Definition, key trends, growth factors, and opportunities
5.3.2.Market size analysis, by region, 2022-2032
5.3.3.Market share analysis, by country, 2022-2032
5.4.Anticoagulants
5.4.1.Definition, key trends, growth factors, and opportunities
5.4.2.Market size analysis, by region, 2022-2032
5.4.3.Market share analysis, by country, 2022-2032
5.5.Others
5.5.1.Definition, key trends, growth factors, and opportunities
5.5.2.Market size analysis, by region, 2022-2032
5.5.3.Market share analysis, by country, 2022-2032
5.6.Research Dive Exclusive Insights
5.6.1.Market attractiveness
5.6.2.Competition heatmap
6.Clot Busting Drugs Market Analysis, by Indication
6.1.Pulmonary Embolism
6.1.1.Definition, key trends, growth factors, and opportunities
6.1.2.Market size analysis, by region, 2022-2032
6.1.3.Market share analysis, by country, 2022-2032
6.2.Deep Vein Thrombosis
6.2.1.Definition, key trends, growth factors, and opportunities
6.2.2.Market size analysis, by region, 2022-2032
6.2.3.Market share analysis, by country, 2022-2032
6.3.Atrial Fibrillation
6.3.1.Definition, key trends, growth factors, and opportunities
6.3.2.Market size analysis, by region, 2022-2032
6.3.3.Market share analysis, by country, 2022-2032
6.4.Others
6.4.1.Definition, key trends, growth factors, and opportunities
6.4.2.Market size analysis, by region, 2022-2032
6.4.3.Market share analysis, by country, 2022-2032
6.5.Research Dive Exclusive Insights
6.5.1.Market attractiveness
6.5.2.Competition heatmap
7.Clot Busting Drugs Market Analysis, by Route of Administration
7.1.Oral
7.1.1.Definition, key trends, growth factors, and opportunities
7.1.2.Market size analysis, by region, 2022-2032
7.1.3.Market share analysis, by country, 2022-2032
7.2.Injectable
7.2.1.Definition, key trends, growth factors, and opportunities
7.2.2.Market size analysis, by region, 2022-2032
7.2.3.Market share analysis, by country, 2022-2032
7.3.Research Dive Exclusive Insights
7.3.1.Market attractiveness
7.3.2.Competition heatmap
8.Clot Busting Drugs Market Analysis, by Distribution Channel
8.1.Hospital Pharmacy
8.1.1.Definition, key trends, growth factors, and opportunities
8.1.2.Market size analysis, by region, 2022-2032
8.1.3.Market share analysis, by country, 2022-2032
8.2.Online Pharmacy
8.2.1.Definition, key trends, growth factors, and opportunities
8.2.2.Market size analysis, by region, 2022-2032
8.2.3.Market share analysis, by country, 2022-2032
8.3.Retail Pharmacy
8.3.1.Definition, key trends, growth factors, and opportunities
8.3.2.Market size analysis, by region, 2022-2032
8.3.3.Market share analysis, by country, 2022-2032
8.4.Research Dive Exclusive Insights
8.4.1.Market attractiveness
8.4.2.Competition heatmap
9.Clot Busting Drugs Market, by Region
9.1.North America
9.1.1.U.S.
9.1.1.1.Market size analysis, by Product, 2022-2032
9.1.1.2.Market size analysis, by Indication, 2022-2032
9.1.1.3.Market size analysis, by Route of Administration, 2022-2032
9.1.1.4.Market size analysis, by Distribution Channel, 2022-2032
9.1.2.Canada
9.1.2.1.Market size analysis, by Product, 2022-2032
9.1.2.2.Market size analysis, by Indication, 2022-2032
9.1.2.3.Market size analysis, by Route of Administration, 2022-2032
9.1.2.4.Market size analysis, by Distribution Channel, 2022-2032
9.1.3.Mexico
9.1.3.1.Market size analysis, by Product, 2022-2032
9.1.3.2.Market size analysis, by Indication, 2022-2032
9.1.3.3.Market size analysis, by Route of Administration, 2022-2032
9.1.3.4.Market size analysis, by Distribution Channel, 2022-2032
9.1.4.Research Dive Exclusive Insights
9.1.4.1.Market attractiveness
9.1.4.2.Competition heatmap
9.2.Europe
9.2.1.Germany
9.2.1.1.Market size analysis, by Product, 2022-2032
9.2.1.2.Market size analysis, by Indication, 2022-2032
9.2.1.3.Market size analysis, by Route of Administration, 2022-2032
9.2.1.4.Market size analysis, by Distribution Channel, 2022-2032
9.2.2.UK
9.2.2.1.Market size analysis, by Product, 2022-2032
9.2.2.2.Market size analysis, by Indication, 2022-2032
9.2.2.3.Market size analysis, by Route of Administration, 2022-2032
9.2.2.4.Market size analysis, by Distribution Channel, 2022-2032
9.2.3.France
9.2.3.1.Market size analysis, by Product, 2022-2032
9.2.3.2.Market size analysis, by Indication, 2022-2032
9.2.3.3.Market size analysis, by Route of Administration, 2022-2032
9.2.3.4.Market size analysis, by Distribution Channel, 2022-2032
9.2.4.Spain
9.2.4.1.Market size analysis, by Product, 2022-2032
9.2.4.2.Market size analysis, by Indication, 2022-2032
9.2.4.3.Market size analysis, by Route of Administration, 2022-2032
9.2.4.4.Market size analysis, by Distribution Channel, 2022-2032
9.2.5.Italy
9.2.5.1.Market size analysis, by Product, 2022-2032
9.2.5.2.Market size analysis, by Indication, 2022-2032
9.2.5.3.Market size analysis, by Route of Administration, 2022-2032
9.2.5.4.Market size analysis, by Distribution Channel, 2022-2032
9.2.6.Rest of Europe
9.2.6.1.Market size analysis, by Product, 2022-2032
9.2.6.2.Market size analysis, by Indication, 2022-2032
9.2.6.3.Market size analysis, by Route of Administration, 2022-2032
9.2.6.4.Market size analysis, by Distribution Channel, 2022-2032
9.2.7.Research Dive Exclusive Insights
9.2.7.1.Market attractiveness
9.2.7.2.Competition heatmap
9.3.Asia-Pacific
9.3.1.China
9.3.1.1.Market size analysis, by Product, 2022-2032
9.3.1.2.Market size analysis, by Indication, 2022-2032
9.3.1.3.Market size analysis, by Route of Administration, 2022-2032
9.3.1.4.Market size analysis, by Distribution Channel, 2022-2032
9.3.2.Japan
9.3.2.1.Market size analysis, by Product, 2022-2032
9.3.2.2.Market size analysis, by Indication, 2022-2032
9.3.2.3.Market size analysis, by Route of Administration, 2022-2032
9.3.2.4.Market size analysis, by Distribution Channel, 2022-2032
9.3.3.India
9.3.3.1.Market size analysis, by Product, 2022-2032
9.3.3.2.Market size analysis, by Indication, 2022-2032
9.3.3.3.Market size analysis, by Route of Administration, 2022-2032
9.3.3.4.Market size analysis, by Distribution Channel, 2022-2032
9.3.4.Australia
9.3.4.1.Market size analysis, by Product, 2022-2032
9.3.4.2.Market size analysis, by Indication, 2022-2032
9.3.4.3.Market size analysis, by Route of Administration, 2022-2032
9.3.4.4.Market size analysis, by Distribution Channel, 2022-2032
9.3.5.South Korea
9.3.5.1.Market size analysis, by Product, 2022-2032
9.3.5.2.Market size analysis, by Indication, 2022-2032
9.3.5.3.Market size analysis, by Route of Administration, 2022-2032
9.3.5.4.Market size analysis, by Distribution Channel, 2022-2032
9.3.6.Rest of Asia-Pacific
9.3.6.1.Market size analysis, by Product, 2022-2032
9.3.6.2.Market size analysis, by Indication, 2022-2032
9.3.6.3.Market size analysis, by Route of Administration, 2022-2032
9.3.6.4.Market size analysis, by Distribution Channel, 2022-2032
9.3.7.Research Dive Exclusive Insights
9.3.7.1.Market attractiveness
9.3.7.2.Competition heatmap
9.4.LAMEA
9.4.1.Brazil
9.4.1.1.Market size analysis, by Product, 2022-2032
9.4.1.2.Market size analysis, by Indication, 2022-2032
9.4.1.3.Market size analysis, by Route of Administration, 2022-2032
9.4.1.4.Market size analysis, by Distribution Channel, 2022-2032
9.4.2.Saudi Arabia
9.4.2.1.Market size analysis, by Product, 2022-2032
9.4.2.2.Market size analysis, by Indication, 2022-2032
9.4.2.3.Market size analysis, by Route of Administration, 2022-2032
9.4.2.4.Market size analysis, by Distribution Channel, 2022-2032
9.4.3.UAE
9.4.3.1.Market size analysis, by Product, 2022-2032
9.4.3.2.Market size analysis, by Indication, 2022-2032
9.4.3.3.Market size analysis, by Route of Administration, 2022-2032
9.4.3.4.Market size analysis, by Distribution Channel, 2022-2032
9.4.4.South Africa
9.4.4.1.Market size analysis, by Product, 2022-2032
9.4.4.2.Market size analysis, by Indication, 2022-2032
9.4.4.3.Market size analysis, by Route of Administration, 2022-2032
9.4.4.4.Market size analysis, by Distribution Channel, 2022-2032
9.4.5.Rest of LAMEA
9.4.5.1.Market size analysis, by Product, 2022-2032
9.4.5.2.Market size analysis, by Indication, 2022-2032
9.4.5.3.Market size analysis, by Route of Administration, 2022-2032
9.4.5.4.Market size analysis, by Distribution Channel, 2022-2032
9.4.6.Research Dive Exclusive Insights
9.4.6.1.Market attractiveness
9.4.6.2.Competition heatmap
10.Competitive Landscape
10.1.Top winning strategies, 2022
10.1.1.By strategy
10.1.2.By year
10.2.Strategic overview
10.3.Market share analysis, 2022
11.Company Profiles
11.1.Pfizer Inc.
11.1.1.Overview
11.1.2.Business segments
11.1.3.Product portfolio
11.1.4.Financial performance
11.1.5.Recent developments
11.1.6.SWOT analysis
11.2.Johnson & Johnson Services Inc
11.2.1.Overview
11.2.2.Business segments
11.2.3.Product portfolio
11.2.4.Financial performance
11.2.5.Recent developments
11.2.6.SWOT analysis
11.3.Sanofi
11.3.1.Overview
11.3.2.Business segments
11.3.3.Product portfolio
11.3.4.Financial performance
11.3.5.Recent developments
11.3.6.SWOT analysis
11.4.Dr. Reddy’s Laboratories
11.4.1.Overview
11.4.2.Business segments
11.4.3.Product portfolio
11.4.4.Financial performance
11.4.5.Recent developments
11.4.6.SWOT analysis
11.5.Bayer AG
11.5.1.Overview
11.5.2.Business segments
11.5.3.Product portfolio
11.5.4.Financial performance
11.5.5.Recent developments
11.5.6.SWOT analysis
11.6.Boehringer Ingelheim Gmbh
11.6.1.Overview
11.6.2.Business segments
11.6.3.Product portfolio
11.6.4.Financial performance
11.6.5.Recent developments
11.6.6.SWOT analysis
11.7.Genentech Inc.
11.7.1.Overview
11.7.2.Business segments
11.7.3.Product portfolio
11.7.4.Financial performance
11.7.5.Recent developments
11.7.6.SWOT analysis
11.8.Eli Lilly and Company
11.8.1.Overview
11.8.2.Business segments
11.8.3.Product portfolio
11.8.4.Financial performance
11.8.5.Recent developments
11.8.6.SWOT analysis
11.9.Sun Pharmaceutical Industries Ltd.
11.9.1.Overview
11.9.2.Business segments
11.9.3.Product portfolio
11.9.4.Financial performance
11.9.5.Recent developments
11.9.6.SWOT analysis
11.10.Merck & Co
11.10.1.Overview
11.10.2.Business segments
11.10.3.Product portfolio
11.10.4.Financial performance
11.10.5.Recent developments
11.10.6.SWOT analysis
Personalize this research
- Triangulate with your own data
- Request your format and definition
- Get a deeper dive on a specific application, geography, customer or competitor
- + 1-888-961-4454 Toll - Free
- support@researchdive.com
