Redox Flow Battery Market Report
RA00074
Redox Flow Battery Market, by Material (Vanadium, Hybrid) and by Application (Utility Services, Renewable Energy Integration, UPS and Others) Regional Outlook (North America, Europe, Asia-Pacific, LAMEA), Global Opportunity Analysis and Industry Forecast, 2019–2026
Update Available On-Demand
Global Redox Flow Battery Market Insights 2026:
The redox flow battery market size was $127.8 million in 2018 and is predicted to grow at a CAGR of 13.5% in the forecast period. North American market was valued for $26.8 million in 2018 and is predicted to grow by $81.2 million by 2026. Asia-Pacific market was $52.6 million in 2018 and is predicted to grow by generating a revenue of $166.9 million by 2026.
Redox flow battery is a rechargeable battery which works on the oxidation and reduction reaction mechanism. The redox flow battery converts the chemical energy to the electrical energy with the help of reduction of working fluids and reversible oxidation. These batteries work for longer time due to the less degradation of electrolytes and electrodes.
Redox Flow Battery Market Drivers:
Increased use of renewable resources and durability of the battery are the major redox flow battery market drivers.
The increased use of renewable resources and the longevity of the battery is considered to be the major driving factor for the redox flow battery market. The installation of wind and solar power plants is expected to drive the market as these batteries can work even in 0% energy by using the energy that is stored in the battery itself. Government is also taking initiative and encouraging the use of rechargeable redox batteries over the normal batteries, as normal battery releases harmful substances like lead, cadmium and mercury into the environment which are very harmful to the ecosystem. The longevity of the battery is considered to be the biggest driving factor, as the battery has a lifespan of 40 years and the capacity can be easily increased by increasing the number of tanks and electrolytes.
Market Restraints:
Complexity of structure is the major restrain for the redox flow battery market.
The biggest restraint for the redox flow battery industry is the complexity of the structure. It requires sensors, pumps, power management and flow to the secondary containment to operate which makes the battery even costlier. In addition to these, it makes the functional design comparatively heavier and larger which results to the unavailability of its application in large scale areas. In addition, complex technical issues and deficiency of proper development standard of redox is expected to hamper the market growth in the forecast period.
Redox Flow Battery Market Segmentation, by Material
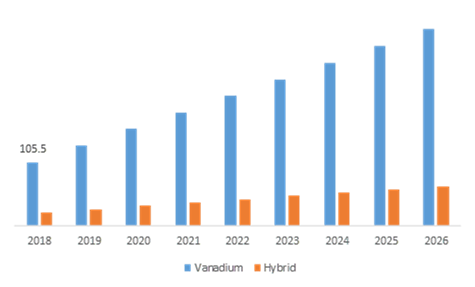
Vanadium type holds the largest market share for the flow battery market.
Source: Research Dive Analysis
Vanadium Redox Flow Battery Market holds the largest market share. Vanadium segment market accounted for $105.5 million in 2018 and is predicted to generate a revenue of $325.6 million by 2026. Vanadium is the most widely used material in the redox flow battery market. Vanadium has the ability to operate in a full cycle and it can be operated even in the 0% charge, using the stored or renewable energy. Vanadium has the ability to store batteries for longer time with low maintenance. These factors are expected to boost to the redox flow battery market.
Redox Flow Battery Market, by Application
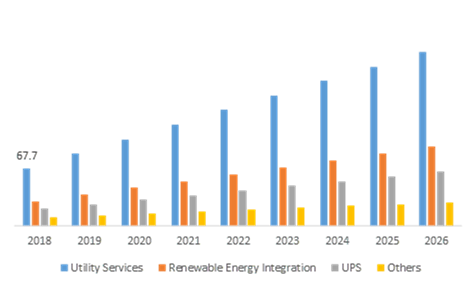
Utility services is projected to be most lucrative by 2026.
Source: Research Dive Analysis
Utilities dominates redox flow battery market share by 52.96% in the forecast period. Utilities application was $67.7 million in 2018 and is predicted to grow by generating a revenue of $205.9 million by 2026. Flow batteries are accessible as their capacity can increase by using an extra or larger electrolyte in the tanks, which makes them perfectly suitable for the utility scale grid applications The utilities also hold the large number of operation flow battery project till date across the world. Moreover, there are large number of the projects which are under construction which involves the installation of redox flow battery and are expected to drive the market.
Redox Flow Battery Market, by Region
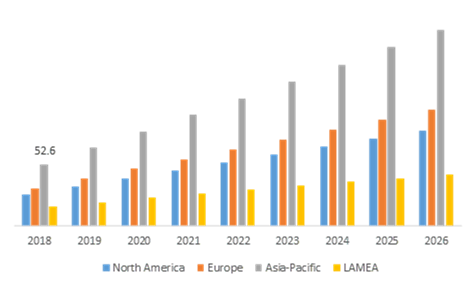
Asia-Pacific accounted to be the most profitable region for the investor to invest in the forecast period.
Source: Research Dive Analysis
The adoption of redox flow batteries in large numbers the regions like UK and Canada and the government initiatives to encourage the usage of renewable energy sources are expected to drive the market in these regions. North America region market was valued for $26.8 million in 2018 and is predicted to grow by generating a revenue of $81.2 million by 2026. Asia-Pacific accounted for the highest growth rate in the forecast period. Due to the existence of many developing countries and the government initiative for the use of renewable energy is predicted to give boost to the market. Asia-Pacific market was $52.6 million in 2018 and is predicted to grow by generating a revenue of $166.9 million by 2026.
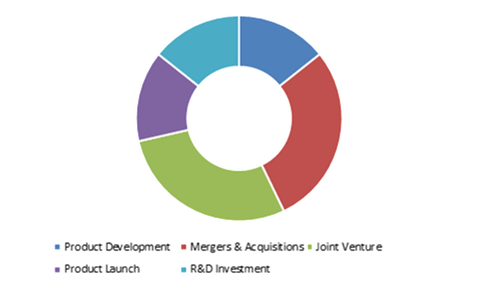
Key Players in the Redox Flow Battery
Source: Research Dive Analysis
The major redox flow battery manufacturers in the market are Sumitomo electric industries ltd., SCHMID Group, Uni energy Technologies, Vionx Energy, VRB Energy, Vizn Energy system, Primus power, RedT energy PLC., ESS Inc. and Reflow, among other.
| Aspect | Particulars |
| Historical Market Estimations | 2018-2019 |
| Base Year for Market Estimation | 2018 |
| Forecast timeline for Market Projection | 2019-2026 |
| Geographical Scope | North America, Europe, Asia-Pacific, LAMEA |
| Segmentation by Material |
|
| Segmentation by End use |
|
| Key Countries Covered | U.S., Canada, Germany, France, UK, Italy, Japan, China, India, South Korea, Australia, Middle west, Africa |
| Key Companies Profiled |
|
Source: Research Dive Analysis
Q1. What is the size of Redox flow battery?
A. The global Redox flow battery size was over $127.8 million in 2018, and is further anticipated to reach $390.9 million by 2026.
Q2. Which are the leading companies in the Redox flow battery?
A. VRB Energy, Vizn Energy system and Primus power are some of the key players in the global Redox flow battery.
Q3. Which region possesses greater investment opportunities in the coming future?
A. Asia-Pacific possess great investment opportunities for the investors to witness the most promising growth in the coming years.
Q4. What is the growth rate of North America?
A. Asia-Pacific Redox flow battery is projected to grow at 13.5% CAGR during the forecast period.
Q5. What are the strategies opted by the leading players in this market?
A. Product development is the key strategies opted by the operating companies in this redox flow battery market.
Q6. Which companies are investing more on R&D practices?
A. VRB Energy, Vizn Energy system and Primus power are the companies investing more on R&D activities for developing new products and technologies.
1. Research Methodology
1.1. Desk Research
1.2. Real time insights and validation
1.3. Forecast model
1.4. Assumptions and forecast parameters
1.4.1. Assumptions
1.4.2. Forecast parameters
1.5. Data sources
1.5.1. Primary
1.5.2. Secondary
2. Executive Summary
2.1. 360° summary
2.2. Type trends
2.3. Application trends
3. Market Overview
3.1. Market segmentation & definitions
3.2. Key takeaways
3.2.1. Top investment pockets
3.2.2. Top winning strategies
3.3. Porter’s five forces analysis
3.3.1. Bargaining power of consumers
3.3.2. Bargaining power of suppliers
3.3.3. Threat of new entrants
3.3.4. Threat of substitutes
3.3.5. Competitive rivalry in the market
3.4. Market dynamics
3.4.1. Drivers
3.4.2. Restraints
3.4.3. Opportunities
3.5. Technology landscape
3.6. Regulatory landscape
3.7. Patent landscape
3.8. Pricing overview
3.8.1. By type
3.8.2. By application
3.8.3. By region
3.9. Market value chain analysis
3.9.1. Stress point analysis
3.9.2. Raw material analysis
3.9.3. Manufacturing process
3.9.4. Distribution channel analysis
3.9.5. Operating vendors
3.9.5.1. Raw material suppliers
3.9.5.2. Product manufacturers
3.9.5.3. Product distributors
3.10. Strategic overview
4. Redox Flow Battery Market, by Material
4.1. Vanadium
4.1.1. Market size and forecast, by region, 2017-2028
4.1.2. Comparative market share analysis, 2018 & 2028
4.2. Hybrid
4.2.1. Market size and forecast, by region, 2017-2028
4.2.2. Comparative market share analysis, 2018 & 2028
5. Redox Flow Battery Market, by Application
5.1. Utility Services
5.1.1. Market size and forecast, by region, 2017-2028
5.1.2. Comparative market share analysis, 2018 & 2028
5.2. Renewable Energy Integration
5.2.1. Market size and forecast, by region, 2017-2028
5.2.2. Comparative market share analysis, 2018 & 2028
5.3. UPS
5.3.1. Market size and forecast, by region, 2017-2028
5.3.2. Comparative market share analysis, 2018 & 2028
5.4. Others
5.4.1. Market size and forecast, by region, 2017-2028
5.4.2. Comparative market share analysis, 2018 & 2028
6. Redox Flow Battery Market, by Region
6.1. North Region
6.1.1. Market size and forecast, by type, 2017-2028
6.1.2. Market size and forecast, by application, 2017-2028
6.1.3. Market size and forecast, by country, 2017-2028
6.1.4. Comparative market share analysis, 2018 & 2028
6.1.5. U.S
6.1.5.1. Market size and forecast, by type, 2017-2028
6.1.5.2. Market size and forecast, by application, 2017-2028
6.1.5.3. Comparative market share analysis, 2018 & 2028
6.1.6. Canada
6.1.6.1. Market size and forecast, by type, 2017-2028
6.1.6.2. Market size and forecast, by application, 2017-2028
6.1.6.3. Comparative market share analysis, 2018 & 2028
6.2. Europe
6.2.1. Market size and forecast, by type, 2017-2028
6.2.2. Market size and forecast, by application, 2017-2028
6.2.3. Market size and forecast, by country, 2017-2028
6.2.4. Comparative market share analysis, 2018 & 2028
6.2.5. UK
6.2.5.1. Market size and forecast, by type, 2017-2028
6.2.5.2. Market size and forecast, by application, 2017-2028
6.2.5.3. Comparative market share analysis, 2018 & 2028
6.2.6. Germany
6.2.6.1. Market size and forecast, by type, 2017-2028
6.2.6.2. Market size and forecast, by application, 2017-2028
6.2.6.3. Comparative market share analysis, 2018 & 2028
6.2.7. France
6.2.7.1. Market size and forecast, by type, 2017-2028
6.2.7.2. Market size and forecast, by application, 2017-2028
6.2.7.3. Comparative market share analysis, 2018 & 2028
6.2.8. Italy
6.2.8.1. Market size and forecast, by type, 2017-2028
6.2.8.2. Market size and forecast, by application, 2017-2028
6.2.8.3. Comparative market share analysis, 2018 & 2028
6.2.9. Rest of Europe
6.2.9.1. Market size and forecast, by type, 2017-2028
6.2.9.2. Market size and forecast, by application, 2017-2028
6.2.9.3. Comparative market share analysis, 2018 & 2028
6.3. Asia-Pacific
6.3.1. Market size and forecast, by type, 2017-2028
6.3.2. Market size and forecast, by application, 2017-2028
6.3.3. Market size and forecast, by country, 2017-2028
6.3.4. Comparative market share analysis, 2018 & 2028
6.3.5. China
6.3.5.1. Market size and forecast, by type, 2017-2028
6.3.5.2. Market size and forecast, by application, 2017-2028
6.3.5.3. Comparative market share analysis, 2018 & 2028
6.3.6. India
6.3.6.1. Market size and forecast, by type, 2017-2028
6.3.6.2. Market size and forecast, by application, 2017-2028
6.3.6.3. Comparative market share analysis, 2018 & 2028
6.3.7. Japan
6.3.7.1. Market size and forecast, by type, 2017-2028
6.3.7.2. Market size and forecast, by application, 2017-2028
6.3.7.3. Comparative market share analysis, 2018 & 2028
6.3.8. South Korea
6.3.8.1. Market size and forecast, by type, 2017-2028
6.3.8.2. Market size and forecast, by application, 2017-2028
6.3.8.3. Comparative market share analysis, 2018 & 2028
6.3.9. Australia
6.3.9.1. Market size and forecast, by type, 2017-2028
6.3.9.2. Market size and forecast, by application, 2017-2028
6.3.9.3. Comparative market share analysis, 2018 & 2028
6.3.10. Rest of Asia Pacific
6.3.10.1. Market size and forecast, by type, 2017-2028
6.3.10.2. Market size and forecast, by application, 2017-2028
6.3.10.3. Comparative market share analysis, 2018 & 2028
6.4. LAMEA
6.4.1. Market size and forecast, by type, 2017-2028
6.4.2. Market size and forecast, by application, 2017-2028
6.4.3. Market size and forecast, by country, 2017-2028
6.4.4. Comparative market share analysis, 2018 & 2028
6.4.5. Middle East
6.4.5.1. Market size and forecast, by type, 2017-2028
6.4.5.2. Market size and forecast, by application, 2017-2028
6.4.5.3. Comparative market share analysis, 2018 & 2028
6.4.6. Africa
6.4.6.1. Market size and forecast, by type, 2017-2028
6.4.6.2. Market size and forecast, by application, 2017-2028
6.4.6.3. Comparative market share analysis, 2018 & 2028
7. Company Profiles
7.1. Sumitomo electric industries ltd.
7.1.1. Business overview
7.1.2. Financial performance
7.1.3. Product portfolio
7.1.4. Recent strategic moves & developments
7.1.5. SWOT analysis
7.2. SCHMID Group
7.2.1. Business overview
7.2.2. Financial performance
7.2.3. Product portfolio
7.2.4. Recent strategic moves & developments
7.2.5. SWOT analysis
7.3. Fitbit
7.3.1. Business overview
7.3.2. Financial performance
7.3.3. Product portfolio
7.3.4. Recent strategic moves & developments
7.3.5. SWOT analysis
7.4. Uni energy Technologies
7.4.1. Business overview
7.4.2. Financial performance
7.4.3. Product portfolio
7.4.4. Recent strategic moves & developments
7.4.5. SWOT analysis
7.5. Vionx Energy
7.5.1. Business overview
7.5.2. Financial performance
7.5.3. Product portfolio
7.5.4. Recent strategic moves & developments
7.5.5. SWOT analysis
7.6. VRB Energy
7.6.1. Business overview
7.6.2. Financial performance
7.6.3. Product portfolio
7.6.4. Recent strategic moves & developments
7.6.5. SWOT analysis
7.7. Vizn Energy system
7.7.1. Business overview
7.7.2. Financial performance
7.7.3. Product portfolio
7.7.4. Recent strategic moves & developments
7.7.5. SWOT analysis
7.8. Primus power
7.8.1. Business overview
7.8.2. Financial performance
7.8.3. Product portfolio
7.8.4. Recent strategic moves & developments
7.8.5. SWOT analysis
7.9. RedT energy PLC.
7.9.1. Business overview
7.9.2. Financial performance
7.9.3. Product portfolio
7.9.4. Recent strategic moves & developments
7.9.5. SWOT analysis
7.10. ESS Inc.
7.10.1. Business overview
7.10.2. Financial performance
7.10.3. Product portfolio
7.10.4. Recent strategic moves & developments
7.10.5. SWOT analysis
7.11. Reflow
7.11.1. Business overview
7.11.2. Financial performance
7.11.3. Product portfolio
7.11.4. Recent strategic moves & developments
7.11.5. SWOT analysis
The world is in an urgent need for intensive actions against the growing climatic changes. The rising discharge of carbon dioxide is significantly affecting the ecosphere and is showing adverse effects on the earth’s atmosphere. Hence, the world is now in need of an ecofriendly option to produce energy—and one among them is energy generated from renewable sources such as solar and wind energy. The electricity segment is considered as the brightest spot for renewables with the rapid growth of solar photovoltaics and wind in the near future. The renewable energy sector is anticipated to go in a new phase of growth due to the rising demand from various sectors, its cost effectiveness, and growth in the innovations & advancements in electricity sector.
However, since past few years, the demand for storage has amplified extensively with the growth in the use of renewable sources. To cope up with this demand, battery technologies are getting better day by day. And one such advancement in the storage battery technology, is the invention of redox flow batteries for energy storage needs. A redox flow battery is basically an electrochemical energy storage unit that converts chemical energy into electrical energy by means of reduction of working fluids and reversible oxidation.
Growing demand for redox flow batteries
The growing use of renewable resources and the long life of the batteries are considered to be the key driving factors for the redox flow battery industry. Moreover, the growing installations of wind and solar power plants are anticipated to fuel the market growth. These batteries are well-equipped in shifting the time required to generate the power for the further usage. Thus, they are an ideal choice for creating a balance in the renewable sources such as wind and solar energy during the process of shifting power. To put it simply, these batteries function as a source of backup for power supply.
Nowadays, government bodies from several regions are taking initiative and promoting the usage of rechargeable redox flow batteries over the normal batteries. This is because normal batteries discharge some harmful substances such as cadmium, lead, and mercury into the environment which are seen as threat to the ecosystem. These batteries have a lifecycle of 40 years and the durability can be easily extended by growing the number of tanks and electrolyte. Hence, the durability of these batteries is considered to be the major driving factor the growth of the market.
Recent developments in the redox flow battery industry
A research report by Research Dive, states that the global market for redox flow batteries is expected to show tremendous growth with a CAGR of 13.5% from 2019 to 2026. Considering the growing demand for redox flow batteries, several manufacturers in the market are undertaking activities such as merges, collaborations, partnerships, new products developments, and geographical expansions.
Recently, JenaBatteries GmbH, an innovative company in the field of large-scale energy storage solutions and BASF, a German chemical company and the second largest chemical producer in the world are collaborating for producing an electrolyte for batteries that are mainly used for stabilizing conventional transmission grids and for stationary storage of energy generated from renewable resources.
JenaBatteries, has established the technique of redox flow battery (RFB) with organic materials. It is the foremost commercially accessible technology of this type. Apart from this, some of other market players prominent in the redox flow battery industry are Sumitomo electric industries ltd., Uni energy Technologies, SCHMID Group, VRB Energy, Vizn Energy system, RedT energy PLC., Primus power, Vionx Energy, ESS Inc., Reflow, and others.
Future of redox flow battery industry
Redox flow batteries are projected to have outstanding growth opportunities because of the growing technological developments in the next few years. Looking at the redox chemistry and technical essentials of flow batteries it can be predicted that the market for redox flow batteries is sure to witness industrial success and growth in the demand in the near future.
Personalize this research
- Triangulate with your own data
- Request your format and definition
- Get a deeper dive on a specific application, geography, customer or competitor
- + 1-888-961-4454 Toll - Free
- support@researchdive.com
