Mobile Value-added Services Market Report
RA05055
Mobile Value-added Services Market by Solution (Short Messaging Service (SMS), Multimedia Messaging Service (MMS), Location Based Services, Mobile Email & Instant Messaging, Mobile Money, Mobile Advertising, and Mobile Infotainment), End User (Small & Medium Enterprises and Large Enterprises), Vertical Type (BFSI, Media & Entertainment, Healthcare, Education, Retail, Government, Telecom & IT, and Others), and Regional Analysis: Global Opportunity Analysis and Industry Forecast, 2020–2027
Mobile Value-added Services Market Analysis
The global mobile value-added services market was valued at $479.0 billion in 2019, and is projected to reach $1,464.1 billion by 2027, at a CAGR of 15.3%.
Market Synopsis
Increase in the usage of mobile applications and mobile web is one of the major factors driving the growth of the mobile value-added services market. Increase in the usage of social networking applications and adoption of mobile payments is helping support the mobile value-added services market size.
Lack of guidelines and regulatory framework for the various market players of mobile value-added services (MVAS) that are accountable for consumer rights, data privacy and legal liabilities may limit the users and might restrict them from using mobile value-added services.
Asia-Pacific was the highest revenue contributor, accounting for $153.9 billion in 2019 and is estimated to grow with a CAGR of 14.90%.
Mobile Value-added Services Market Overview
Valued-added services are referred to as non-core services offered in a telecom industry. Mobile value-added service is a feature that can be added to a core product, offered by mobile operators through third-party mobile service providers as well as on their own apart from voice communication services. For instance, text messages, missed call alerts, call forwarding, call block are considered as mobile value-added services and are added to enhance the user experience.
Impact Analysis of COVID-19 on the Global Mobile Value-added Services Market
The coronavirus pandemic has unleashed a series of unprecedented events affecting every industry. With the continuing spread of the novel coronavirus pandemic, organizations across the globe are gradually flattening their recessionary curve by leveraging technology. Many businesses will go through response, recovery and renew phases. Building business resilience and enabling agility will aid organizations to move forward in their journey out of the COVID-19 crisis towards the next normal. The mobile value-added services (VAS) market is predicted to witness a positive impact during the forecast period owing to the widespread growth of the COVID-19 pandemic. For instance, stay-at-home orders have introduced many people to apps that enable them to order takeout food or groceries online, and when they do go to the store, more people are choosing to pay with their phones instead of touching cash or credit cards. Moreover, the mobile value-added services like video calling services have also increased as a result of the contactless measures undertaken by the government bodies to minimize the spread of coronavirus.
Increasing Usage of Mobile Applications to be an Important Factor for the Growth the Market
Increase in the usage of mobile applications and mobile web is one of the major factors driving the growth of the mobile value-added services market. Increase in the social networking applications and mobile payments is helping support the mobile value-added services market size. Rising demand for entertainment services on mobile software’s is also a key-trend being witnessed in the mobile value-added services market, thereby resulting in the growth of online video content, live TV shows & events and localized vernacular content.
To know more about global mobile value-added services market drivers, get in touch with our analysts here.
Lack of Guidelines of Mobile Value-added Services may Affect the Growth of the Market
Lack of guidelines and regulatory framework for various market players of mobile value-added services (MVAS) may limit the users and restrict them from using mobile value-added services. With the increase in technological advancements and new innovations, it is important to safeguard the data and information of value-added service users. Lack of privacy is the key challenge faced by mobile value-added service market. Furthermore, lack of government initiatives and limited ways of consumer authentications for the services that involve exchange of sensitive information such as payments may also limit the market’s growth.
Advancements in Technology to Create Major Investment Opportunities
Mobile value-added services are the additional features provided by the service operators at a premium to their customers along with other voice communication services. Increase in the usage of mobiles, smartphones and tablets along with the rollout of technologies like 4G and 5G network services in the market has created significant opportunities for the mobile value-added service providers. Moreover, the recent COVID-19 pandemic has accelerated digitization and remote activities and is further expected to provide plenty of opportunities for value-added services. In addition to this, rising demand for entertainment services on mobile handsets is also a key trend being witnessed in the market, thereby resulting into the development of key opportunities in on-demand music & video content, live TV shows & events and localized vernacular content.
Mobile Value-added Services Market, by Solution
On the basis of solution, mobile value-added services are segmented into short messaging service (SMS), multimedia messaging service (mms), location-based services, mobile email & instant messaging, mobile money, mobile advertising, and mobile infotainment. Among these, short messaging services is anticipated to hold the maximum share of the global market revenue.

Source: Research Dive Analysis
Short messaging services is expected to hold a significant market share in the forecast period. The short messaging service (SMS) sub-segment was the highest contributor to the market, with $94.1 billion in 2019, and is estimated to grow at a CAGR of 14.2% during the forecast period. The increased usage of short messaging services with the increased use of smartphones is rising the markets growth. Moreover, brands have increasingly found value in SMS marketing due to the fact that it earns higher open rates, engagement and click-through rates.
Mobile Value-added Services Market, by End-User
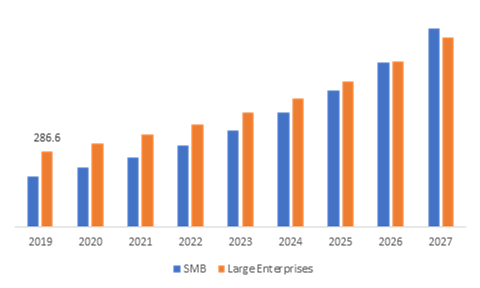
On the basis of end-user, mobile value-added services are bifurcated into small & medium businesses and large enterprises. Among these, large enterprises is anticipated to hold the maximum share of the global market revenue.
Source: Research Dive Analysis
The large enterprises sub-segment was the highest contributor to the market, with $286.6 billion in 2019, and is estimated to grow at a CAGR of 12.4% during the forecast period. Due to the large-scale business economy, large companies are able to reduce the cost of business, while also maximizing their profit margins. This major advantage of large business economy is creating opportunities and paving the growth of the large enterprises.
Mobile Value-added Services Market, by Vertical type
On the basis of vertical type, mobile value-added services are segmented into BFSI, media & entertainment, healthcare, education, retail, government, telecom & IT, and others. The government sector sub-segment is predicted to be the fastest growing.

Source: Research Dive Analysis
The government sub-segment was the highest contributor to the market, with $104.4 billion in 2019, and is estimated to grow at a CAGR of 14.0% during the forecast period. Increasing Internet services, advanced SMS services, and demand for high-end content from the consumers are predicated to boost the MVAS market growth in the near future. For instance, in India, the telecom players along with the government are investing in improving the infrastructure connectivity in rural regions to offer their services. In the urban region, MVAS players focus on providing additional VAS on mobile platforms due to the introduction of digital technologies.
Mobile Value-added Services Market, Regional Insights
The mobile value-added services market was investigated across North America, Europe, Asia-Pacific, and LAMEA.

Source: Research Dive Analysis
The Market for Mobile Value-Added Services in Asia-Pacific to be the Most Dominant
Asia-Pacific was the highest revenue contributor to the global market, accounting for $153.9 billion in 2019 and is estimated to reach $455.8 billion by 2027, with a CAGR of 14.9%. The increasing prevalence of smartphones in emerging economies such as China and India are driving the APAC MVAS market. Additionally, the reduced smartphone prices due to increased competition among manufacturers and service providers are further expected to expand the consumer base and thereby aid the mobile value-added services market. According to the India Brand Equity Foundation, India currently has the second-largest consumer base in the telecommunications market, with nearly 1.2 billion registered subscribers.
The Market for Mobile Value-Added Services in Europe to be the Fastest Growing
The market in Europe is the fastest growing, accounting for $124.9 billion in 2019 and estimated to reach $394.9 billion by 2027, at a significant CAGR of 15.8%. Europe is expected to be the fastest growing due to the increased internet penetration across the region. The European enterprise MVAS market is fairly evolved, combining technological innovation with demand forces that continue to facilitate the further expansion of services. The increasing penetration of long-term evolution (LTE) and smartphones, the adoption of MVAS platforms, IoT and connected devices and the emergence of FMC networks are the pivotal factors that will drive the growth of MVAS at enterprises over the coming years in Europe.
Competitive Scenario of Global Mobile Value-added Services Market
Product launches and mergers & acquisitions are common strategies followed by major market players.

Source: Research Dive Analysis
Some of the significant mobile value-added service market players are Mozat, Apple Inc., Vodafone Group plc, Samsung Electronics Co. Ltd., Reliance Industries Ltd., Huawei Investment & Holding Co. Ltd., Onmobile Global Limited, Comviva Technologies, Alphabet Inc., and One97 Communication. Market players prefer inorganic growth strategies to expand into local markets. Mobile value-added service market players are emphasizing more on merger & acquisition and advanced product development. These are the frequent strategies followed by established organizations.
Porter’s Five Forces Analysis for Mobile Value-added Services Market:
- Bargaining Power of Suppliers: Mobile value-added services market contains huge concentration of distributors/suppliers and hence, the distributors/supplier control is expected to be moderate, resulting in moderate bargaining power of dealers.
Hence, the bargaining power of the supplier is moderate. - Bargaining Power of Buyers: Buyers will have high bargaining power, significantly because of high players operating in the mobile value-added services market.
Hence, the bargaining power of the buyer is high. - Threat of New Entrants: In the modern world, new entrants may face multiple new barriers, like legal and government policies.
Hence, the threat of the new entrants is moderate. - Threat of Substitutes: There are many alternate products released by different companies for mobile value-added services. For instance, video calling services like google meet, zoom, WhatsApp video calling and many more.
Thus, the threat of substitutes is high. - Competitive Rivalry in the Market: Robust presence of key players such as Apple Inc., Vodafone Group plc, and Samsung Electronics Co. Ltd. is creating massive rivalry in the local as well as international market. Also, high spending on research, business expansion, and strategic tie-ups are some of the main factors rising competitive rivalry among the companies.
Competitive rivalry in the market is high.
| Aspect | Particulars |
| Historical Market Estimations | 2019-2020 |
| Base Year for Market Estimation | 2019 |
| Forecast timeline for Market Projection | 2020-2027 |
| Geographical Scope | North America, Europe, Asia-Pacific, LAMEA |
| Segmentation by Type |
|
| Segmentation by organization type |
|
| Segmentation by Vertical type |
|
| Key Companies Profiled |
|
Q1. What is the size of the global mobile value-added services market?
A. The global mobile value-added services market was valued at $479.0 billion in 2019, and is projected to reach $1,464.1 billion by 2027, at a CAGR of 15.3%.
Q2. Which are the major companies in the mobile value-added services market?
A. Apple Inc., Vodafone Group plc, and Samsung Electronics Co. Ltd. are some of the key players in the global mobile value-added services market.
Q3. Which region possesses greater investment opportunities in the coming future?
A. The Asia-Pacific region possesses great investment opportunities for investors to witness the most promising growth in the future.
Q4. What is the growth rate of the Asia-Pacific mobile value-added services market?
A. The Asia-Pacific mobile value-added services market was valued at $153.9 billion in 2019, and is estimated to reach $455.8 billion by 2027, with a CAGR of 14.9%.
Q5. What are the strategies opted by the leading players in this market?
A. Technological development and strategic partnerships are the key strategies opted by the operating companies in this market.
Q6. Which companies are investing more on R&D practices?
A. Reliance industries Ltd., Huawei investment & holding co. ltd., and Onmobile global limited are investing more on R&D activities for developing new products and technologies.
1.Research Methodology
1.1.Desk Research
1.2.Real time insights and validation
1.3.Forecast model
1.4.Assumptions and forecast parameters
1.4.1.Assumptions
1.4.2.Forecast parameters
1.5.Data sources
1.5.1.Primary
1.5.2.Secondary
2.Executive Summary
2.1.360° summary
2.2.By Solution trends
2.3.By End-user trends
2.4.By vertical trends
3.Market overview
3.1.Market segmentation & definitions
3.2.Key takeaways
3.2.1.Top investment pockets
3.2.2.Top winning strategies
3.3.Porter’s five forces analysis
3.3.1.Bargaining power of consumers
3.3.2.Bargaining power of suppliers
3.3.3.Threat of new entrants
3.3.4.Threat of substitutes
3.3.5.Competitive rivalry in the market
3.4.Market dynamics
3.4.1.Drivers
3.4.2.Restraints
3.4.3.Opportunities
3.5.Technology landscape
3.6.Regulatory landscape
3.7.Patent landscape
3.8.Market value chain analysis
3.8.1.Stress point analysis
3.8.2.Raw material analysis
3.8.3.Manufacturing process
3.8.4.Distribution channel analysis
3.8.5.Operating vendors
3.8.5.1.Raw material suppliers
3.8.5.2.Product manufacturers
3.8.5.3.Product distributors
3.9.Strategic overview
4.Mobile Value-Added Services (MVAS) Market, by Solution
4.1.Short Messaging Services (SMS)
4.1.1.Market size and forecast, by region, 2019-2027
4.1.2.Comparative market share analysis, 2019 & 2027
4.2.Multimedia Messaging Services (MMS)
4.2.1.Market size and forecast, by region, 2019-2027
4.2.2.Comparative market share analysis, 2019 & 2027
4.3.Location Based Services
4.3.1.Market size and forecast, by region, 2019-2027
4.3.2.Comparative market share analysis, 2019 & 2027
4.4.Mobile Email & IM
4.4.1.Market size and forecast, by region, 2019-2027
4.4.2.Comparative market share analysis, 2019 & 2027
4.5.Mobile Money
4.5.1.Market size and forecast, by region, 2019-2027
4.5.2.Comparative market share analysis, 2019 & 2027
4.6.Mobile Advertising
4.6.1.Market size and forecast, by region, 2019-2027
4.6.2.Comparative market share analysis, 2019 & 2027
4.7.Mobile Infotainment
4.7.1.Market size and forecast, by region, 2019-2027
4.7.2.Comparative market share analysis, 2019 & 2027
4.8.Others
4.8.1.Market size and forecast, by region, 2019-2027
4.8.2.Comparative market share analysis, 2019 & 2027
5.Mobile Value-Added Services (MVAS) Market, by End-user
5.1.Small and Medium Enterprises
5.1.1.Market size and forecast, by region, 2019-2027
5.1.2.Comparative market share analysis, 2019 & 2027
5.2.Large Enterprises
5.2.1.Market size and forecast, by region, 2019-2027
5.2.2.Comparative market share analysis, 2019 & 2027
6.Mobile Value-Added Services (MVAS) Market, by Vertical
6.1.Media and Entertainment
6.1.1.Market size and forecast, by region, 2019-2027
6.1.2.Comparative market share analysis, 2019 & 2027
6.2.Healthcare
6.2.1.Market size and forecast, by region, 2019-2027
6.2.2.Comparative market share analysis, 2019 & 2027
6.3.Education
6.3.1.Market size and forecast, by region, 2019-2027
6.3.2.Comparative market share analysis, 2019 & 2027
6.4.Retail
6.4.1.Market size and forecast, by region, 2019-2027
6.4.2.Comparative market share analysis, 2019 & 2027
6.5.Government
6.5.1.Market size and forecast, by region, 2019-2027
6.5.2.Comparative market share analysis, 2019 & 2027
6.6.Telecom & IT
6.6.1.Market size and forecast, by region, 2019-2027
6.6.2.Comparative market share analysis, 2019 & 2027
6.7.Others
6.7.1.Market size and forecast, by region, 2019-2027
6.7.2.Comparative market share analysis, 2019 & 2027
6.8.North America
6.8.1.Market size and forecast, by Solution, 2019-2027
6.8.2.Market size and forecast, by End-user, 2019-2027
6.8.3.Market size and forecast, by Vertical, 2019-2027
6.8.4.Market size and forecast, by country, 2019-2027
6.8.5.Comparative market share analysis, 2019 & 2027
6.8.6.U.S.
6.8.6.1.Market size and forecast, by Solution, 2019-2027
6.8.6.2.Market size and forecast, by End-user, 2019-2027
6.8.6.3.Market size and forecast, by vertical, 2019-2027
6.8.6.4.Comparative market share analysis, 2019 & 2027
6.8.7.Canada
6.8.7.1.Market size and forecast, by Solution, 2019-2027
6.8.7.2.Market size and forecast, by End-user, 2019-2027
6.8.7.3.Market size and forecast, by vertical, 2019-2027
6.8.7.4.Comparative market share analysis, 2019 & 2027
6.8.8.Mexico
6.8.8.1.Market size and forecast, by Solution, 2019-2027
6.8.8.2.Market size and forecast, by End-user, 2019-2027
6.8.8.3.Market size and forecast, by vertical, 2019-2027
6.8.8.4.Comparative market share analysis, 2019 & 2027
6.9.Europe
6.9.1.Market size and forecast, by Solution, 2019-2027
6.9.2.Market size and forecast, by End-user, 2019-2027
6.9.3.Market size and forecast, by vertical, 2019-2027
6.9.4.Market size and forecast, by country, 2019-2027
6.9.5.Comparative market share analysis, 2019 & 2027
6.9.6.Germany
6.9.6.1.Market size and forecast, by Solution, 2019-2027
6.9.6.2.Market size and forecast, by End-user, 2019-2027
6.9.6.3.Market size and forecast, by vertical, 2019-2027
6.9.6.4.Comparative market share analysis, 2019 & 2027
6.9.7.UK
6.9.7.1.Market size and forecast, by Solution, 2019-2027
6.9.7.2.Market size and forecast, by End-user, 2019-2027
6.9.7.3.Market size and forecast, by vertical, 2019-2027
6.9.7.4.Comparative market share analysis, 2019 & 2027
6.9.8.France
6.9.8.1.Market size and forecast, by Solution, 2019-2027
6.9.8.2.Market size and forecast, by End-user, 2019-2027
6.9.8.3.Market size and forecast, by vertical, 2019-2027
6.9.8.4.Comparative market share analysis, 2019 & 2027
6.9.9.Spain
6.9.9.1.Market size and forecast, by Solution, 2019-2027
6.9.9.2.Market size and forecast, by End-user, 2019-2027
6.9.9.3.Market size and forecast, by vertical, 2019-2027
6.9.9.4.Comparative market share analysis, 2019 & 2027
6.9.10.Italy
6.9.10.1.Market size and forecast, by Solution, 2019-2027
6.9.10.2.Market size and forecast, by End-user, 2019-2027
6.9.10.3.Market size and forecast, by vertical, 2019-2027
6.9.10.4.Comparative market share analysis, 2019 & 2027
6.9.11.Rest of Europe
6.9.11.1.Market size and forecast, by Solution, 2019-2027
6.9.11.2.Market size and forecast, by End-user, 2019-2027
6.9.11.3.Market size and forecast, by vertical, 2019-2027
6.9.11.4.Comparative market share analysis, 2019 & 2027
6.10.Asia Pacific
6.10.1.Market size and forecast, by Solution, 2019-2027
6.10.2.Market size and forecast, by End-user, 2019-2027
6.10.3.Market size and forecast, by vertical, 2019-2027
6.10.4.Market size and forecast, by country, 2019-2027
6.10.5.Comparative market share analysis, 2019 & 2027
6.10.6.China
6.10.6.1.Market size and forecast, by Solution, 2019-2027
6.10.6.2.Market size and forecast, by End-user, 2019-2027
6.10.6.3.Market size and forecast, by vertical, 2019-2027
6.10.6.4.Comparative market share analysis, 2019 & 2027
6.10.7.India
6.10.7.1.Market size and forecast, by Solution, 2019-2027
6.10.7.2.Market size and forecast, by End-user, 2019-2027
6.10.7.3.Market size and forecast, by vertical, 2019-2027
6.10.7.4.Comparative market share analysis, 2019 & 2027
6.10.8.Japan
6.10.8.1.Market size and forecast, by Solution, 2019-2027
6.10.8.2.Market size and forecast, by End-user, 2019-2027
6.10.8.3.Market size and forecast, by vertical, 2019-2027
6.10.8.4.Comparative market share analysis, 2019 & 2027
6.10.9.Australia
6.10.9.1.Market size and forecast, by Solution, 2019-2027
6.10.9.2.Market size and forecast, by End-user, 2019-2027
6.10.9.3.Market size and forecast, by vertical, 2019-2027
6.10.9.4.Comparative market share analysis, 2019 & 2027
6.10.10.South Korea
6.10.10.1.Market size and forecast, by Solution, 2019-2027
6.10.10.2.Market size and forecast, by End-user, 2019-2027
6.10.10.3.Market size and forecast, by vertical, 2019-2027
6.10.10.4.Comparative market share analysis, 2019 & 2027
6.10.11.Rest of Asia Pacific
6.10.11.1.Market size and forecast, by Solution, 2019-2027
6.10.11.2.Market size and forecast, by End-user, 2019-2027
6.10.11.3.Market size and forecast, by vertical, 2019-2027
6.10.11.4.Comparative market share analysis, 2019 & 2027
6.11.LAMEA
6.11.1.Market size and forecast, by Solution, 2019-2027
6.11.2.Market size and forecast, by End-user, 2019-2027
6.11.3.Market size and forecast, by vertical, 2019-2027
6.11.4.Market size and forecast, by country, 2019-2027
6.11.5.Comparative market share analysis, 2019 & 2027
6.11.6.Latin America
6.11.6.1.Market size and forecast, by Solution, 2019-2027
6.11.6.2.Market size and forecast, by End-user, 2019-2027
6.11.6.3.Market size and forecast, by vertical, 2019-2027
6.11.6.4.Comparative market share analysis, 2019 & 2027
6.11.7.Middle East
6.11.7.1.Market size and forecast, by Solution, 2019-2027
6.11.7.2.Market size and forecast, by End-user, 2019-2027
6.11.7.3.Market size and forecast, by vertical, 2019-2027
6.11.7.4.Comparative market share analysis, 2019 & 2027
6.11.8.Africa
6.11.8.1.Market size and forecast, by Solution, 2019-2027
6.11.8.2.Market size and forecast, by End-user, 2019-2027
6.11.8.3.Market size and forecast, by vertical, 2019-2027
6.11.8.4.Comparative market share analysis, 2019 & 2027
7.Company profiles
7.1.Mozat
7.1.1.Business overview
7.1.2.Financial performance
7.1.3.Product portfolio
7.1.4.Recent strategic moves & developments
7.1.5.SWOT analysis
7.2.Apple Inc.
7.2.1.Business overview
7.2.2.Financial performance
7.2.3.Product portfolio
7.2.4.Recent strategic moves & developments
7.2.5.SWOT analysis
7.3.Vodafone Group plc
7.3.1.Business overview
7.3.2.Financial performance
7.3.3.Product portfolio
7.3.4.Recent strategic moves & developments
7.3.5.SWOT analysis
7.4.Samsung Electronics Co. Ltd.
7.4.1.Business overview
7.4.2.Financial performance
7.4.3.Product portfolio
7.4.4.Recent strategic moves & developments
7.4.5.SWOT analysis
7.5.Reliance Industries Ltd.
7.5.1.Business overview
7.5.2.Financial performance
7.5.3.Product portfolio
7.5.4.Recent strategic moves & developments
7.5.5.SWOT analysis
7.6.Huawei Investment & Holding Co. Ltd.
7.6.1.Business overview
7.6.2.Financial performance
7.6.3.Product portfolio
7.6.4.Recent strategic moves & developments
7.6.5.SWOT analysis
7.7.Onmobile Global Limited
7.7.1.Business overview
7.7.2.Financial performance
7.7.3.Product portfolio
7.7.4.Recent strategic moves & developments
7.7.5.SWOT analysis
7.8.Comviva Technologies
7.8.1.Business overview
7.8.2.Financial performance
7.8.3.Product portfolio
7.8.4.Recent strategic moves & developments
7.8.5.SWOT analysis
7.9.Alphabet Inc.
7.9.1.Business overview
7.9.2.Financial performance
7.9.3.Product portfolio
7.9.4.Recent strategic moves & developments
7.9.5.SWOT analysis
7.10.One97 Communication
7.10.1.Business overview
7.10.2.Financial performance
7.10.3.Product portfolio
7.10.4.Recent strategic moves & developments
7.10.5.SWOT analysis
A value-added service (VAS) is a common concept in the telecommunications industry for non-core services, or all services other than regular voice calls and fax transmissions. A mobile value-added service, in addition to voice communication services, is a feature that can be added to a core product and offered by mobile operators both by third-party mobile service providers and directly. Text messaging, missed call notifications, call routing, and call blocking, for example, are examples of mobile value-added features that are added to boost the user experience.
Impact of COVID-19 on the Industry
The coronavirus pandemic has triggered a chain of unimaginable events that have affected every industry. With the ongoing spread of the novel coronavirus pandemic, businesses around the world are increasingly flattening their recessionary curves by exploiting technology. Many companies will go through response, rehabilitation, and renewal phases. Building business resilience and enabling agility can help companies step through the COVID-19 crisis and towards the new normal. The global mobile value-added services market is witnessing a massive growth rate amidst the outbreak of the COVID-19 pandemic. The widespread spread of the COVID-19 pandemic is anticipated to have a positive effect on the mobile value-added services (VAS) market during the analysis period. Stay-at-home orders, for example, have introduced more consumers to apps that allow them to order takeout or groceries online, and when they do go to the store, more people are opting to pay with their phones rather than cash or credit cards. Furthermore, as a result of the contactless steps taken by government bodies to reduce the spread of coronavirus, mobile value-added services such as video calling services have increased.
Key Developments in the Industry
The key companies operating in the mobile value-added services market are adopting several growth strategies & business tactics such as mergers & acquisitions, collaborations, partnerships, and launches to maintain a strong position in the overall market, which is subsequently assisting the market to grow across the world.
For instance in March 2021, Logiq, Inc., a global provider of award-winning eCommerce and fintech solutions, joined forces with Comviva, a global leader in digital financial solutions, to offer digital wallet and payment services across Indonesia. The services based on Logiq’s PayLogiq digital wallet will be powered by Comviva’s mobiquity® Pay platform.
Moreover, in March 2021, Reliance Jio Infocomm Ltd (“RJIL”) announced that it has successfully acquired the right to use spectrum in all 22 circles across India in the recently concluded spectrum auctions conducted by Department of Telecommunications, Government of India.
Furthermore, in January 2021, Mobile TeleSystems PJSC, Russia’s largest mobile operator and a leading provider of media and digital services, and Vodafone Group PLC, a leading telecommunications company in Europe and Africa, announced the extension of the companies’ existing strategic partnership through to 2023. The new agreement further builds on the companies’ successful track record of close collaboration across procurement, marketing, and network operations that stretches back to 2008.
Analysis of Mobile Value-added Services Market
One of the major factors driving the growth of the mobile value-added services market is the increased use of mobile apps and mobile web. The growth of social networking apps and mobile payments is supporting the growth of the mobile value-added services market. Increasing demand for entertainment services on mobile software is another key trend that is being observed in the mobile value-added services market, resulting in the growth of online video content, localized vernacular content, and live TV shows and events.
The lack of guidelines and a regulatory framework for the various market players of mobile value-added services (MVAS) who are accountable for data privacy, consumer rights, and legal liabilities may limit users' access to and use of mobile value-added services. With the advancement of technology and new technologies, it is critical to protect data and knowledge. The primary problem that the mobile value-added service market faces is a lack of privacy issues. Furthermore, a lack of government initiatives and restricted user authentication methods for services involving the exchange of sensitive information, such as payments, may restrict the growth of the market.
The increased use of mobiles, smartphones, and tablets, as well as the industry rollout of technology such as 4G and 5G network networks, has provided major growth opportunities for mobile value-added services market. Furthermore, the latest COVID-19 pandemic has intensified digitization and remote activities and is expected to open up new avenues for value-added services. These factors are estimated to surge the growth of the mobile value-added services market, throughout the analysis period. As per a newly published report by Research Dive, the global mobile value-added services market is predicted to garner $1,464.1 billion by 2027. Geographically, Asia-Pacific market for mobile value-added services is estimated to dominate the global industry, owing to the growing prevalence of smartphones in emerging economies such as India and China. The key players operating in the global industry include One97 Communication, Mozat, Alphabet Inc., Apple Inc., Comviva Technologies, Vodafone Group plc, Onmobile Global Limited, Samsung Electronics Co. Ltd., Huawei Investment & Holding Co. Ltd., and Reliance Industries Ltd.
Personalize this research
- Triangulate with your own data
- Request your format and definition
- Get a deeper dive on a specific application, geography, customer or competitor
- + 1-888-961-4454 Toll - Free
- support@researchdive.com
