Augmented Reality In Healthcare Market Report
RA00048
Augmented Reality in Healthcare Market, By Component (Displays, Sensors, Input Devices, Semiconductor Components), By Technology (Wearable, Vision-Based, Spatial, Mobile Device-Based), By End-Use (Research Laboratories, Healthcare Facilities): Global Opportunity Analysis and Industry Forecast, 2019–2026
Update Available On-Demand
The future of Augmented Reality in Healthcare Market 2026:
Global Augmented Reality in Healthcare Market was $321.1 million in 2018, and is projected to generate revenue of $1,565.1 million by 2026, at a CAGR of 21.9%. North America region will dominate the global market during the projected period, owing to the rising demand for consumer devices. As of 2018, the North American healthcare AR industry was valued at $ 141.3 Million. By 2026, that is expected to increase dramatically to $ 664.9 Million.
Market Definition:
Augmented reality is a technology, which allows physician to integrate data visualization into treatment and diagnostic procedures for efficient work and to improve surgical trainings. Augmented reality generate interactive and rich experiences that show how clinical instruments and new drugs interact with the patient’s body. Augmented reality is more user-friendly along with many life science companies are considering its use as an important tool to communicate and engage Healthcare Professionals (HCPs).
AR in Healthcare Market Driving Factors:
Enhancement in the surgeon’s ability to diagnose and perform surgery can boost to the growth of Augmented Reality in Healthcare Market
The significant driving factors for AR in healthcare market includes recent developments in medical imaging technology coupled with rising demand for virtual reality in healthcare industry. Developed accessibility of real time data along with faster diagnosis and treatment of diseases expected to drive the augmented reality in healthcare market growth. Moreover, surgeon can access to 2D and 3D reconstructed images which can be considered as supportive factor during ongoing surgery.
Market Restraints:
Ethical hacking coupled with expensive AR based technology will pose a severe threat to the AR in Healthcare Market growth
High costs along with security and privacy risks associated with augmented reality in healthcare is predicted to restrain the growth of AR in healthcare market. In this technology, there are certain loopholes that can be accessed by the hackers to collect information of many clients. Moreover, the high costs of these procedures will further restrain the market growth.
Market Trends and Investment Opportunities:
Technological advancements will create enormous growth opportunities to the Augmented Reality for Healthcare Market.
Advancements in the clinical field, technical impact along with focusing on the medical specialty will create lucrative opportunities for the growth of augmented reality for healthcare market. In addition, nowadays, surgeons are able to visualize muscles, internal organs and bones and without any surgery. Also, it can be used to display life-saving information for paramedics during a medical emergency.
Augmented Reality in Healthcare Market, by Component:
Augmented Reality for Healthcare Market for displays component is projected to hold a dominant share, owing to the recent innovations
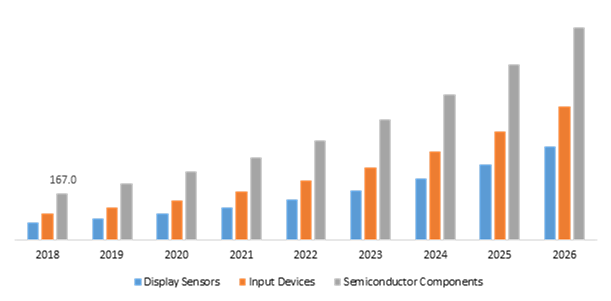
Source: Research Dive Analysis
Displays Component for AR in healthcare market forecast will be $334.5 million by 2026, increasing from $61.0 million in 2018. Component market is mainly fragmented into Displays, Sensors, Input Devices and Semiconductor Components. Displays for augmented reality in healthcare market is anticipated to have the prominent share over the projected period, due to the rising demand for integrated devices such as head mounted displays (HD).
Augmented Reality in Healthcare Market, By Technology:
Mobile-device based technology segment is will a generate revenue of $409.7 Mn by the year of 2026
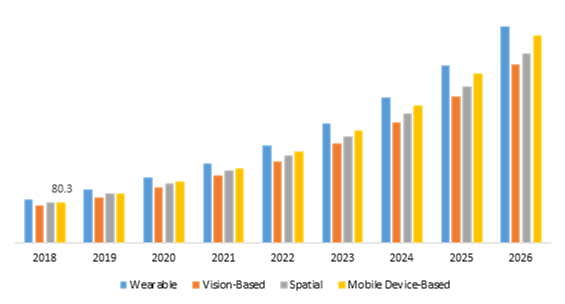
Source: Research Dive Analysis
Mobile-device based technology in AR in Healthcare Market generated a revenue of $80.3 million in 2018, and is projected to reach upto $409.7 million by the end of 2026. On the basis of application, global Augmented Reality of Healthcare Market is segmented into Wearable, Vision-Based, Spatial and Mobile Device-Based. Tablets and smartphones play the significant role in the augmented reality market owing to compass and global positioning system are used in mobile phones for navigation and routing.
Augmented Reality in Healthcare Market, By End-Use:
Healthcare facilities segment is will generate revenue of $3,125.5 Mn by the year of 2026
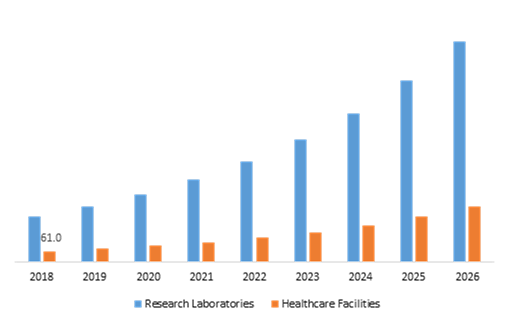
Source: Research Dive Analysis
Healthcare facilities segment is expected to have the major share throughout the projected period. This is due to the rising adoption of technology, as it decreases the stress of healthcare professionals (HCPs) related to the complexity of the whole processes. This market has a size of $61.0 million in 2018 and is expected to reach upto $315.5 million throughout the projected period.
Augmented Reality in Healthcare Market, by Region:
North America region will dominate the global market during the projected period, owing to the rising demand for consumer devices
North America AR in healthcare market share is prominent in 2018 and it has generated revenue of $141.3 million in 2018, and is further projected to generate revenue of $664.9 million by 2026. Rising demand for consumer electronic panels and devices in the U.S., coupled with the adoption of new technologies and advancements in the AR technology are further considered to project the growth of augmented reality in healthcare market.
Asia-Pacific’s market is anticipated to grow up to $349.0 million till 2026. The Asia-Pacific market is expected to be the fastest growing region for AR in healthcare market size. Factor such as lack of skilled expertise and proper healthcare facilities expected to contribute extensively to the growth of the Asia-Pacific AR in healthcare market. In addition, increasing awareness among healthcare industry professionals, coupled with the increasing adoption of new innovations in the developing countries such as Japan, South Korea and India are further predicted to upsurge the augmented reality in healthcare market growth.
Key participants in Global Augmented Reality in Healthcare Market:
Merger & Acquisition and Advanced Product development are the frequent strategies followed by the market players
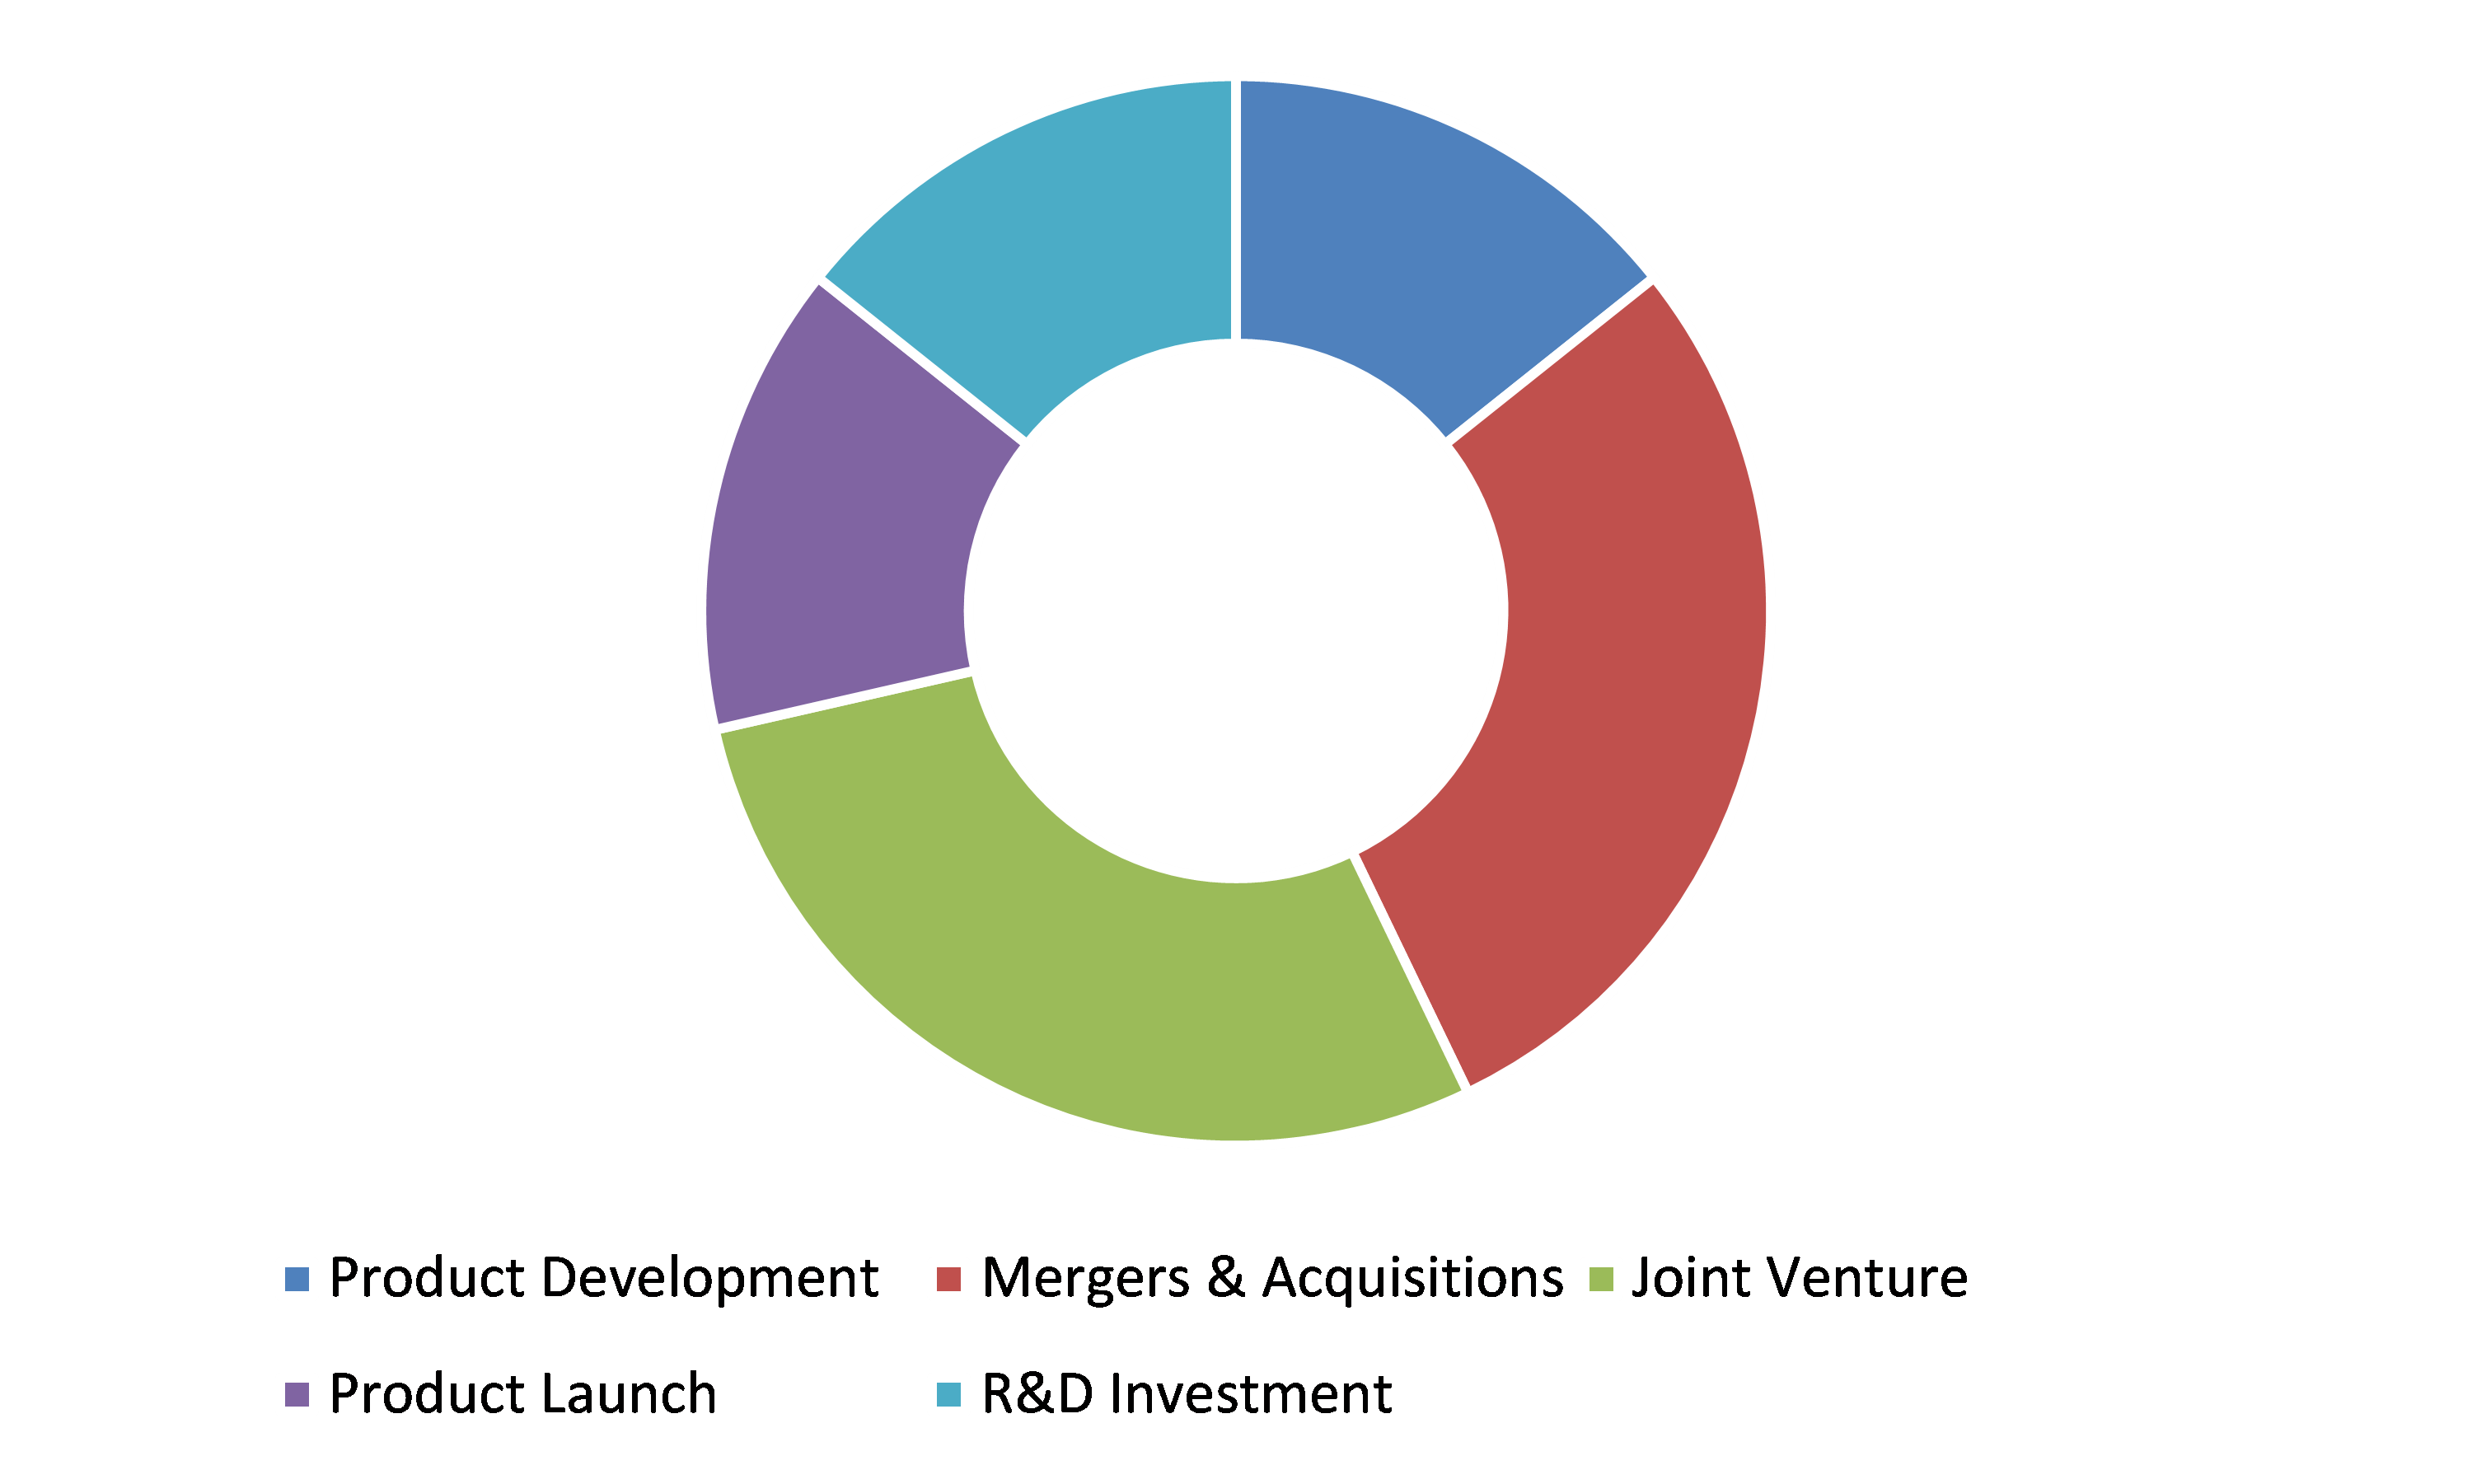
Source: Research Dive Analysis
AR in healthcare market players are Mindmaze, Medical Realities, Wikitude GmbH, CAE Healthcare, 3D Systems, Siemens Healthineers, VirtaMed, Magic Leap. These players are initiating various steps in order strengthen their presence such as merger & acquisitions, new product development.
Porter’s Five Forces for Augmented Reality in Healthcare Market:
Bargaining Power of supplier: Leading suppliers of the AR in healthcare market use negotiating power to gain higher prices. In addition, the higher switching cost and the lower concentration of suppliers of this market provides high bargaing power to the suppliers. The bargaining power of suppliers is HIGH.
Bargaining Power of Buyer: Manufacturers of this market are less.Moreover, increasing demand for AR services in healthcare from customer base, rising technological evolutions and advancements in products and services gives more negotiation powers to the established companies.Thus, the bargaining power of buyers is LOW.
Threat of substitute: There is no alternative for AR in healthcare. So it is very low risk is provided from the substitute of this market. So, the threat of substitutes in this market is VERY LOW.
Threat of new entrants: The higher cost associated with R&D and higher initial investment are obstructing to emerging companies of this market.However, many startups are foucusing highly on product innovation. For instance, Proximie is offering integrated application, which has ability to pair with most computers, smartphones or tablets with cameras to connect with surgeons. So, the threat of new entrants in this market is MEDIUM.
Competitive rivalry: There is an extreme level of competition in the global healthcare industry, propelling organizations to aim in order to maintain the current buyers through offering services at reasonable prices. Market leaders are following multiple product/service development strategies such as enhancement in diagnosis, advanced augmented surgeries, and many others. So, the competitive rivalry in this market is MEDIUM.
| Aspect | Particulars |
| Historical Market Estimations | 2018-2019 |
| Base Year for Market Estimation | 2018 |
| Forecast timeline for Market Projection | 2019-2026 |
| Geographical Scope | North America, Europe, Asia-Pacific, LAMEA |
| Segmentation by Component |
|
| Segmentation by Technology |
|
| By End-Use |
|
| Key Countries covered | U.S., Canada, Germany, France, Spain, Russia, Japan, China, India, South Korea, Australia, Brazil, and Saudi Arabia |
| Key Companies Profiled |
|
Source: Research Dive Analysis
Q1. What is the size of Augmented Reality in Healthcare Market?
A. The global augmented reality in healthcare market size was over $1,565.6 million in 2018, and is further anticipated to reach $1,565.1 million by 2026.
Q2. Who are the leading companies in the Augmented Reality in Healthcare Market?
A. CAE Healthcare, Siemens Healthineers, Magic Leap, are some of the key players in the global cancer cell stems market.
Q3. Which region possess greater investment opportunities in the coming future for Augmented Reality in healthcare Market?
A. Asia-Pacific region possess great investment opportunities for the investors to witness the most promising growth in the coming years.
Q4. What is the growth rate of Asia-Pacific Augmented Reality in healthcare market?
A. Asia-Pacific Augmented Reality in Healthcare Market is projected to grow at 22.1% CAGR during the forecast period.
Q5. What are the strategies opted for by the leading players in Augmented Reality in healthcare market?
A. Product development, and joint ventures are the key strategies opted by the operating companies in this market.
Q6. Which companies are investing more in R&D practices in Augmented Reality in healthcare Market?
A. Mindmaze, 3D Systems and Medical realities companies are investing more on R&D activities for developing new products and technologies.
Q7. what are the benefits of Augmented Reality in healthcare?
A. Enhancing the medical processes like diagnose, treat, and perform surgery for the efficiency of surgeon, visualization of bones, veins without any surgery and AR as clinical training module to help students and trainee physicians, these are some benefits of AR in healthcare.
1. Research Methodology
1.1. Desk Research
1.2. Real time insights and validation
1.3. Forecast model
1.4. Assumptions and forecast parameters
1.4.1. Assumptions
1.4.2. Forecast parameters
1.5. Data sources
1.5.1. Primary
1.5.2. Secondary
2. Executive Summary
2.1. 360° summary
2.2. By Component
2.3. By Technology
2.4. By end-use
3. Market Overview
3.1. Market segmentation & definitions
3.2. Key takeaways
3.2.1. Top investment pockets
3.2.2. Top winning strategies
3.3. Porter’s five forces analysis
3.3.1. Bargaining power of consumers
3.3.2. Bargaining power of suppliers
3.3.3. Threat of new entrants
3.3.4. Threat of substitutes
3.3.5. Competitive rivalry in the market
3.4. Market dynamics
3.4.1. Drivers
3.4.2. Restraints
3.4.3. Opportunities
3.5. Technology landscape
3.6. Regulatory landscape
3.7. Patent landscape
3.8. Market value chain analysis
3.8.1. Stress point analysis
3.9. Strategic overview
4. Augmented Reality in Healthcare Market, by Component
4.1. Semiconductor Components
4.1.1. Market size and forecast, by region, 2016-2026
4.1.2. Comparative market share analysis, 2018 & 2026
4.2. Displays
4.2.1. Market size and forecast, by region, 2016-2026
4.2.2. Comparative market share analysis, 2018 & 2026
4.3. Sensors
4.3.1. Market size and forecast, by region, 2016-2026
4.3.2. Comparative market share analysis, 2018 & 2026
4.4. Input Devices
4.4.1. Market size and forecast, by region, 2016-2026
4.4.2. Comparative market share analysis, 2018 & 2026
5. Augmented Reality in Healthcare Market, by Technology
5.1. Mobile Device-Based
5.1.1. Market size and forecast, by region, 2016-2026
5.1.2. Comparative market share analysis, 2018 & 2026
5.2. Spatial
5.2.1. Market size and forecast, by region, 2016-2026
5.2.2. Comparative market share analysis, 2018 & 2026
5.3. Vision-based
5.3.1. Market size and forecast, by region, 2016-2026
5.3.2. Comparative market share analysis, 2018 & 2026
5.4. Wearable
5.4.1. Market size and forecast, by region, 2016-2026
5.4.2. Comparative market share analysis, 2018 & 2026
6. Augmented Reality in Healthcare Market, by End Use
6.1.1. Market size and forecast, by region, 2016-2026
6.1.2. Comparative market share analysis, 2018 & 2026
7. Augmented Reality in Healthcare Market, by Region
7.1. North America
7.1.1. Market size and forecast, by component, 2018-2026
7.1.2. Market size and forecast, by technology, 2018-2026
7.1.3. Market size and forecast, by country, 2016-2026
7.1.4. Comparative market share analysis, 2018 & 2026
7.1.5. U.S.
7.1.5.1. Market size and forecast, by component, 2018-2026
7.1.5.2. Market size and forecast, by technology, 2018-2026
7.1.5.3. Market size and forecast, by end use, 2018-2026
7.1.5.4. Comparative market share analysis, 2018 & 2026
7.1.6. Canada
7.1.6.1. Market size and forecast, by component, 2018-2026
7.1.6.2. Market size and forecast, by technology, 2018-2026
7.1.6.3. Market size and forecast, by end use, 2018-2026
7.1.6.4. Comparative market share analysis, 2018 & 2026
7.1.7. Mexico
7.1.7.1. Market size and forecast, by component, 2018-2026
7.1.7.2. Market size and forecast, by technology, 2018-2026
7.1.7.3. Market size and forecast, by end use, 2018-2026
7.1.7.4. Comparative market share analysis, 2018 & 2026
7.2. Europe
7.2.1. Market size and forecast, by component, 2018-2026
7.2.2. Market size and forecast, by technology, 2018-2026
7.2.3. Market size and forecast, by end use, 2018-2026
7.2.4. Market size and forecast, by country, 2016-2026
7.2.5. Comparative market share analysis, 2018 & 2026
7.2.6. Germany
7.2.6.1. Market size and forecast, by component, 2018-2026
7.2.6.2. Market size and forecast, by technology, 2018-2026
7.2.6.3. Market size and forecast, by end use, 2018-2026
7.2.6.4. Comparative market share analysis, 2018 & 2026
7.2.7. Spain
7.2.7.1. Market size and forecast, by component, 2018-2026
7.2.7.2. Market size and forecast, by technology, 2018-2026
7.2.7.3. Market size and forecast, by end use, 2018-2026
7.2.7.4. Comparative market share analysis, 2018 & 2026
7.2.8. France
7.2.8.1. Market size and forecast, by component, 2018-2026
7.2.8.2. Market size and forecast, by technology, 2018-2026
7.2.8.3. Market size and forecast, by end use, 2018-2026
7.2.8.4. Comparative market share analysis, 2018 & 2026
7.2.9. Italy
7.2.9.1. Market size and forecast, by component, 2018-2026
7.2.9.2. Market size and forecast, by technology, 2018-2026
7.2.9.3. Market size and forecast, by end use, 2018-2026
7.2.9.4. Comparative market share analysis, 2018 & 2026
7.2.10. Rest of the Europe
7.2.10.1. Market size and forecast, by component, 2018-2026
7.2.10.2. Market size and forecast, by technology, 2018-2026
7.2.10.3. Market size and forecast, by end use, 2018-2026
7.2.10.4. Comparative market share analysis, 2018 & 2026
7.3. Asia-Pacific
7.3.1. Market size and forecast, by component, 2018-2026
7.3.2. Market size and forecast, by technology, 2018-2026
7.3.3. Market size and forecast, by end use, 2018-2026
7.3.4. Market size and forecast, by country, 2016-2026
7.3.5. Comparative market share analysis, 2018 & 2026
7.3.6. China
7.3.6.1. Market size and forecast, by component, 2018-2026
7.3.6.2. Market size and forecast, by technology, 2018-2026
7.3.6.3. Comparative market share analysis, 2018 & 2026
7.3.7. Japan
7.3.7.1. Market size and forecast, by component, 2018-2026
7.3.7.2. Market size and forecast, by technology, 2018-2026
7.3.7.3. Comparative market share analysis, 2018 & 2026
7.3.8. India
7.3.8.1. Market size and forecast, by component, 2018-2026
7.3.8.2. Market size and forecast, by technology, 2018-2026
7.3.8.3. Market size and forecast, by end use, 2018-2026
7.3.8.4. Comparative market share analysis, 2018 & 2026
7.3.9. Australia
7.3.9.1. Market size and forecast, by component, 2018-2026
7.3.9.2. Market size and forecast, by technology, 2018-2026
7.3.9.3. Market size and forecast, by end use, 2018-2026
7.3.9.4. Comparative market share analysis, 2018 & 2026
7.3.10. South Korea
7.3.10.1. Market size and forecast, by component, 2018-2026
7.3.10.2. Market size and forecast, by technology, 2018-2026
7.3.10.3. Market size and forecast, by end use, 2018-2026
7.3.10.4. Comparative market share analysis, 2018 & 2026
7.3.11. Rest of the Asia Pacific
7.3.11.1. Market size and forecast, by component, 2018-2026
7.3.11.2. Market size and forecast, by technology, 2018-2026
7.3.11.3. Market size and forecast, by end use, 2018-2026
7.3.11.4. Comparative market share analysis, 2018 & 2026
7.4. LAMEA
7.4.1. Market size and forecast, by component, 2018-2026
7.4.2. Market size and forecast, by technology, 2018-2026
7.4.3. Market size and forecast, by end use, 2018-2026
7.4.4. Market size and forecast, by country, 2016-2026
7.4.5. Comparative market share analysis, 2018 & 2026
7.4.6. Brazil
7.4.6.1. Market size and forecast, by component, 2018-2026
7.4.6.2. Market size and forecast, by technology, 2018-2026
7.4.6.3. Market size and forecast, by end use, 2018-2026
7.4.6.4. Comparative market share analysis, 2018 & 2026
7.4.7. Saudi Arabia
7.4.7.1. Market size and forecast, by component, 2018-2026
7.4.7.2. Market size and forecast, by technology, 2018-2026
7.4.7.3. Market size and forecast, by end use, 2018-2026
7.4.7.4. Comparative market share analysis, 2018 & 2026
7.4.8. South Africa
7.4.8.1. Market size and forecast, by component, 2018-2026
7.4.8.2. Market size and forecast, by technology, 2018-2026
7.4.8.3. Market size and forecast, by end use, 2018-2026
7.4.8.4. Comparative market share analysis, 2018 & 2026
7.4.9. Rest of LAMEA
7.4.9.1. Market size and forecast, by component, 2018-2026
7.4.9.2. Market size and forecast, by technology, 2018-2026
7.4.9.3. Market size and forecast, by end use, 2018-2026
7.4.9.4. Comparative market share analysis, 2018 & 2026
8. Company Profiles
8.1. Mindmaze
8.1.1. Business overview
8.1.2. Financial performance
8.1.3. Product portfolio
8.1.4. Recent strategic moves & developments
8.1.5. SWOT analysis
8.2. Medical Realities
8.2.1. Business overview
8.2.2. Financial performance
8.2.3. Product portfolio
8.2.4. Recent strategic moves & developments
8.2.5. SWOT analysis
8.3. Wikitude GmbH
8.3.1. Business overview
8.3.2. Financial performance
8.3.3. Product portfolio
8.3.4. Recent strategic moves & developments
8.3.5. SWOT analysis
8.4. CAE Healthcare
8.4.1. Business overview
8.4.2. Financial performance
8.4.3. Product portfolio
8.4.4. Recent strategic moves & developments
8.4.5. SWOT analysis
8.5. 3D Systems
8.5.1. Business overview
8.5.2. Financial performance
8.5.3. Product portfolio
8.5.4. Recent strategic moves & developments
8.5.5. SWOT analysis
8.6. Siemens Healthineers
8.6.1. Business overview
8.6.2. Financial performance
8.6.3. Product portfolio
8.6.4. Recent strategic moves & developments
8.6.5. SWOT analysis
8.7. VirtaMed
8.7.1. Business overview
8.7.2. Financial performance
8.7.3. Product portfolio
8.7.4. Recent strategic moves & developments
8.7.5. SWOT analysis
8.8. Magic Leap
8.8.1. Business overview
8.8.2. Financial performance
8.8.3. Product portfolio
8.8.4. Recent strategic moves & developments
8.8.5. SWOT analysis
Augmented Reality (AR) in healthcare has been transforming the medical device and medicine sector at the same time. AR is a concept where the real-life elements after recognizing the environment are augmented by additional visual information. Right from pharmacy benefit management to medical training, AR in healthcare is making a substantial impact on the healthcare business. Apart from saving lives of patients, existing procedures in healthcare organizations can be made more effective and specific with AR. The adoption of AR among healthcare professionals and researchers is increasing significantly and more effectively conduct surgeries and research.
Benefits of Augmented Reality in Lifesciences
As AR develops and becomes more user-friendly and affordable, more life sciences companies are considering its use as an essential tool to educate, communicate, and engage patients and HCPs on innovations that will enhance outcomes.
To bring new therapies to life, more life sciences companies are using AR by combining physical and virtual worlds. AR helps create interactive, rich experiences that show how medical devices and new drugs interact with the body. Using this disruptive technology, content providers and brand teams can give their field force a better way to engage healthcare professionals (HCPs). With AR, HCPs can be more illustrative when explaining novel treatments to patients.
Whether explaining a treatment method, disease state, or how a new medical device works, AR can significantly improve education on complex topics, enhance customer engagement, and create distinction with more powerful branding.
Recent Developments & Major Players of the Industry
Augmented Reality is already transforming healthcare, and it is changing the way physicians see patients. AR is now majorly being used for doctor and patient education, disease simulation, surgical visualization, and it also helps to save life enhancing treatments for patients. AR is even providing surgeons with 3D overlays to improve the visibility of veins, organs, and diagnosis reports. Additionally, AR plays a crucial role in education and in providing real-time simulation surgeries without the risk of getting it wrong with a live patient.
A Research Dive published report highlights top gaining players operating in the global augmented reality in healthcare market. Some of them are General Cable Technologies Corporation., EV TEISON, SINBON Electronics Co., Ltd., TE Connectivity, Phoenix Contact, BRUGG GROUP AG, Leoni AG, BASEN- Group, Aptiv, Dyden Corporation, and IONITY GmbH. These players are focusing more on advances in technology, and adopting several strategies such as collaborations, product development to stand strong in the global market.
A leader in Augmented Reality (AR) for AR learning applications and eCommerce, NexTech AR Solutions, announced a new partnership with a leading enterprise video platfrom provider, Jolokia. According to Statista, this partnership will develop Nextech’s reach into the L&D market. This collaboration of Jolokia and NexTech AR will offer a compelling video learning experience (LXP), which crosses the boundaries from an interactive video to AR.
ChristianaCare and Medtronic PLC announced a collaboration in order to improve patient outcomes of ChristianaCare in Delaware and the region surrounding the city. It is a five-year agreement, which focuses on deploying and developing value-based healthcare initiatives to help ChristianaCare in applying the right medical therapies and technologies to patients who may benefit most. The shared financial accountability between Medtronic and ChristianaCare will reduce the cost of care and improve patient outcomes.
Potential Future of Augmented Reality in Healthcare Market
Global market for Augmented Reality (AR) in healthcare market is anticipated to witness a positive growth during the period of forecast from 2019 to 2026. Increasing demand of virtual reality and technological advancements in healthcare is up surging the growth of global AR in healthcare market.
Increasing focus to reduce the workload of healthcare professionals is giving substantial uplift to the growth of global AR in healthcare market in the coming years. As per the Research Dive report statistics, the global AR in healthcare market is expected to grow at 21.9% CAGR by the end of 2026. North America region will dominate the global market during the projected period, owing to the rising demand for consumer devices.
Personalize this research
- Triangulate with your own data
- Request your format and definition
- Get a deeper dive on a specific application, geography, customer or competitor
- + 1-888-961-4454 Toll - Free
- support@researchdive.com
