Tea Market Report
RA04659
Tea Market by Type (Green Tea, Black Tea, Oolong Tea, Fruit/Herbal Tea, and Others), Packaging (Plastic Containers, Loose Tea, Paperboards, Aluminum Tins, and Tea Bags), Distribution Channel (Hypermarket/Supermarket, Specialty Stores, Convenience Stores, Online Stores, and Others), Application (Residential and Commercial), and Regional Analysis (North America, Europe, Asia-Pacific, and LAMEA): Global Opportunity Analysis and Industry Forecast, 2021–2028
Tea Market Analysis
The global tea market is anticipated to garner $67,920.8 million in the 2021–2028 timeframe, growing from $54,322.1 million in 2020 at a healthy CAGR of 6.6%
Market Synopsis
Product launch and business expansion among market players, along with partnership to attract customers and to enhance the geographical presence, is anticipated to drive the growth of the tea market.
However, growth in coffee consumption that is proven to lower the risk of type 2 diabetes, cancer, and other diseases makes coffee a great substitute for tea. This aspect is anticipated to restrain the market growth.
According to the regional analysis of the market, the Asia-Pacific tea market is anticipated to grow at a CAGR of 7.3% by generating a revenue of $51,650.0 million during the review period.
Tea Overview
Tea is a commonly consumed beverage globally and people have been drinking tea since ages due to its associated benefits. Different types of teas have different benefits that boost the immune system, help in reducing inflammation, and others which makes it an extremely popular beverage.
Impact Analysis of COVID-19 on the Global Tea Market
The novel coronavirus pandemic has had a devastating effect on several industries and the tea market also experienced a negative impact owing to complete lockdown situations and social distancing measures that has led to import-export restrictions, shortage of labor, supply chain disruptions, and decline in manufacturing processes. For instance, Kenya which is the largest tea exporting country in Africa was greatly affected during the pandemic due to disruption in transportation. Furthermore, India which is the second largest tea producer in the world, was negatively impacted by the pandemic due to complete shutdown of production facilities for months that affected the tea producers and smallholder livelihoods.
Several companies with their technological advancements, innovations, and initiatives, are helping the society to recover from the chaotic situation. For instance, Assam government has launched 4 new schemes on September 25, 2020, to boost the tea production business which has been hit badly due to pandemic restrictions. As per the scheme, the government will pay 3% interest on the capital loan. The government will pay subsidy of Rs. 7 per kg to promote production and export of tea. In addition, the government will also pay 25% subsidy to purchase plants and machineries needed to grow tea. Also, the government has waived off the agriculture income tax for tea garden owners for three years. Such initiatives are estimated to boost the production and export of tea to different countries.
Health Benefits Associated with Tea Consumption to Drive the Market Growth
The global tea industry is witnessing a rapid growth as tea is one of the widely consumed beverages across the world. Tea is rich in antioxidants that lowers the risk of heart disease, promotes weight loss, protects against cancer as it contains healthy bioactive compounds. Tea is also rich in various nutrients such as vitamin C, B6, B12, and E and minerals such as potassium, calcium, magnesium, and others. Further, green tea contains catechin called epigallocatechin-3-gallate (EGCG), which are natural antioxidants that prevents cell damage that has anti-ageing properties. Furthermore, tea is rich in caffeine which acts as a stimulant that improves the functioning of brain, memory, reaction time, vigilance, and others. All these advantages are anticipated to drive the market demand during the analysis timeframe.
To know more about global tea market drivers, get in touch with our analysts here.
Growth in Coffee Consumption to Restrain Tea Market Growth
Coffee is another widely consumed beverage across the world which is rich in manganese, potassium, niacin, and other nutrients. Coffee is proven to reduce the risk of cancer, type 2 diabetes, and other diseases and has higher caffeine content that elevates your energy levels, reduces fatigue, and increases alertness. Hence, these associated benefits make coffee as an easy substitute for tea. These factors are predicted to restrain the tea market growth during the forecast period.
Introduction of New Tea Flavors to Create Enormous Investment Opportunities
The launch of new tea flavors such as organic tea, green tea, fruit tea, chamomile tea, white tea, and others are anticipated to generate excellent growth opportunities in the market. For instance, Chamomile tea which is derived from flowers has various health benefits such as it improves sleep quality, promotes digestive health, controls blood sugar level, improves heart health, and others. In addition, herbal tea such as peppermint tea is made from dried leaves of peppermint plant that makes it bold, refreshing, and minty. In addition, Nestlé S.A., the Switzerland-based food & beverages company, introduced zero-waste initiative that converts tea into fertilizer in August 2018. This is a regenerative approach that aims to prevent leakage of resources, minimizes waste and energy emissions. Tea waste is rich in compounds such as potassium, nitrogen, and phosphorous that makes it an excellent fertilizer. All these factors are estimated to generate huge growth opportunities during the forecast period.
To know more about global tea market opportunities, get in touch with our analysts here.
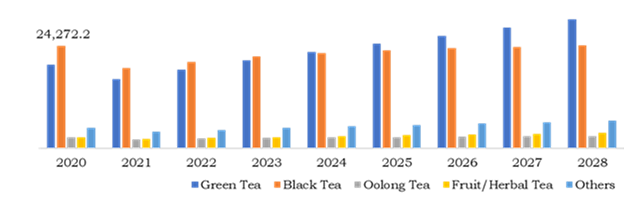
Global Tea Market, by Type
Based on type, the market has been divided into green tea, black tea, oolong tea, fruit/herbal tea, and others. Out of these, the black tea sub-segment has accounted for highest revenue share in 2020 and green tea sub-segment is projected to have the fastest growth during the analysis period.
Source: Research Dive Analysis
The black tea type is anticipated to have a dominant market share, and it is predicted that the market shall generate a revenue of $24,368.3 million by 2028, growing from $24,272.2 million in 2020. Black tea is most popular consumed beverage across the world that is derived from Camellia sinensis plant which has a strong flavor and contains more caffeine than any other tea. The growth in this sub-segment is attributed to a wide range of benefits such as antioxidant properties that removes free radicals and decreases the cell damage. Black tea also contains flavonoids found in fruits, red wine, dark chocolate which is beneficial for heart health. In addition, black tea also lowers down the level of bad LDL (Low Density Lipoprotein) cholesterol that reduces the risk of heart disease. All these advantages are anticipated to boost the black tea market demand and growth in the upcoming years.
The green tea sub-segment is predicted to have a fastest growth in the global market and is expected to register a revenue of $30,513.4 million during the forecast period. This growth is majorly owing to wide range of benefits associated with the consumption of green tea. The green tea contains healthy bioactive compounds that improves the functioning of brain, aids in fat burning process, reduces bad breath, prevents the risk of type 2 diabetes, cardiovascular diseases, and others. In addition, green tea prevents tooth cavities, strengthens tooth enamel, promotes healthy skin, and prevents food poisoning. Increase in the number of health and fitness-conscious people have increased the demand for green tea due to its weight loss and healthy skin benefits. All the benefits and advantages of green tea consumption are predicted to drive the growth of green tea sub-segment during the analysis period.
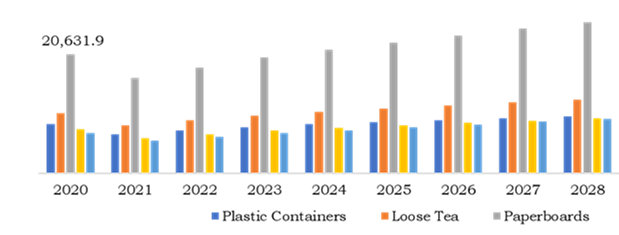
Global Tea Market, by Packaging
Based on packaging, the analysis has been divided into plastic containers, loose tea, paperboards, aluminum tins, and tea bags. Out of these, paperboards is predicted to be a dominant sub-segment and tea bags is projected to account for the fastest growth in the global market.
Source: Research Dive Analysis
The paperboards sub-segment of the global tea market is anticipated to have fastest growth and surpass $26,199.5 million by 2028, with an increase from $20,631.9 million in 2020. Paperboards or cardboards are widely used for packaging as they are economical for companies. The paperboards are highly efficient to move, keep, or carry various items. Also, it is lightweight, and it can be customized based on consumer needs. In addition, if paperboards are derived from renewable or recycled materials such as waste products from sawdust, wood chips, recycled paper, and others, then it can act as a sustainable solution for safe and healthy environment. These aspects are estimated to drive the growth of paperboards sub-segment during the forecast period.
The tea bags sub-segment of the global tea market is anticipated to have fastest growth and surpass $9,445.3 million by 2028, with an increase from $6,988.1 million in 2020. Tea bags are small pouches that contain powdered tea or tea leaves which has become extremely popular in recent years. Tea bags offers convenience and it has appropriate portion of tea quantity. In addition, tea bags have eye catching shape and elegant design. Also, the manufacturer can sell variety of tea types in one box by using different color tea bags to differentiate various flavors. All these benefits are estimated to drive the growth for tea bags sub-segment during the analysis timeframe.
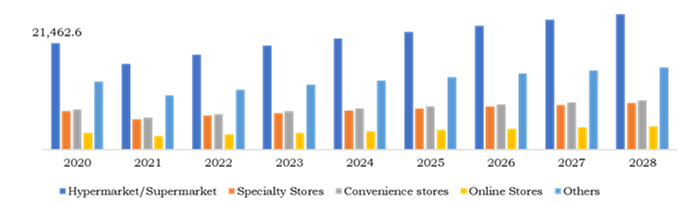
Global Tea Market, by Distribution Channel
Based on distribution channel, the analysis has been divided into hypermarket/supermarket, specialty stores, convenience stores, online stores, and others. Out of these, the hypermarket/supermarket is a dominant sub-segment and online stores is the fastest growing sub-segment in the global market.
Source: Research Dive Analysis
The hypermarket/supermarket sub-segment of the global tea market is anticipated to have dominant market share and surpass $27,286.1 million by 2028, with an increase from $21,462.6 million in 2020. The hypermarket/supermarket provides one stop access to variety of products from various brands. In addition, hypermarket/supermarket offers self-service so that the users have choice to select appropriate product based on price, ingredients and benefits offered. Also, attractive discounts are offered by these stores, located at easily accessible areas, and operates under convenient timings. All these aspects are anticipated to drive the growth of hypermarket/supermarket sub-segment during the analysis period.
The online stores segment is estimated to grow at the fastest rate registering a revenue of $4,738.3 million during the analysis timeframe owing to growing popularity of e-commerce platforms. Due to pandemic situation e-commerce platform has experienced the rapid growth and it is one of the fastest emerging sectors. Attractive discounts, coupons, cashback offers, delivery service, and product variety offered by e-commerce platforms have attracted large number of customers. In addition, ease of placing an order, order tracking, cancellations & smooth refund process have gained huge popularity. All these factors are estimated to boost the market growth in the upcoming years.
Global Tea Market, by Application
Based on application, the analysis has been divided into residential and commercial. Out of these, commercial sub-segment is predicted to be the most dominant fastest growing in the global market, with residential sub-segment acquiring the subsequent place.

Source: Research Dive Analysis
The residential sub-segment of the global tea market is anticipated to have dominant market share and surpass $60,344.5 million by 2028, with an increase from $49,387.9 million in 2020. This growth is mainly owing to consumption and popularity of tea at large number of residences. Tea is largely consumed across residential segment as it provides refreshment and has health benefits. Also, advertising and marketing by the manufacturers has shifted the consumer preferences towards drinking tea that is estimated to drive the growth of residential sub-segment during the forecast period.
The commercial sub-segment of the global tea market is anticipated to have a significant growth and surpass $7,572.3 million by 2028, with an increase from $4,934.3 million in 2020. Tea is widely consumed beverage across hotels, corporate offices, restaurants, cafes, and more. The growth in commercial sector is majorly attributed to fast service offered by these commercial places. These factors are anticipated to drive the growth of commercial sub-segment during the analysis period.
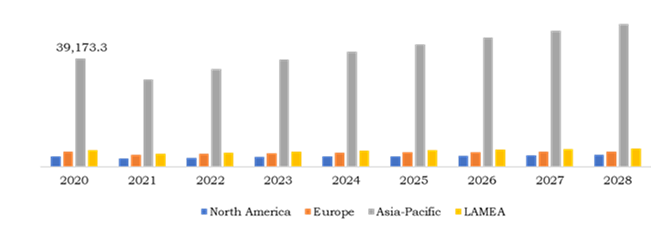
Global Tea Market, Regional Insights:
The tea market was investigated across North America, Europe, Asia-Pacific, and LAMEA.
Source: Research Dive Analysis
The Market for Tea in Asia-Pacific to be the Most Dominant & Fastest Growing
The Asia-Pacific tea market accounted $39,173.3 million in 2020 and is projected to register a revenue of $51,650.0 million by 2028. The rapid increase in tea demand is majorly attributed to high prevalence of tea culture in countries like China, India, Japan, and others. The growing health consciousness has attracted people towards consumption of different type of tea such as black tea, green tea, herbal tea, and others. Also, innovative packaging methods, variety of flavors, and taste is anticipated to attract new business opportunities in this region.
The Market for Tea in LAMEA to Acquire Significant Growth
The share of LAMEA tea market is anticipated to grow at a CAGR of 5.0% by registering a revenue of $6,608.2 million by 2028. Increase in health-conscious population, awareness regarding benefits offered by consumption of tea compared to carbonated drinks, and growth in food service channels mainly e-commerce platforms are anticipated to drive the demand for tea in the upcoming years. Argentina, the country in Latin America is one of the largest producers of black tea. In addition, availability of various flavors such as green tea, lemon tea, fruit tea, and others is anticipated to drive the tea demand in LAMEA region.
Competitive Scenario in the Global Tea Market
Product launches, business expansions, and partnerships are common strategies followed by major market players.

Source: Research Dive Analysis
Some of the leading tea market players are Associated British Foods Plc., Barry's Tea Limited, Hain Celestial Group, Inc., ITO EN, Ltd., McLeod Russel, Nestlé S.A., Taetea Group, Tata Global beverages, The Republic of Tea, Inc., Unilever Group
Porter’s Five Forces Analysis for the Global Tea Market:
- Bargaining Power of Suppliers: Tea leaves are the primary raw materials for manufacturing different varieties of tea. This factor indicates that there is low product differentiation but there are small number of domestic and international raw material suppliers which increases the suppliers bargaining power.
Thus, the bargaining power suppliers is high. - Bargaining Power of Buyers: Buyers have low bargaining power; as number of buyers are high, which are basically the direct customers who buy tea for residential and commercial applications. Furthermore, specific climatic conditions are required for tea production along with major capital investment that decreases the bargaining power of buyers.
Thus, the bargaining power of the buyers is low. - Threat of New Entrants: The companies entering tea market has less legal barriers and government policies are moderate as tea production is non-toxic and has less harm. In addition, the demand is high and increase in innovations in tea such as sustainable packing and launch of new varieties are anticipated to attract new entrants.
Thus, the threat of the new entrants is moderate. - Threat of Substitutes: The availability of substitute product such as coffee which is also energy activating beverage consumed by people almost twice a day. Tea and coffee are the substitutes of each other, and it depends on the consumer’s choice and availability which beverage to consume.
Thus, the threat of substitutes is high. - Competitive Rivalry in the Market: The competitive rivalry among industry leaders is high. The growing demand for tea from different regions has encouraged market players to focus on expanding their business capacity and geographical presence.
Therefore, competitive rivalry in the market is high.
| Aspect | Particulars |
| Historical Market Estimations | 2019-2020 |
| Base Year for Market Estimation | 2020 |
| Forecast Timeline for Market Projection | 2021-2028 |
| Geographical Scope | North America, Europe, Asia-Pacific, LAMEA |
| Segmentation by Type |
|
| Segmentation by Packaging |
|
| Segmentation by Distribution Channel |
|
| Segmentation by Application |
|
| Key Companies Profiled |
|
Q1. What is the size of the global tea market?
A. The size of the global tea market was over $54,322.1 million in 2020 and is projected to reach $67,920.8 million by 2028.
Q2. Which are the major companies in the tea market?
A. Associated British Foods, Plc., Barry's Tea Limited, and Nestlé S.A. are some of the major players operating in the tea market.
Q3. Which region, among others, possesses greater investment opportunities in the near future?
A. The Asia-Pacific region possesses great investment opportunities for investors to witness the most promising growth in the future.
Q4. What will be the growth rate of the Asia-Pacific tea market?
A. Asia Pacific tea market is anticipated to grow at 7.3% CAGR during the forecast period.
Q5. What are the strategies opted by the leading players in this market?
A. Product launch, product innovation, and partnerships are the key strategies opted by the operating companies in this market.
Q6. Which companies are investing more on R&D practices?
A. Associated British Foods, Plc., Barry's Tea Limited, and Nestlé S.A. are investing more on R&D activities for developing new products and technologies.
1.Research Methodology
1.1.Desk Research
1.2.Real time insights and validation
1.3.Forecast model
1.4.Assumptions and forecast parameters
1.4.1.Assumptions
1.4.2.Forecast parameters
1.5.Data sources
1.5.1.Primary
1.5.2.Secondary
2.Executive Summary
2.1.360° summary
2.2.Type trends
2.3.Packaging trends
2.4.Distribution channel trends
2.5.Application trends
3.Market overview
3.1.Market segmentation & definitions
3.2.Key takeaways
3.2.1.Top investment pockets
3.2.2.Top winning strategies
3.3.Porter’s five forces analysis
3.3.1.Bargaining power of consumers
3.3.2.Bargaining power of suppliers
3.3.3.Threat of new entrants
3.3.4.Threat of substitutes
3.3.5.Competitive rivalry in the market
3.4.Market dynamics
3.4.1.Drivers
3.4.2.Restraints
3.4.3.Opportunities
3.5.Technology landscape
3.6.Regulatory landscape
3.7.Patent landscape
3.8.Market value chain analysis
3.9.Strategic overview
4.Tea Market, by Type
4.1.Green Tea
4.1.1.Market size and forecast, by region, 2020-2028
4.1.2.Comparative market share analysis, 2020 & 2028
4.2.Black Tea
4.2.1.Market size and forecast, by region, 2020-2028
4.2.2.Comparative market share analysis, 2020 & 2028
4.3.Oolong Tea
4.3.1.Market size and forecast, by region, 2020-2028
4.3.2.Comparative market share analysis, 2020 & 2028
4.4.Fruit/Herbal Tea
4.4.1.Market size and forecast, by region, 2020-2028
4.4.2.Comparative market share analysis, 2020 & 2028
4.5.Others
4.5.1.Market size and forecast, by region, 2020-2028
4.5.2.Comparative market share analysis, 2020 & 2028
5.Tea Market, by Packaging
5.1.Plastic Containers
5.1.1.Market size and forecast, by region, 2020-2028
5.1.2.Comparative market share analysis, 2020 & 2028
5.2.Loose Tea
5.2.1.Market size and forecast, by region, 2020-2028
5.2.2.Comparative market share analysis, 2020 & 2028
5.3.Paperboards
5.3.1.Market size and forecast, by region, 2020-2028
5.3.2.Comparative market share analysis, 2020 & 2028
5.4.Aluminum Tins
5.4.1.Market size and forecast, by region, 2020-2028
5.4.2.Comparative market share analysis, 2020 & 2028
5.5.Tea Bags
5.5.1.Market size and forecast, by region, 2020-2028
5.5.2.Comparative market share analysis, 2020 & 2028
6.Tea Market, by Distribution Channel
6.1.Hypermarket/Supermarket
6.1.1.Market size and forecast, by region, 2020-2028
6.1.2.Comparative market share analysis, 2020 & 2028
6.2.Specialty Stores
6.2.1.Market size and forecast, by region, 2020-2028
6.2.2.Comparative market share analysis, 2020 & 2028
6.3.Convenience Stores
6.3.1.Market size and forecast, by region, 2020-2028
6.3.2.Comparative market share analysis, 2020 & 2028
6.4.Online Stores
6.4.1.Market size and forecast, by region, 2020-2028
6.4.2.Comparative market share analysis, 2020 & 2028
6.5.Others
6.5.1.Market size and forecast, by region, 2020-2028
6.5.2.Comparative market share analysis, 2020 & 2028
7.Tea Market, by Application
7.1.Residential
7.1.1.Market size and forecast, by region, 2020-2028
7.1.2.Comparative market share analysis, 2020 & 2028
7.2.Commercial
7.2.1.Market size and forecast, by region, 2020-2028
7.2.2.Comparative market share analysis, 2020 & 2028
8.Tea Market, by Region
8.1.North America
8.1.1.Market size and forecast, by Type, 2020-2028
8.1.2.Market size and forecast, by Packaging, 2020-2028
8.1.3.Market size and forecast, by Distribution Channel, 2020-2028
8.1.4.Market size and forecast, by Application, 2020-2028
8.1.5.Market size and forecast, by country, 2020-2028
8.1.6.Comparative market share analysis, 2020 & 2028
8.1.7.U.S.
8.1.7.1.Market size and forecast, by Type, 2020-2028
8.1.7.2.Market size and forecast, by Packaging, 2020-2028
8.1.7.3.Market size and forecast, by Distribution Channel, 2020-2028
8.1.7.4.Market size and forecast, by Application, 2020-2028
8.1.7.5.Comparative market share analysis, 2020 & 2028
8.1.8.Canada
8.1.8.1.Market size and forecast, by Type, 2020-2028
8.1.8.2.Market size and forecast, by Packaging, 2020-2028
8.1.8.3.Market size and forecast, by Distribution Channel, 2020-2028
8.1.8.4.Market size and forecast, by Application, 2020-2028
8.1.8.5.Comparative market share analysis, 2020 & 2028
8.1.9.Mexico
8.1.9.1.Market size and forecast, by Type, 2020-2028
8.1.9.2.Market size and forecast, by Packaging, 2020-2028
8.1.9.3.Market size and forecast, by Distribution Channel, 2020-2028
8.1.9.4.Market size and forecast, by Application, 2020-2028
8.1.9.5.Comparative market share analysis, 2020 & 2028
8.2.Europe
8.2.1.Market size and forecast, by Type, 2020-2028
8.2.2.Market size and forecast, by Packaging, 2020-2028
8.2.3.Market size and forecast, by Distribution Channel, 2020-2028
8.2.4.Market size and forecast, by Application, 2020-2028
8.2.5.Market size and forecast, by country, 2020-2028
8.2.6.Comparative market share analysis, 2020 & 2028
8.2.7.Germany
8.2.7.1.Market size and forecast, by Type, 2020-2028
8.2.7.2.Market size and forecast, by Packaging, 2020-2028
8.2.7.3.Market size and forecast, by Distribution Channel, 2020-2028
8.2.7.4.Market size and forecast, by Application, 2020-2028
8.2.7.5.Comparative market share analysis, 2020 & 2028
8.2.8.France
8.2.8.1.Market size and forecast, by Type, 2020-2028
8.2.8.2.Market size and forecast, by Packaging, 2020-2028
8.2.8.3.Market size and forecast, by Distribution Channel, 2020-2028
8.2.8.4.Market size and forecast, by Application, 2020-2028
8.2.8.5.Comparative market share analysis, 2020 & 2028
8.2.9.Italy
8.2.9.1.Market size and forecast, by Type, 2020-2028
8.2.9.2.Market size and forecast, by Packaging, 2020-2028
8.2.9.3.Market size and forecast, by Distribution Channel, 2020-2028
8.2.9.4.Market size and forecast, by Application, 2020-2028
8.2.9.5.Comparative market share analysis, 2020 & 2028
8.2.10.Spain
8.2.10.1.Market size and forecast, by Type, 2020-2028
8.2.10.2.Market size and forecast, by Packaging, 2020-2028
8.2.10.3.Market size and forecast, by Distribution Channel, 2020-2028
8.2.10.4.Market size and forecast, by Application, 2020-2028
8.2.10.5.Comparative market share analysis, 2020 & 2028
8.2.11.Russia
8.2.11.1.Market size and forecast, by Type, 2020-2028
8.2.11.2.Market size and forecast, by Packaging, 2020-2028
8.2.11.3.Market size and forecast, by Distribution Channel, 2020-2028
8.2.11.4.Market size and forecast, by Application, 2020-2028
8.2.11.5.Comparative market share analysis, 2020 & 2028
8.2.12.Rest of Europe
8.2.12.1.Market size and forecast, by Type, 2020-2028
8.2.12.2.Market size and forecast, by Packaging, 2020-2028
8.2.12.3.Market size and forecast, by Distribution Channel, 2020-2028
8.2.12.4.Market size and forecast, by Application, 2020-2028
8.2.12.5.Comparative market share analysis, 2020 & 2028
8.3.Asia Pacific
8.3.1.Market size and forecast, by Type, 2020-2028
8.3.2.Market size and forecast, by Packaging, 2020-2028
8.3.3.Market size and forecast, by Distribution Channel, 2020-2028
8.3.4.Market size and forecast, by Application, 2020-2028
8.3.5.Market size and forecast, by country, 2020-2028
8.3.6.Comparative market share analysis, 2020 & 2028
8.3.7.Japan
8.3.7.1.Market size and forecast, by Type, 2020-2028
8.3.7.2.Market size and forecast, by Packaging, 2020-2028
8.3.7.3.Market size and forecast, by Distribution Channel, 2020-2028
8.3.7.4.Market size and forecast, by Application, 2020-2028
8.3.7.5.Comparative market share analysis, 2020 & 2028
8.3.8.China
8.3.8.1.Market size and forecast, by Type, 2020-2028
8.3.8.2.Market size and forecast, by Packaging, 2020-2028
8.3.8.3.Market size and forecast, by Distribution Channel, 2020-2028
8.3.8.4.Market size and forecast, by Application, 2020-2028
8.3.8.5.Comparative market share analysis, 2020 & 2028
8.3.9.Australia
8.3.9.1.Market size and forecast, by Type, 2020-2028
8.3.9.2.Market size and forecast, by Packaging, 2020-2028
8.3.9.3.Market size and forecast, by Distribution Channel, 2020-2028
8.3.9.4.Market size and forecast, by Application, 2020-2028
8.3.9.5.Comparative market share analysis, 2020 & 2028
8.3.10.India
8.3.10.1.Market size and forecast, by Type, 2020-2028
8.3.10.2.Market size and forecast, by Packaging, 2020-2028
8.3.10.3.Market size and forecast, by Distribution Channel, 2020-2028
8.3.10.4.Market size and forecast, by Application, 2020-2028
8.3.10.5.Comparative market share analysis, 2020 & 2028
8.3.11.South Korea
8.3.11.1.Market size and forecast, by Type, 2020-2028
8.3.11.2.Market size and forecast, by Packaging, 2020-2028
8.3.11.3.Market size and forecast, by Distribution Channel, 2020-2028
8.3.11.4.Market size and forecast, by Application, 2020-2028
8.3.11.5.Comparative market share analysis, 2020 & 2028
8.3.12.Pakistan
8.3.12.1.Market size and forecast, by Type, 2020-2028
8.3.12.2.Market size and forecast, by Packaging, 2020-2028
8.3.12.3.Market size and forecast, by Distribution Channel, 2020-2028
8.3.12.4.Market size and forecast, by Application, 2020-2028
8.3.12.5.Comparative market share analysis, 2020 & 2028
8.3.13.Rest of Asia Pacific
8.3.13.1.Market size and forecast, by Type, 2020-2028
8.3.13.2.Market size and forecast, by Packaging, 2020-2028
8.3.13.3.Market size and forecast, by Distribution Channel, 2020-2028
8.3.13.4.Market size and forecast, by Application, 2020-2028
8.3.13.5.Comparative market share analysis, 2020 & 2028
8.4.LAMEA
8.4.1.Market size and forecast, by Type, 2020-2028
8.4.2.Market size and forecast, by Packaging, 2020-2028
8.4.3.Market size and forecast, by Distribution Channel, 2020-2028
8.4.4.Market size and forecast, by Application, 2020-2028
8.4.5.Market size and forecast, by country, 2020-2028
8.4.6.Comparative market share analysis, 2020 & 2028
8.4.7.Brazil
8.4.7.1.Market size and forecast, by Type, 2020-2028
8.4.7.2.Market size and forecast, by Packaging, 2020-2028
8.4.7.3.Market size and forecast, by Distribution Channel, 2020-2028
8.4.7.4.Market size and forecast, by Application, 2020-2028
8.4.7.5.Comparative market share analysis, 2020 & 2028
8.4.8.Saudi Arabia
8.4.8.1.Market size and forecast, by Type, 2020-2028
8.4.8.2.Market size and forecast, by Packaging, 2020-2028
8.4.8.3.Market size and forecast, by Distribution Channel, 2020-2028
8.4.8.4.Market size and forecast, by Application, 2020-2028
8.4.8.5.Comparative market share analysis, 2020 & 2028
8.4.9.South Africa
8.4.9.1.Market size and forecast, by Type, 2020-2028
8.4.9.2.Market size and forecast, by Packaging, 2020-2028
8.4.9.3.Market size and forecast, by Distribution Channel, 2020-2028
8.4.9.4.Market size and forecast, by Application, 2020-2028
8.4.9.5.Comparative market share analysis, 2020 & 2028
8.4.10.Turkey
8.4.10.1.Market size and forecast, by Type, 2020-2028
8.4.10.2.Market size and forecast, by Packaging, 2020-2028
8.4.10.3.Market size and forecast, by Distribution Channel, 2020-2028
8.4.10.4.Market size and forecast, by Application, 2020-2028
8.4.10.5.Comparative market share analysis, 2020 & 2028
8.4.11.Egypt
8.4.11.1.Market size and forecast, by Type, 2020-2028
8.4.11.2.Market size and forecast, by Packaging, 2020-2028
8.4.11.3.Market size and forecast, by Distribution Channel, 2020-2028
8.4.11.4.Market size and forecast, by Application, 2020-2028
8.4.11.5.Comparative market share analysis, 2020 & 2028
8.4.12.Rest of LAMEA
8.4.12.1.Market size and forecast, by Type, 2020-2028
8.4.12.2.Market size and forecast, by Packaging, 2020-2028
8.4.12.3.Market size and forecast, by Distribution Channel, 2020-2028
8.4.12.4.Market size and forecast, by Application, 2020-2028
8.4.12.5.Comparative market share analysis, 2020 & 2028
9.Company profiles
9.1.Associated British Foods Plc. (ABF)
9.1.1.Business overview
9.1.2.Financial performance
9.1.3.Product portfolio
9.1.4.Recent strategic moves & developments
9.1.5.SWOT analysis
9.2.Barry’s Tea Limited
9.2.1.Business overview
9.2.2.Financial performance
9.2.3.Product portfolio
9.2.4.Recent strategic moves & developments
9.2.5.SWOT analysis
9.3.Hain Celestial Group, Inc.
9.3.1.Business overview
9.3.2.Financial performance
9.3.3.Product portfolio
9.3.4.Recent strategic moves & developments
9.3.5.SWOT analysis
9.4.ITO EN, Ltd.
9.4.1.Business overview
9.4.2.Financial performance
9.4.3.Product portfolio
9.4.4.Recent strategic moves & developments
9.4.5.SWOT analysis
9.5.Mcleod Russel India Limited
9.5.1.Business overview
9.5.2.Financial performance
9.5.3.Product portfolio
9.5.4.Recent strategic moves & developments
9.5.5.SWOT analysis
9.6.Nestle S.A.
9.6.1.Business overview
9.6.2.Financial performance
9.6.3.Product portfolio
9.6.4.Recent strategic moves & developments
9.6.5.SWOT analysis
9.7.Taetea
9.7.1.Business overview
9.7.2.Financial performance
9.7.3.Product portfolio
9.7.4.Recent strategic moves & developments
9.7.5.SWOT analysis
9.8.Tata Global Beverages
9.8.1.Business overview
9.8.2.Financial performance
9.8.3.Product portfolio
9.8.4.Recent strategic moves & developments
9.8.5.SWOT analysis
9.9.The Republic of Tea, Inc.
9.9.1.Business overview
9.9.2.Financial performance
9.9.3.Product portfolio
9.9.4.Recent strategic moves & developments
9.9.5.SWOT analysis
9.10.Unilever Group
9.10.1.Business overview
9.10.2.Financial performance
9.10.3.Product portfolio
9.10.4.Recent strategic moves & developments
9.10.5.SWOT analysis
As far as the legend goes, it was in 2737 B.C.E, the Chinese emperor – Shen Nong stumbled upon tea. As per the ancient tale, a tea leaf drifted into the emperor’s pot of boiling water and this is how the love for tea reached far and wide for centuries to come. According to archeologists, tea was originally found in the Yunnan province of China, however, evidence pinpoints that Northern India and Tibet may have been native to tea as well. It was in the Tang Dynasty of China (600 to 900 A.D.) that tea gained humongous popularity and was declared as the national drink of China. Apart from this, the Japanese follow a tea ceremony that signifies tranquility, purity, harmony, and respect. The Japanese put in a lot of effort during the preparation of the tea ceremony.
There are 3 types of teas:
- True teas
- Herbal teas
- Flavored
True teas are further classified into the following:
- White tea
- Green tea
- Oolong tea
- Black tea
- Pu-erh tea
Forecast Analysis of the Tea Market
The global tea market is anticipated to witness a tremendous growth rate in the coming years due to variegated health benefits associated with tea and it is one of the commonly preferred beverages worldwide amongst all classes of people. Tea contains three main compounds – antioxidants, polyphenols, and catechins. Polyphenols contain tannins and flavonoids that keep diseases off the bay. Flavonoids contain antioxidants that prevent premature aging and severe neurological disorders. Green tea is recommended for people, who are into fitness, because this type of tea contains a huge amount of antioxidants.
Some of the notable advantages of drinking tea are as follows:
- Chamomile – An herbal tea that helps in ridding bowel syndrome as this tea acts like an antispasmodic.
- Ginger tea – helps to calm nausea.
- Tea helps in fighting cancer (no fixed evidence found as such so far)
- Tulsi or holy basil tea – used to enhance immunity and fend off illness or injuries. This tea is known for its anti-fungal, antibacterial, and anti-inflammatory property that helps to strengthen the immune system.
- Teas prevent cavities by changing the pH in the mouth.
- They reduce the risk of heart attacks.
- They offer exceptional weight loss.
All the above-stated perks of drinking tea are estimated to drive the global tea market in the coming years. Apart from this, a report by Research Dive, states that the global tea market is predicted to gain $67,920.8 million during the 2021-2028 timeframe. Furthermore, the massive prevalence of tea culture in regions, such as India, China, Japan, and so on, is expected to surge the Asia-Pacific tea market in the coming years.
Recent Developments in the Market
The well-established participants of the global tea market are concentrating on exclusive strategies such as constructing product portfolios, mergers and acquisitions of prospering companies, investments in research & development fields, new product declarations, and funding for the upcoming activities and innovations. These tactics are propelling the growth of numerous tea businesses across the world.
For instance,
- In February 2021, Tata Consumer Products, a food and beverage company declared the re-launch of Tetley, a green tea brand that has a new variant consisting of vitamin C. This launch focuses to capitalize on the rising consumer fondness for drinks, food, and remedies that can augment immunity during the Covid-19 outbreak.
- In October 2020, Indian Chai Company, a tea brand, revealed an exquisite line of healthy and exotic tea products. These teas are available in numerous flavors like Berries Jungle, Tumeric Citrus, Immunity Tea, Weight Loss Tea, Bombay Cutting, and Chai20. The company provides exclusive, aromatic, healthy, and medicinal tea options for consumers.
- In August 2020, Society Tea, a Mumbai-based tea brand, launched ‘Cleanse’ that is composed of ingredients meant for immunity and metabolism growth. The product encompasses turmeric that is known to treat the common cold, skin issues, and much more. The target audiences for Cleanse are those who are always on the move; one can restart their lifestyle with this tea brand.
Covid-19 Impact on the Global Market
The global tea market is expected to witness a negative impact during the coronavirus outbreak due to the lockdown scenario and social distancing norms. This factor has restricted import and export, declined the manufacturing procedures, decreased labor, and disrupted the supply chain. However, technical advances, initiatives, and innovations are predicted to upsurge the market in the post-pandemic scenario.
Future Scope of the Market
A substitute product for tea is generally coffee and this aspect is likely to restrain the market growth in the coming years. However, the introduction of several new tea flavors, such as green tea, organic tea, fruit tea, white tea, chamomile tea, and much more, is projected to create promising opportunities in the market globally. Also, tea waste is filled with nutritious compounds like nitrogen, potassium, and phosphorus that make it an ideal choice for fertilizer. Such unique benefits of tea are estimated to aid the growth of the market and mark a bright future for the market.
Personalize this research
- Triangulate with your own data
- Request your format and definition
- Get a deeper dive on a specific application, geography, customer or competitor
- + 1-888-961-4454 Toll - Free
- support@researchdive.com
