Display Panel Market Report
RA00390
Display Panel Market by Product (TVs, Mobile Phones & Tablets, PCs & Laptops, Vehicle Displays, and Others), Technology (OLED, Quantum Dot, LCD, E-Paper, LED, and Others), Industry Vertical (Healthcare, Consumer Electronics, BFSI, Retail, Military & Defense, Automotive, and Others), Display Type (Flat Panel Display, Flexible Panel Display, and Transparent Panel Display), and Regional Analysis (North America, Europe, Asia-Pacific, and LAMEA): Global Opportunity Analysis and Industry Forecast, 2022-2031
Global Display Panel Market Analysis
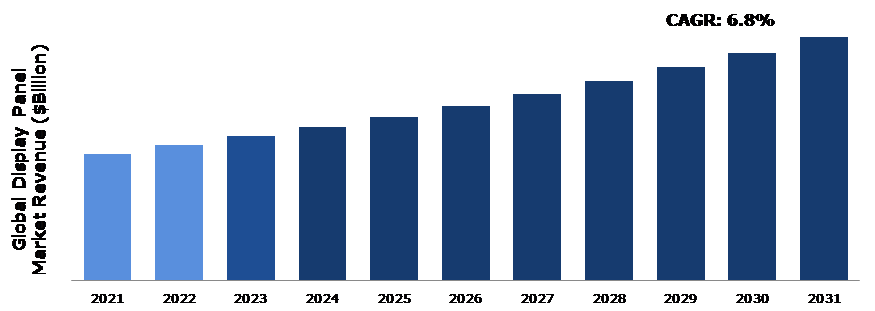
The Global Display Panel Market Size was $114.0 billion in 2021 and is predicted to grow with a CAGR of 6.8%, by generating a revenue of $219.4 billion by 2031.
Global Display Panel Market Synopsis
The increasing technological advancements in the display panel industry are one of the major factors attributed to the significant growth of the market. The display industry is rapidly developing owing to technological advancements such as Quantum Dot, OLED, and Micro LED displays. Consumers are spending more time in front of televisions, tablets, and smartphones because of the tremendous expansion of online gaming and entertainment. Due to this, the consumer demands superior visual experiences, which boosts advancements in display technologies. To increase display performance, LED technologies like organic LED (OLED) and micro-LED are replacing LCDs. In addition, startups are concentrating on creating cutting-edge technology like quantum dot (QD) displays. These new technologies offer numerous benefits such as better color accuracy, higher resolution, and improved energy efficiency, which is expected to drive the demand for new displays in the upcoming years.
However, transparent and quantum dot display technologies are expensive. Thus, the high cost associated with such display products is predicted to hinder the growth of the market. Moreover, LCD manufacturing failure is another major issue that is projected to restrain the market expansion. The LCD display's failure to satisfy the performance specifications as intended is the main factor behind display manufacturing failure.
Increasing R&D investment in display technologies to offer lucrative opportunities to major players during the forecast period. In the last few years, China, South Korea, and other countries have invested heavily in the research and manufacturing capacity of display technology. Meanwhile, many display technology possibilities, such as the conventional liquid crystal display (LCD), the quickly developing organic light-emitting diode (OLED), and the upcoming quantum-dot light-emitting diode (QLED), are vying for the market domination.
According to regional analysis, the Asia-Pacific display panel market accounted for the highest market share in 2021, owing to presence of major players, rising urbanization, and increasing demand for consumer electronics products in the region. China is anticipated to dominate the display panel market in Asia-Pacific.
Display Panel Overview
A display panel is an electronic component that is used to view video, images, or text. There are numerous types of display panels such as OLED, LED, LCD, Quantum Dot, E-Paper, and others. Display panels are extensively used in electronic devices such as computer monitors, televisions, smartphones, tablets, PCs, laptops, and digital signage. A display panel's quality is often determined by factors such as resolution, color accuracy, and contrast ratio. Sharper visuals, vivid colors, and smoother movements are all characteristics of display panels of higher grades.
COVID-19 Impact on Global Display Panel Market
The COVID-19 pandemic has had a mixed impact on the global display panel market. The pandemic led to an increase in demand for display panels in applications such as laptops, tablets, and televisions as people shifted to remote work and there was a rise in demand for home entertainment. The demand for digital signage also increased as businesses had to communicate safety guidelines and other information to their customers. However, the outbreak severely disrupted the supply chain of display panel manufacturers. Many factories had to slow down or completely stop manufacturing operations due to logistics disruptions. This led to shortages of display panels and increased prices as well.
The pandemic also affected consumer demand for certain types of display panels. For example, the demand for high-end OLED displays decreased as consumers became more price-sensitive due to economic uncertainty. Overall, the impact of the pandemic on the global display panel market has been mixed, with both opportunities and challenges for manufacturers and consumers alike.
Growing Demand for Electronic Devices to Drive the Market Growth
The increasing demand for consumer electronics products is one of the main drivers of the display panel market growth. As the adoption of electronics devices such as smartphones, tablets, laptops, and others continues to grow, the demand for display panels is also expected to increase. The consumer electronics sector has registered tremendous growth in the last few years owing to advancements in technology as well as changing consumer preferences. The rise in popularity of digital gadgets and the increase in need for connectivity are two major drivers projected to boost the growth of the consumer electronics sector. People are increasingly utilizing electronic devices to stay connected, get information, and entertain themselves. This is the major factors predicted to drive the market revenue growth during the forecast period.
To know more about global display panel market drivers, get in touch with our analysts here.
High Costs of Manufacturing Display Panels to Restrain the Market Growth
Display panel manufacturing is expensive as it requires cutting-edge technology and production procedures. Therefore, consumers' access to display panels gets restricted, which lowers its demand. Moreover, display panels frequently have a short lifespan and need to be replaced regularly owing to deterioration, technological obsolescence, or other circumstances. Customers may incur greater expenditure as a result, and demand may be constrained, which is projected to the hamper the market expansion in the future.
Advancements in Display Panel Technology to Drive Excellent Opportunities in the Market
Advancements in display panel technology, such as the development of flexible and foldable displays, Organic Light Emitting Diode (OLED) Display, Outdoor 3D Screen, and others are anticipated to offer excellent opportunities to major market players during the forecast period. Technological advancements help to build new applications as well as use cases. Moreover, the rising popularity of virtual reality (VR) and augmented reality (AR) applications offers an opportunity for the display panel market players. To offer consumers the best immersive experience, these applications require screens with high quality and resolution, which increases the demand for advanced display panels.
To know more about global display panel market opportunities, get in touch with our analysts here.
Global Display Panel Market, by Product
Based on product, the market has been divided into TVs, mobile phones & tablets, PCs & laptops, vehicle displays, and others. Among these, the mobile phones & tablets sub-segment accounted for the highest market share in 2021.
Global Display Panel Market Size, by Product, 2021
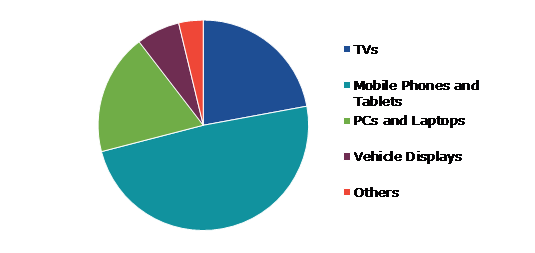
Technology: Research Dive Analysis
The mobile phones & tablets sub-segment accounted for the largest market share in 2021. New display panel technologies and features have been developed by major players in response to the demand for high-quality display panels for tablets and mobile phones. New technologies including AMOLED and OLED displays have been developed due to the demand for higher-resolution displays. These displays offer better visuals, precise color reproduction, and deeper blacks. Moreover, the demand for high-end smartphones is increasing at a rapid pace across the globe. Consumers are ready to pay high prices for smartphones with cutting-edge characteristics such as HDR support and high refresh rates.
Global Display Panel Market, by Technology
Based on technology, the market has been divided into OLED, Quantum Dot, LCD, E-Paper, LED, and others. Among these, the LCD sub-segment accounted for the highest market share in 2021.
Global Display Panel Market Share, by Technology, 2021
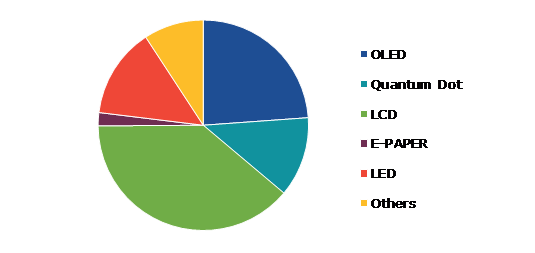
Technology: Research Dive Analysis
The LCD sub-segment accounted for the highest market share in 2021. As the need for high-quality displays in diverse applications grows, so does the demand for LCDs, which has been rising consistently over time. Various applications favor LCDs over other types of displays. They can create images that are both bright and sharp. At the panel's native resolution, the image is flawlessly sharp. Pixel tracking and phase must be carefully adjusted in LCDs with analog inputs. In addition, LCDs have the benefit of having a long lifespan.
Global Display Panel Market, by Industry Vertical
Based on industry vertical, the market has been divided into healthcare, consumer electronics, BFSI, retail, military & defense, automotive, and others. Among these, the consumer electronics sub-segment held the largest market share in 2021.
Global Display Panel Market Growth, by Technology, 2021
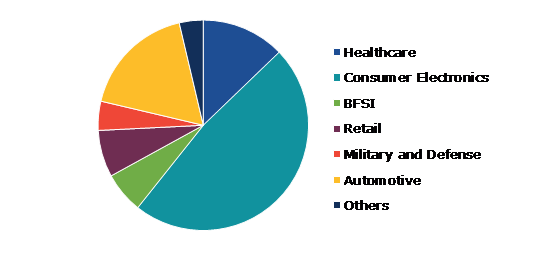
Technology: Research Dive Analysis
The consumer electronics sub-segment accounted for the largest market share in 2021, owing to the increasing number of various social media platforms such as Facebook, Twitter, Instagram, and others. With the rising popularity of social media platforms, individuals are consuming more content on their devices such as laptops and mobile phones. This has resulted in significant demand for high-quality displays that can offer a good viewing experience. Moreover, the growing demand for wearable electronic gadgets is also expected to significantly contribute to the segment growth.
Global Display Panel Market, by Display Type
Based on display type, the market has been divided into flat panel display, flexible panel display, and transparent panel display. Among these, the flat panel display sub-segment held the largest market share in 2021.
Global Display Panel Market Analysis, by Display Type, 2021
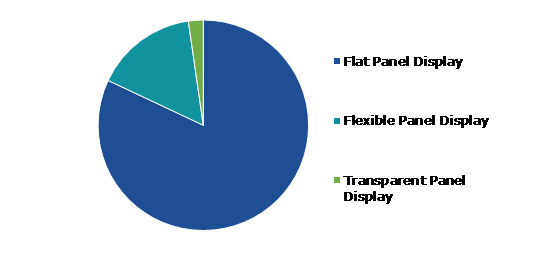
Technology: Research Dive Analysis
The flat panel display sub-segment accounted for the largest market share in 2021. Flat panel displays (FPDs) are increasingly important in this information-intensive era. FPDs are slim, light, and power-efficient in comparison to the cathode ray tube used in televisions. The development of portable computers and communication devices has been made possible by these displays. Moreover, FPDs have lower volume, weight, and power consumption. The use of CRT dropped worldwide as a result of the benefits of the FPDs. Consumers can hang flat panel devices on walls and wear them as watches as these devices are lightweight. Users can view data, graphics, text, and images on FPDs.
Global Display Panel Market, Regional Insights
The display panel market was investigated across North America, Europe, Asia-Pacific, and LAMEA.
Global Display Panel Market Size & Forecast, by Region, 2021-2031 ($Billion)
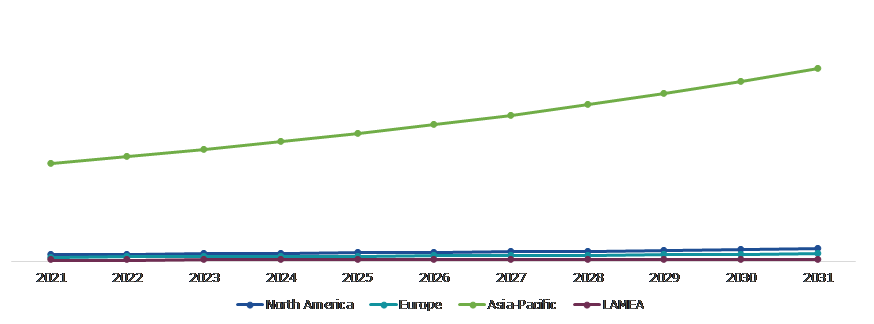
Technology: Research Dive Analysis
The Market for Display Panel in Asia-Pacific was the Most Dominant
The Asia-Pacific display panel market accounted for the largest market in 2021. Asia-Pacific is one of the largest and fastest-growing regions in the display panel market across the world. The increasing demand for consumer electronics, such as smartphones, TVs, and laptops, along with the growing adoption of advanced technologies, is driving the growth of the display panel market in this region. Countries like China, Japan, South Korea, and Taiwan are key players in this market due to their significant investments in R&D of display panel technology. In addition, rapid urbanization in the region has created a large market for display panels used in digital signage and public displays. The Asia-Pacific display panel market is expected to continue to grow in the upcoming years, driven by the increasing demand for high-quality displays in various applications.
Competitive Scenario in the Global Display Panel Market
Investment, partnership, and agreement are common strategies followed by major market players. For instance, in 2023, Ferrari partnered with Samsung to develop in-car displays. Samsung will develop OLED technology display solutions for the next generation Ferrari cars.
Technology: Research Dive Analysis
Some of the leading display panel market players are Samsung Electronics Co Ltd, Sharp Corporation, Japan Display Inc, Innolux Corporation, NEC CORPORATION, Panasonic Corporation, BOE Technology Group Co., Ltd., AUO Corporation, Sony Corporation, and Leyard Optoelectronic Co., Ltd.
| Aspect | Particulars |
| Historical Market Estimations | 2020 |
| Base Year for Market Estimation | 2021 |
| Forecast Timeline for Market Projection | 2022-2031 |
| Geographical Scope | North America, Europe, Asia-Pacific, and LAMEA |
| Segmentation by Product |
|
| Segmentation by Technology |
|
| Segmentation by Industry Vertical |
|
| Segmentation by Display Type |
|
| Key Companies Profiled |
|
Q1. What is the size of the global display panel market?
A. The size of the global display panel market was over $114.0 billion in 2021 and is projected to reach $219.4 billion by 2031
Q2. Which are the major companies in the display panel market?
A. Samsung Electronics Co Ltd, Sharp Corporation, and NEC CORPORATION are some of the key players in the global display panel market.
Q3. Which region, among others, possesses greater investment opportunities in the future?
A. Asia-Pacific possesses great investment opportunities for investors in the future.
Q4. What will be the growth rate of the Asia-Pacific display panel market?
A. Asia-Pacific display panel market is anticipated to grow at 7.0% CAGR during the forecast period.
Q5. What are the strategies opted by the leading players in this market?
A. Agreement and investment are the two key strategies opted by the operating companies in this market.
Q6. Which companies are investing more on R&D practices?
A. AUO Corporation, Leyard Optoelectronic Co., Ltd, and Japan Display Inc. are the companies investing more on R&D activities for developing new products and technologies.
1.Research Methodology
1.1.Desk Research
1.2.Real time insights and validation
1.3.Forecast model
1.4.Assumptions and forecast parameters
1.5.Market size estimation
1.5.1.Top-down approach
1.5.2.Bottom-up approach
2.Report Scope
2.1.Market definition
2.2.Key objectives of the study
2.3.Report overview
2.4.Market segmentation
2.5.Overview of the impact of COVID-19 on Global display panel market
3.Executive Summary
4.Market Overview
4.1.Introduction
4.2.Growth impact forces
4.2.1.Drivers
4.2.2.Restraints
4.2.3.Opportunities
4.3.Market value chain analysis
4.3.1.List of raw material suppliers
4.3.2.List of manufacturers
4.3.3.List of distributors
4.4.Innovation & sustainability matrices
4.4.1.Technology matrix
4.4.2.Regulatory matrix
4.5.Porter’s five forces analysis
4.5.1.Bargaining power of suppliers
4.5.2.Bargaining power of consumers
4.5.3.Threat of substitutes
4.5.4.Threat of new entrants
4.5.5.Competitive rivalry intensity
4.6.PESTLE analysis
4.6.1.Political
4.6.2.Economical
4.6.3.Social
4.6.4.Technological
4.6.5.Environmental
4.7.Impact of COVID-19 on display panel market
4.7.1.Pre-covid market scenario
4.7.2.Post-covid market scenario
5.Display Panel Market Analysis, by Product
5.1.Overview
5.2.TVs
5.2.1.Definition, key trends, growth factors, and opportunities
5.2.2.Market size analysis, by region,2021-2031
5.2.3.Market share analysis, by country,2021-2031
5.3.Mobile Phones & Tablets
5.3.1.Definition, key trends, growth factors, and opportunities
5.3.2.Market size analysis, by region,2021-2031
5.3.3.Market share analysis, by country,2021-2031
5.4.PCs & Laptops
5.4.1.Definition, key trends, growth factors, and opportunities
5.4.2.Market size analysis, by region,2021-2031
5.4.3.Market share analysis, by country,2021-2031
5.5.Vehicle Displays
5.5.1.Definition, key trends, growth factors, and opportunities
5.5.2.Market size analysis, by region,2021-2031
5.5.3.Market share analysis, by country,2021-2031
5.6.Others
5.6.1.Definition, key trends, growth factors, and opportunities
5.6.2.Market size analysis, by region,2021-2031
5.6.3.Market share analysis, by country,2021-2031
5.7.Research Dive Exclusive Insights
5.7.1.Market attractiveness
5.7.2.Competition heatmap
6.Display Panel Market Analysis, by Technology
6.1.OLED
6.1.1.Definition, key trends, growth factors, and opportunities
6.1.2.Market size analysis, by region,2021-2031
6.1.3.Market share analysis, by country,2021-2031
6.2.Quantum Dot
6.2.1.Definition, key trends, growth factors, and opportunities
6.2.2.Market size analysis, by region,2021-2031
6.2.3.Market share analysis, by country,2021-2031
6.3.LCD
6.3.1.Definition, key trends, growth factors, and opportunities
6.3.2.Market size analysis, by region,2021-2031
6.3.3.Market share analysis, by country,2021-2031
6.4.E-Paper
6.4.1.Definition, key trends, growth factors, and opportunities
6.4.2.Market size analysis, by region,2021-2031
6.4.3.Market share analysis, by country,2021-2031
6.5.LED
6.5.1.Definition, key trends, growth factors, and opportunities
6.5.2.Market size analysis, by region,2021-2031
6.5.3.Market share analysis, by country,2021-2031
6.6.Others
6.6.1.Definition, key trends, growth factors, and opportunities
6.6.2.Market size analysis, by region,2021-2031
6.6.3.Market share analysis, by country,2021-2031
6.7.Research Dive Exclusive Insights
6.7.1.Market attractiveness
6.7.2.Competition heatmap
7.Display Panel Market Analysis, by Industry Vertical
7.1.Healthcare
7.1.1.Definition, key trends, growth factors, and opportunities
7.1.2.Market size analysis, by region,2021-2031
7.1.3.Market share analysis, by country,2021-2031
7.2.Consumer Electronics
7.2.1.Definition, key trends, growth factors, and opportunities
7.2.2.Market size analysis, by region,2021-2031
7.2.3.Market share analysis, by country,2021-2031
7.3.BFSI
7.3.1.Definition, key trends, growth factors, and opportunities
7.3.2.Market size analysis, by region,2021-2031
7.3.3.Market share analysis, by country,2021-2031
7.4.Retail
7.4.1.Definition, key trends, growth factors, and opportunities
7.4.2.Market size analysis, by region,2021-2031
7.4.3.Market share analysis, by country,2021-2031
7.5.Military & Defense
7.5.1.Definition, key trends, growth factors, and opportunities
7.5.2.Market size analysis, by region,2021-2031
7.5.3.Market share analysis, by country,2021-2031
7.6.Automotive
7.6.1.Definition, key trends, growth factors, and opportunities
7.6.2.Market size analysis, by region,2021-2031
7.6.3.Market share analysis, by country,2021-2031
7.7.Others
7.7.1.Definition, key trends, growth factors, and opportunities
7.7.2.Market size analysis, by region,2021-2031
7.7.3.Market share analysis, by country,2021-2031
7.8.Research Dive Exclusive Insights
7.8.1.Market attractiveness
7.8.2.Competition heatmap
8.Display Panel Market Analysis, by Display Type
8.1.Flat Panel Display
8.1.1.Definition, key trends, growth factors, and opportunities
8.1.2.Market size analysis, by region,2021-2031
8.1.3.Market share analysis, by country,2021-2031
8.2.Flexible Panel Display
8.2.1.Definition, key trends, growth factors, and opportunities
8.2.2.Market size analysis, by region,2021-2031
8.2.3.Market share analysis, by country,2021-2031
8.3.Transparent Panel Display
8.3.1.Definition, key trends, growth factors, and opportunities
8.3.2.Market size analysis, by region,2021-2031
8.3.3.Market share analysis, by country,2021-2031
8.4.Research Dive Exclusive Insights
8.4.1.Market attractiveness
8.4.2.Competition heatmap
9.Display Panel Market, by Region
9.1.North America
9.1.1.U.S.
9.1.1.1.Market size analysis, by Product,2021-2031
9.1.1.2.Market size analysis, by Technology,2021-2031
9.1.1.3.Market size analysis, by Industry Vertical,2021-2031
9.1.1.4.Market size analysis, by Display Type,2021-2031
9.1.2.Canada
9.1.2.1.Market size analysis, by Product,2021-2031
9.1.2.2.Market size analysis, by Technology,2021-2031
9.1.2.3.Market size analysis, by Industry Vertical,2021-2031
9.1.2.4.Market size analysis, by Display Type,2021-2031
9.1.3.Mexico
9.1.3.1.Market size analysis, by Product,2021-2031
9.1.3.2.Market size analysis, by Technology,2021-2031
9.1.3.3.Market size analysis, by Industry Vertical,2021-2031
9.1.3.4.Market size analysis, by Display Type,2021-2031
9.1.4.Research Dive Exclusive Insights
9.1.4.1.Market attractiveness
9.1.4.2.Competition heatmap
9.2.Europe
9.2.1.Germany
9.2.1.1.Market size analysis, by Product,2021-2031
9.2.1.2.Market size analysis, by Technology,2021-2031
9.2.1.3.Market size analysis, by Industry Vertical,2021-2031
9.2.1.4.Market size analysis, by Display Type,2021-2031
9.2.2.UK
9.2.2.1.Market size analysis, by Product,2021-2031
9.2.2.2.Market size analysis, by Technology,2021-2031
9.2.2.3.Market size analysis, by Industry Vertical,2021-2031
9.2.2.4.Market size analysis, by Display Type,2021-2031
9.2.3.France
9.2.3.1.Market size analysis, by Product,2021-2031
9.2.3.2.Market size analysis, by Technology,2021-2031
9.2.3.3.Market size analysis, by Industry Vertical,2021-2031
9.2.3.4.Market size analysis, by Display Type,2021-2031
9.2.4.Spain
9.2.4.1.Market size analysis, by Product,2021-2031
9.2.4.2.Market size analysis, by Technology,2021-2031
9.2.4.3.Market size analysis, by Industry Vertical,2021-2031
9.2.4.4.Market size analysis, by Display Type,2021-2031
9.2.5.Italy
9.2.5.1.Market size analysis, by Product,2021-2031
9.2.5.2.Market size analysis, by Technology,2021-2031
9.2.5.3.Market size analysis, by Industry Vertical,2021-2031
9.2.5.4.Market size analysis, by Display Type,2021-2031
9.2.6.Rest of Europe
9.2.6.1.Market size analysis, by Product,2021-2031
9.2.6.2.Market size analysis, by Technology,2021-2031
9.2.6.3.Market size analysis, by Industry Vertical,2021-2031
9.2.6.4.Market size analysis, by Display Type,2021-2031
9.2.7.Research Dive Exclusive Insights
9.2.7.1.Market attractiveness
9.2.7.2.Competition heatmap
9.3.Asia-Pacific
9.3.1.China
9.3.1.1.Market size analysis, by Product,2021-2031
9.3.1.2.Market size analysis, by Technology,2021-2031
9.3.1.3.Market size analysis, by Industry Vertical,2021-2031
9.3.1.4.Market size analysis, by Display Type,2021-2031
9.3.2.Japan
9.3.2.1.Market size analysis, by Product,2021-2031
9.3.2.2.Market size analysis, by Technology,2021-2031
9.3.2.3.Market size analysis, by Industry Vertical,2021-2031
9.3.2.4.Market size analysis, by Display Type,2021-2031
9.3.3.India
9.3.3.1.Market size analysis, by Product,2021-2031
9.3.3.2.Market size analysis, by Technology,2021-2031
9.3.3.3.Market size analysis, by Industry Vertical,2021-2031
9.3.3.4.Market size analysis, by Display Type,2021-2031
9.3.4.Australia
9.3.4.1.Market size analysis, by Product,2021-2031
9.3.4.2.Market size analysis, by Technology,2021-2031
9.3.4.3.Market size analysis, by Industry Vertical,2021-2031
9.3.4.4.Market size analysis, by Display Type,2021-2031
9.3.5.South Korea
9.3.5.1.Market size analysis, by Product,2021-2031
9.3.5.2.Market size analysis, by Technology,2021-2031
9.3.5.3.Market size analysis, by Industry Vertical,2021-2031
9.3.5.4.Market size analysis, by Display Type,2021-2031
9.3.6.Rest of Asia-Pacific
9.3.6.1.Market size analysis, by Product,2021-2031
9.3.6.2.Market size analysis, by Technology,2021-2031
9.3.6.3.Market size analysis, by Industry Vertical,2021-2031
9.3.6.4.Market size analysis, by Display Type,2021-2031
9.3.7.Research Dive Exclusive Insights
9.3.7.1.Market attractiveness
9.3.7.2.Competition heatmap
9.4.LAMEA
9.4.1.Brazil
9.4.1.1.Market size analysis, by Product,2021-2031
9.4.1.2.Market size analysis, by Technology,2021-2031
9.4.1.3.Market size analysis, by Industry Vertical,2021-2031
9.4.1.4.Market size analysis, by Display Type,2021-2031
9.4.2.Saudi Arabia
9.4.2.1.Market size analysis, by Product,2021-2031
9.4.2.2.Market size analysis, by Technology,2021-2031
9.4.2.3.Market size analysis, by Industry Vertical,2021-2031
9.4.2.4.Market size analysis, by Display Type,2021-2031
9.4.3.UAE
9.4.3.1.Market size analysis, by Product,2021-2031
9.4.3.2.Market size analysis, by Technology,2021-2031
9.4.3.3.Market size analysis, by Industry Vertical,2021-2031
9.4.3.4.Market size analysis, by Display Type,2021-2031
9.4.4.South Africa
9.4.4.1.Market size analysis, by Product,2021-2031
9.4.4.2.Market size analysis, by Technology,2021-2031
9.4.4.3.Market size analysis, by Industry Vertical,2021-2031
9.4.4.4.Market size analysis, by Display Type,2021-2031
9.4.5.Rest of LAMEA
9.4.5.1.Market size analysis, by Product,2021-2031
9.4.5.2.Market size analysis, by Technology,2021-2031
9.4.5.3.Market size analysis, by Industry Vertical,2021-2031
9.4.5.4.Market size analysis, by Display Type,2021-2031
9.4.6.Research Dive Exclusive Insights
9.4.6.1.Market attractiveness
9.4.6.2.Competition heatmap
10.Competitive Landscape
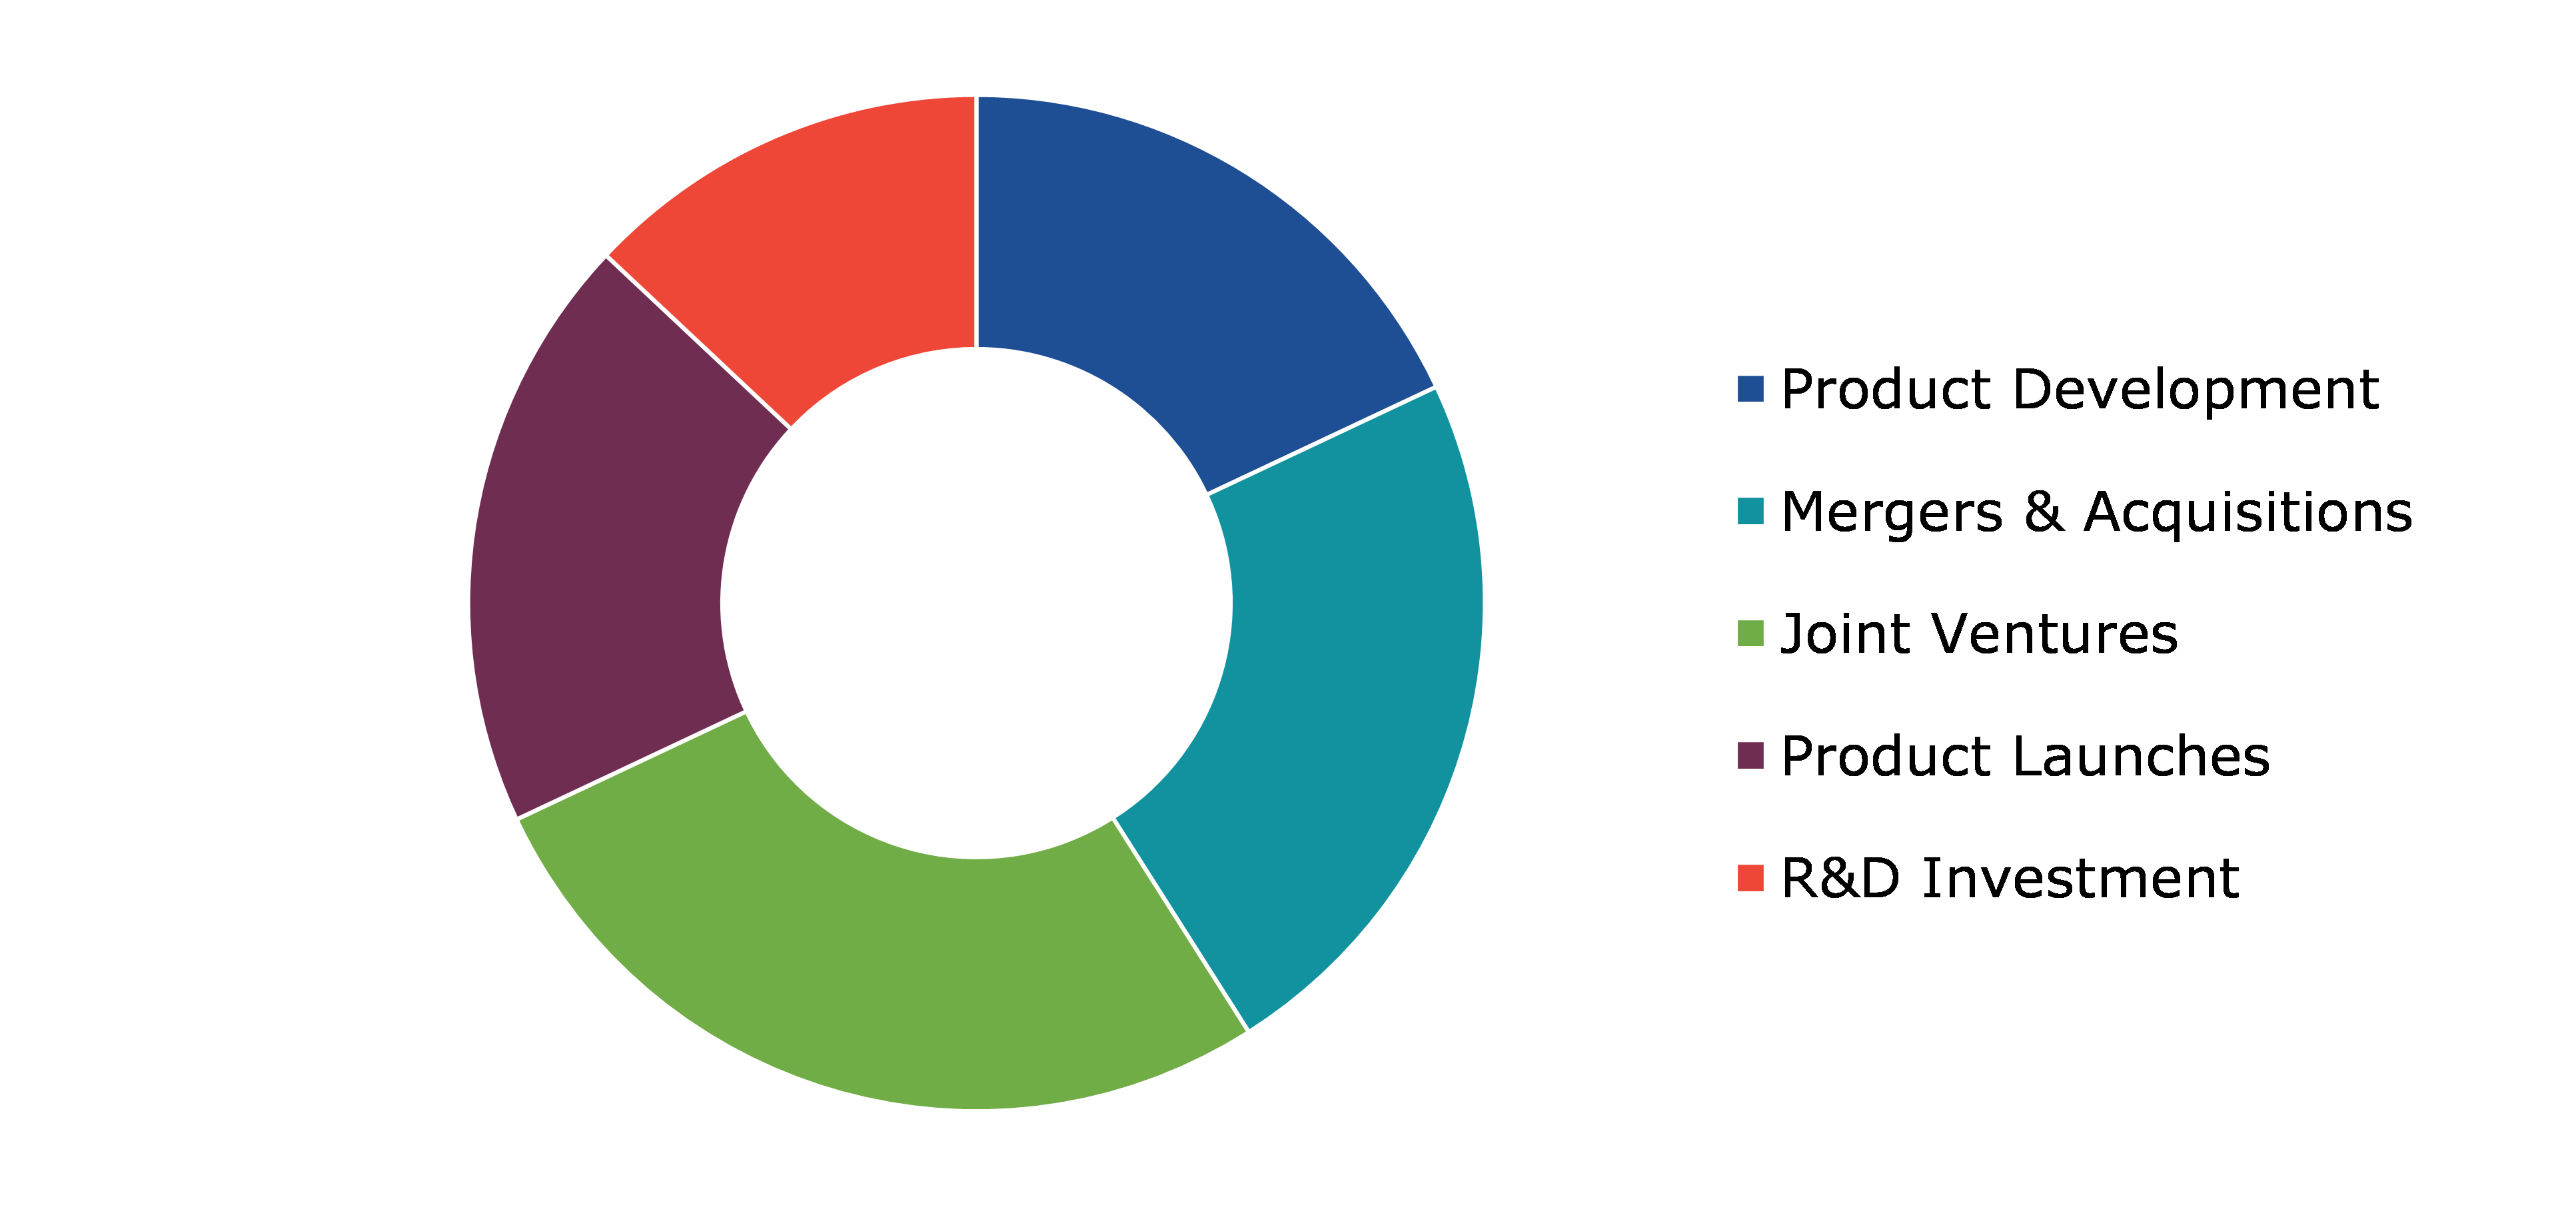
10.1.Top winning strategies, 2021
10.1.1.By strategy
10.1.2.By year
10.2.Strategic overview
10.3.Market share analysis, 2021
11.Company Profiles
11.1.Samsung Electronics Co Ltd
11.1.1.Overview
11.1.2.Business segments
11.1.3.Product portfolio
11.1.4.Financial performance
11.1.5.Recent developments
11.1.6.SWOT analysis
11.2.Sharp Corporation
11.2.1.Overview
11.2.2.Business segments
11.2.3.Product portfolio
11.2.4.Financial performance
11.2.5.Recent developments
11.2.6.SWOT analysis
11.3.Japan Display Inc
11.3.1.Overview
11.3.2.Business segments
11.3.3.Product portfolio
11.3.4.Financial performance
11.3.5.Recent developments
11.3.6.SWOT analysis
11.4.Innolux Corporation
11.4.1.Overview
11.4.2.Business segments
11.4.3.Product portfolio
11.4.4.Financial performance
11.4.5.Recent developments
11.4.6.SWOT analysis
11.5.NEC CORPORATION
11.5.1.Overview
11.5.2.Business segments
11.5.3.Product portfolio
11.5.4.Financial performance
11.5.5.Recent developments
11.5.6.SWOT analysis
11.6.Panasonic Corporation
11.6.1.Overview
11.6.2.Business segments
11.6.3.Product portfolio
11.6.4.Financial performance
11.6.5.Recent developments
11.6.6.SWOT analysis
11.7.BOE Technology Group Co., Ltd.
11.7.1.Overview
11.7.2.Business segments
11.7.3.Product portfolio
11.7.4.Financial performance
11.7.5.Recent developments
11.7.6.SWOT analysis
11.8.AUO Corporation
11.8.1.Overview
11.8.2.Business segments
11.8.3.Product portfolio
11.8.4.Financial performance
11.8.5.Recent developments
11.8.6.SWOT analysis
11.9.Sony Corporation
11.9.1.Overview
11.9.2.Business segments
11.9.3.Product portfolio
11.9.4.Financial performance
11.9.5.Recent developments
11.9.6.SWOT analysis
11.10.Leyard Optoelectronic Co., Ltd
11.10.1.Overview
11.10.2.Business segments
11.10.3.Product portfolio
11.10.4.Financial performance
11.10.5.Recent developments
11.10.6.SWOT analysis
A display panel is an output device which displays the information in visual form in any electronic device. With the help of vertical surface, it displays all the required visuals. Display panels are used to show information in a form of picture, video, or text. The display panels available at present are used in the manufacturing of LED and OLED screens, as these screens are suited with high mobility electronic equipment. The most common applications of display panels are in television sets, computer and laptop monitors, and smart phone screens.
Factors Attributing to the Growth of the Market
Popularity of new-generation electronic devices such as smartphone, television, computer monitor, laptops with sleek design, and smart watches is expected to drive the market growth in the forecast period. Another attributor of the growth of the market is the production and manufacturing of OLEDs and LED screens with high-definition with improved picture quality and color saturation. Moreover, increasing adoption of electronic devices by industries is predicted to boost the display panel market in the upcoming years.
Recent Strategies and Developments in the Industry
According to a recent report by Research Dive, the leading players of the global display panel market are LG Electronics., Hannstar display corporation, Chunghwa Picture Tubes, Ltd., BOE Technology Group Co., Ltd, Panasonic Corporation, SHARP CORPORATION, Japan Display Inc., Innolux Corporation, AU Optronics Corp., and SAMSUNG among others..
Various smart strategies are being adopted by these market players. These strategies include mergers and acquisitions, product innovation and launches, partnerships and collaborations, and current technology upgradation to obtain the highest market size.
Some of the recent advances of the market:
- As per a recent news, Panasonic Corporation made a public announcement about the collaboration treaty with GS-Solar (China) Company Ltd. in the field of photovoltaic technology. The agreement permits GS-Solar (China) to acquire Panasonic’s solar manufacturing subsidiary, Panasonic Energy Malaysia, while founding a new company with Panasonic. The new company will focus on the research and development of HIT technology. Both companies in the partnership will jointly perform the investment and operations in the new company.
- Japan Display Inc. (JDI), a leader in automotive displays has announced a collaboration with a leading automotive technology company Faurecia. The main aim of this partnership is to improve the user experience in the digitally operated vehicles. The joint venture will focus on the expansion and incorporation of large displays into automotive interiors.
- According to another news, Innolux Display Corp. has recently made an official announcement about the completion of its merger with Chi Mei Optoelectronics and TPO Displays Corp. After the merger, Innolux Display Corp. is renamed as Chimei Innolux Corporation. This mega-merger indicates the beginning of a new era in the global panel industry, according to industry leaders.
- Samsung Electronics announced about its completion of the acquisition of Harman International Industries, Incorporated (“HARMAN”) in 2017. Under the terms of the merger agreement, HARMAN stockholders received $112.00 per share in cash.
- As per another latest news, the LG Electronics (LG) has recently confirmed the acquisition of leading automotive solution provider ZKW Group, topping a deal almost EUR 1.1 billion, LG's largest acquisition till present. LG Electronics is going to gain a 70 percent stake in ZKW Group.
- On July 23, 2020, LG Display, the world's leading innovator of display technologies announced about the commencement of mass-production in earnest at its 8.5th generation (2,200mm x 2,500mm) OLED panel production plant in Guangzhou, China.
At its OLED panel construction plant in Paju, Korea, LG Display is currently producing 70,000 sheets every month. With this step, the production competence will almost reach to 130,000 sheets per month.
Conclusion
The global display panel market is experiencing a rising graph of growth during the forecast period with all these innovations and strategies. The new entrants and leading players of the market are emphasizing on sustaining the growth of the market by creating newer opportunities.
Personalize this research
- Triangulate with your own data
- Request your format and definition
- Get a deeper dive on a specific application, geography, customer or competitor
- + 1-888-961-4454 Toll - Free
- support@researchdive.com
