Global Power Sports Market Report
RA02937
Global Power Sports Market by Vehicle Type (All-Terrain Vehicles (ATV), Side by Side Vehicles, Personal Watercrafts, Snowmobiles, and Heavyweight Motorcycles), Application (On-Road and Off-Road), Propulsion (Gasoline, Diesel, and Electric), and Region (North America, Europe, Asia-Pacific, and LAMEA): Opportunity Analysis and Industry Forecast, 2023-2032
Power Sports Overview
Power sports, also known as motorsports or motorized sports, refer to various recreational activities and competitive events that involve vehicles with engines. These activities typically include a combination of speed, skill, and adrenaline, attracting enthusiasts and athletes alike. Motorcycle riding includes various disciplines such as street riding, sport riding, touring, and off-road riding (motocross, enduro, and trail riding). It offers a thrilling experience and is often associated with a sense of freedom. All-Terrain Vehicles (ATVs) or quads are four-wheeled vehicles designed for off-road use. They are known for their versatility and ability to handle rough terrains. ATVs are popular for recreational riding, racing, and utility purposes. Utility Terrain Vehicles (UTVs) or side-by-sides are off-road vehicles with seating for two or more passengers. They feature a roll cage for safety and are commonly used for recreational riding, exploring off-road trails, and work-related tasks in industries such as agriculture and construction.
Global Power Sports Market Analysis
The global power sports market size was $29,617.2 million in 2022 and is predicted to grow with a CAGR of 7.4%, by generating a revenue of $59,364.5 million by 2032.
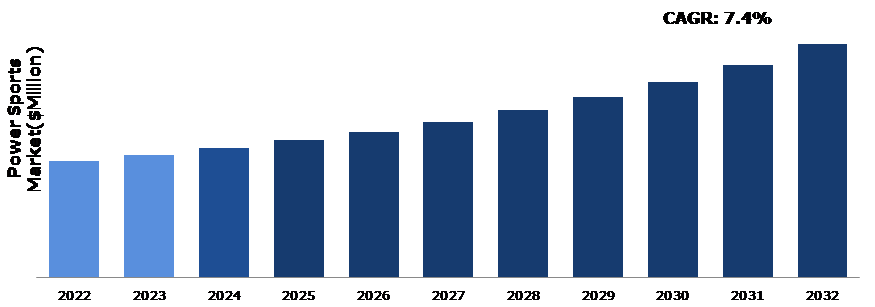
Source: Research Dive Analysis
COVID-19 Impact on Global Power Sports Market
The COVID-19 impact on power sports market has had a significant impact on the power sports market, as many power sports manufacturers faced challenges due to disruptions in the global supply chain. Factory closures, limited workforce, and restrictions on transportation affected production capacities and the availability of parts and components. Economic uncertainties, lockdowns, and social distancing measures significantly impacted consumer spending patterns. Reduced income levels and financial constraints also played a role in hampering demand for power sports. Moreover, power sports events, such as races, rallies, and exhibitions, were either canceled or postponed due to restrictions on public gatherings. Retailers and dealerships faced closures, reduced foot traffic, and limitations on physical interactions with customers. Many businesses had to adapt by implementing online sales channels, virtual consultations, and contactless delivery options to continue serving customers. Some consumers explored new hobbies and recreational activities during the pandemic.
Increasing Disposable Income to Drive the Market Growth
Rising disposable income levels across various regions have led to increased consumer spending on recreational activities, including power sports. Moreover, higher disposable income levels have expanded the target market for power sports manufacturers and retailers. More people now have the financial capacity to participate in power sports, leading to a broader customer base and increased sales. With higher disposable income, power sports enthusiasts are more likely to upgrade their existing vehicles or replace them with newer models. This trend drives the demand for the latest features, improved performance, and more technologically advanced power sports vehicles. As discretionary income rises, individuals have more money to spend on leisure activities. Power sports, such as off-road riding, water sports, and winter sports, provide thrilling and exciting experiences that are appealing to consumers with higher disposable income. Furthermore, along with power sports vehicles, consumers also tend to spend on accessories, safety gear, and aftermarket products to enhance their overall experience. The disposable income allows them to invest in additional items that complement their power sports vehicles. These factors are anticipated to boost the market share during the forecast period.
To know more about global power sports market drivers, get in touch with our analysts here.
High Initial and Maintenance Costs to Restrain the Market Growth
Power sports vehicles, particularly high-performance models or those equipped with advanced technology, often come with a hefty price tag. The cost can vary depending on the type of vehicle, brand, features, and customization options. Moreover, power sports vehicles require regular maintenance to ensure optimal performance and longevity. Maintenance costs can include routine services, parts replacement, and repairs. The specialized features of power sports vehicles may also require owners to seek out specialized mechanics, which can be more expensive than traditional automotive maintenance. In addition, power sports vehicles typically require insurance coverage, which can be relatively high compared to regular automobile insurances. Factors such as the vehicle's value, performance capabilities, and the owner's driving history can influence insurance premiums. The power sports market trend in vehicles, especially those with high-performance engines, may consume more fuel compared to standard vehicles. This can result in increased fuel expenses, particularly for owners who frequently use their vehicles or engage in activities that require sustained power, which is anticipated to hamper the power sports market growth.
Increasing Consumer Interest to Drive Excellent Opportunities
The power sports industry has been experiencing an increase in consumer interest and participation. People are seeking outdoor recreational activities and adventure sports, which is driving the demand for power sports vehicles. There are significant opportunities for innovation and technological advancements in the power sports market share. Manufacturers are constantly improving automobile performance, durability, and security features, and incorporating new technologies such as electric powertrains and advanced connectivity options. Moreover, the shift closer to electric-powered automobiles is a major trend in the automotive industry, and it is also making its way into the power sports market growth. Electric powertrains offer advantages such as reduced noise, lower emissions, and potentially lower operating costs. There is a rising demand for electric ATVs, motorcycles, and different strength sports activities vehicles, presenting opportunities for manufacturers to develop and market electric-powered options. In addition, power sports enthusiasts often seek customization options to personalize their vehicles according to their preferences and style. This creates opportunities for aftermarket accessories, performance parts, and customization services. Companies can cater to this demand by offering a wide range of customization options and partnering with enthusiasts and aftermarket specialists.
To know more about global power sports market opportunities, get in touch with our analysts here.
Global Power Sports Market Size, by Vehicle Type, 2022
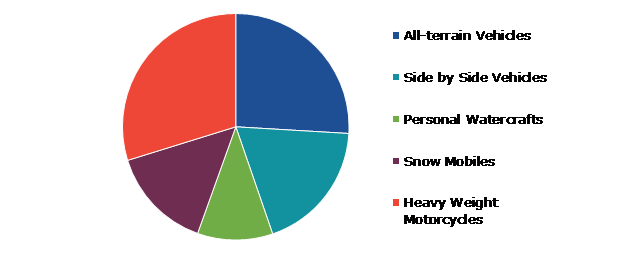
Source: Research Dive Analysis
The heavyweight motorcycles sub-segment accounted for the highest market share in 2022. Heavyweight motorcycles are known for their high-performance capabilities and powerful engines. Enthusiasts and riders who seek exhilarating experiences are attracted to these bikes due to their impressive speed, acceleration, and overall performance. Heavyweight motorcycles often carry a certain level of prestige and style. Many riders are drawn to the image and status associated with owning and riding these bikes. Moreover, heavyweight motorcycles are popular among riders who enjoy long-distance touring and exploring the open road. These bikes offer comfort, stability, and ample storage capacity, making them suitable for extended rides and adventures. Features like windshields, large fuel tanks, and comfortable seating positions enhance the touring experience. Heavyweight motorcycles provide a wide range of customization options, allowing riders to tailor their bikes according to their preferences and individuality. Custom paint jobs, aftermarket accessories, and modifications enable riders to create unique and personalized machines that reflect their personality and style.
Global Power Sports Market Share, by Application, 2022

Source: Research Dive Analysis
The off-road sub-segment accounted for the highest market share in 2022. Off-roading provides a sense of adventure and thrill to enthusiasts. People enjoy exploring challenging terrains, conquering obstacles, and experiencing the freedom and excitement that off-road vehicles offer. These activities have gained popularity among individuals and families seeking to spend time outdoors and connect with nature. Off-road vehicles enable them to access remote areas and enjoy outdoor adventures, driving the demand for off-road vehicles. Off-road vehicles offer a high degree of customization and personalization options. Enthusiasts can modify their vehicles with various aftermarket parts and accessories to enhance performance, aesthetics, and functionality. This customization culture attracts consumers who want to personalize their vehicles according to their preferences and create unique off-road machines. Off-road vehicles also serve practical purposes in various industries, including agriculture, construction, forestry, and military. These vehicles are used for transportation, hauling heavy loads, navigating challenging terrains, and performing tasks in remote areas. The utility and work applications of off-road vehicles contribute to their demand in the commercial sector.
Global Power Sports Market Growth, by Propulsion, 2022

Source: Research Dive Analysis
The gasoline sub-segment accounted for the highest market share in 2022. Gasoline engines are known for their high-power output and performance capabilities. Power sports enthusiasts often seek vehicles with superior acceleration, speed, and towing capacity, and gasoline engines typically deliver better performance in these areas compared to alternative power sources like electric motors. Moreover, gasoline-powered vehicles provide greater range and versatility compared to some electric alternatives, particularly in off-road or remote areas where charging infrastructure may be limited. Gasoline-powered vehicles can be easily refueled, allowing for extended periods of use without the need for recharging. Furthermore, gasoline fueling infrastructure is well-established and readily available in most regions, making it convenient for power sports enthusiasts to refuel their vehicles. This infrastructure includes gas stations, fuel delivery services, and a robust supply chain that supports the distribution of gasoline. In addition, gasoline-powered vehicles often have a lower upfront cost compared to electric counterparts, making them more accessible and affordable for many consumers. In addition, the cost of gasoline is generally lower than the cost of electricity, providing a cost advantage over electric-powered alternatives, especially in regions where electricity prices are relatively high.
Global Power Sports Market Size & Forecast, by Region, 2022-2032 ($Million)
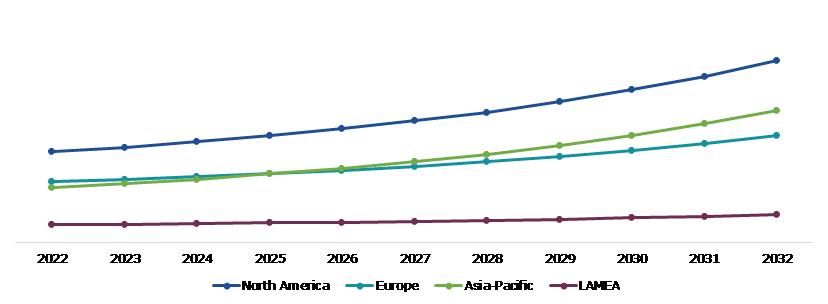
Source: Research Dive Analysis
The North America power sports market generated the highest revenue in 2022. The North America market has a high demand for power sports vehicles such as motorcycles, all-terrain vehicles (ATVs), side-by-side vehicles, and snowmobiles. These vehicles are popular among outdoor enthusiasts, adventure seekers, and individuals looking for recreational activities. Power sports vehicles provide an exciting and thrilling experience for riders. North America's vast landscapes, diverse terrains, and extensive trail networks offer ample opportunities for power sports enthusiasts to explore and engage in recreational activities. Riding motorcycles, off-roading, and participating in motorsports events are considered as hobbies by many enthusiasts. The power sports industry caters to this culture by offering a wide range of vehicles, accessories, and events. North America attracts a significant number of tourists, both domestic and international, who seek adventure and outdoor experiences. Power sports activities such as off-roading, snowmobiling, and jet skiing contribute to the tourism industry by providing unique and thrilling experiences to visitors. North America has a robust economy with high disposable income levels, which allows individuals to afford power sports vehicles and related equipment. In addition, the availability of financing options and favorable interest rates make it easier for consumers to purchase these vehicles in the region.
Competitive Scenario in the Global Power Sports market
Investment and agreement are common strategies followed by major market players. For instance, in July 2020, Polaris Inc., a U.S.-based manufacturer of power sport vehicles, launched RideReady, an industry-first on-demand digital service platform. The new RideReady digital strategy aims at leveraging digital solutions and technology for providing industry-leading tools, which break down the barriers of ownership, build affinity and loyalty with existing customers, and introduce power sports to new people. RideReady connects the power sports owners and dealers with Indian Motorcycle and Polaris dealerships for easily scheduling service appointments online.
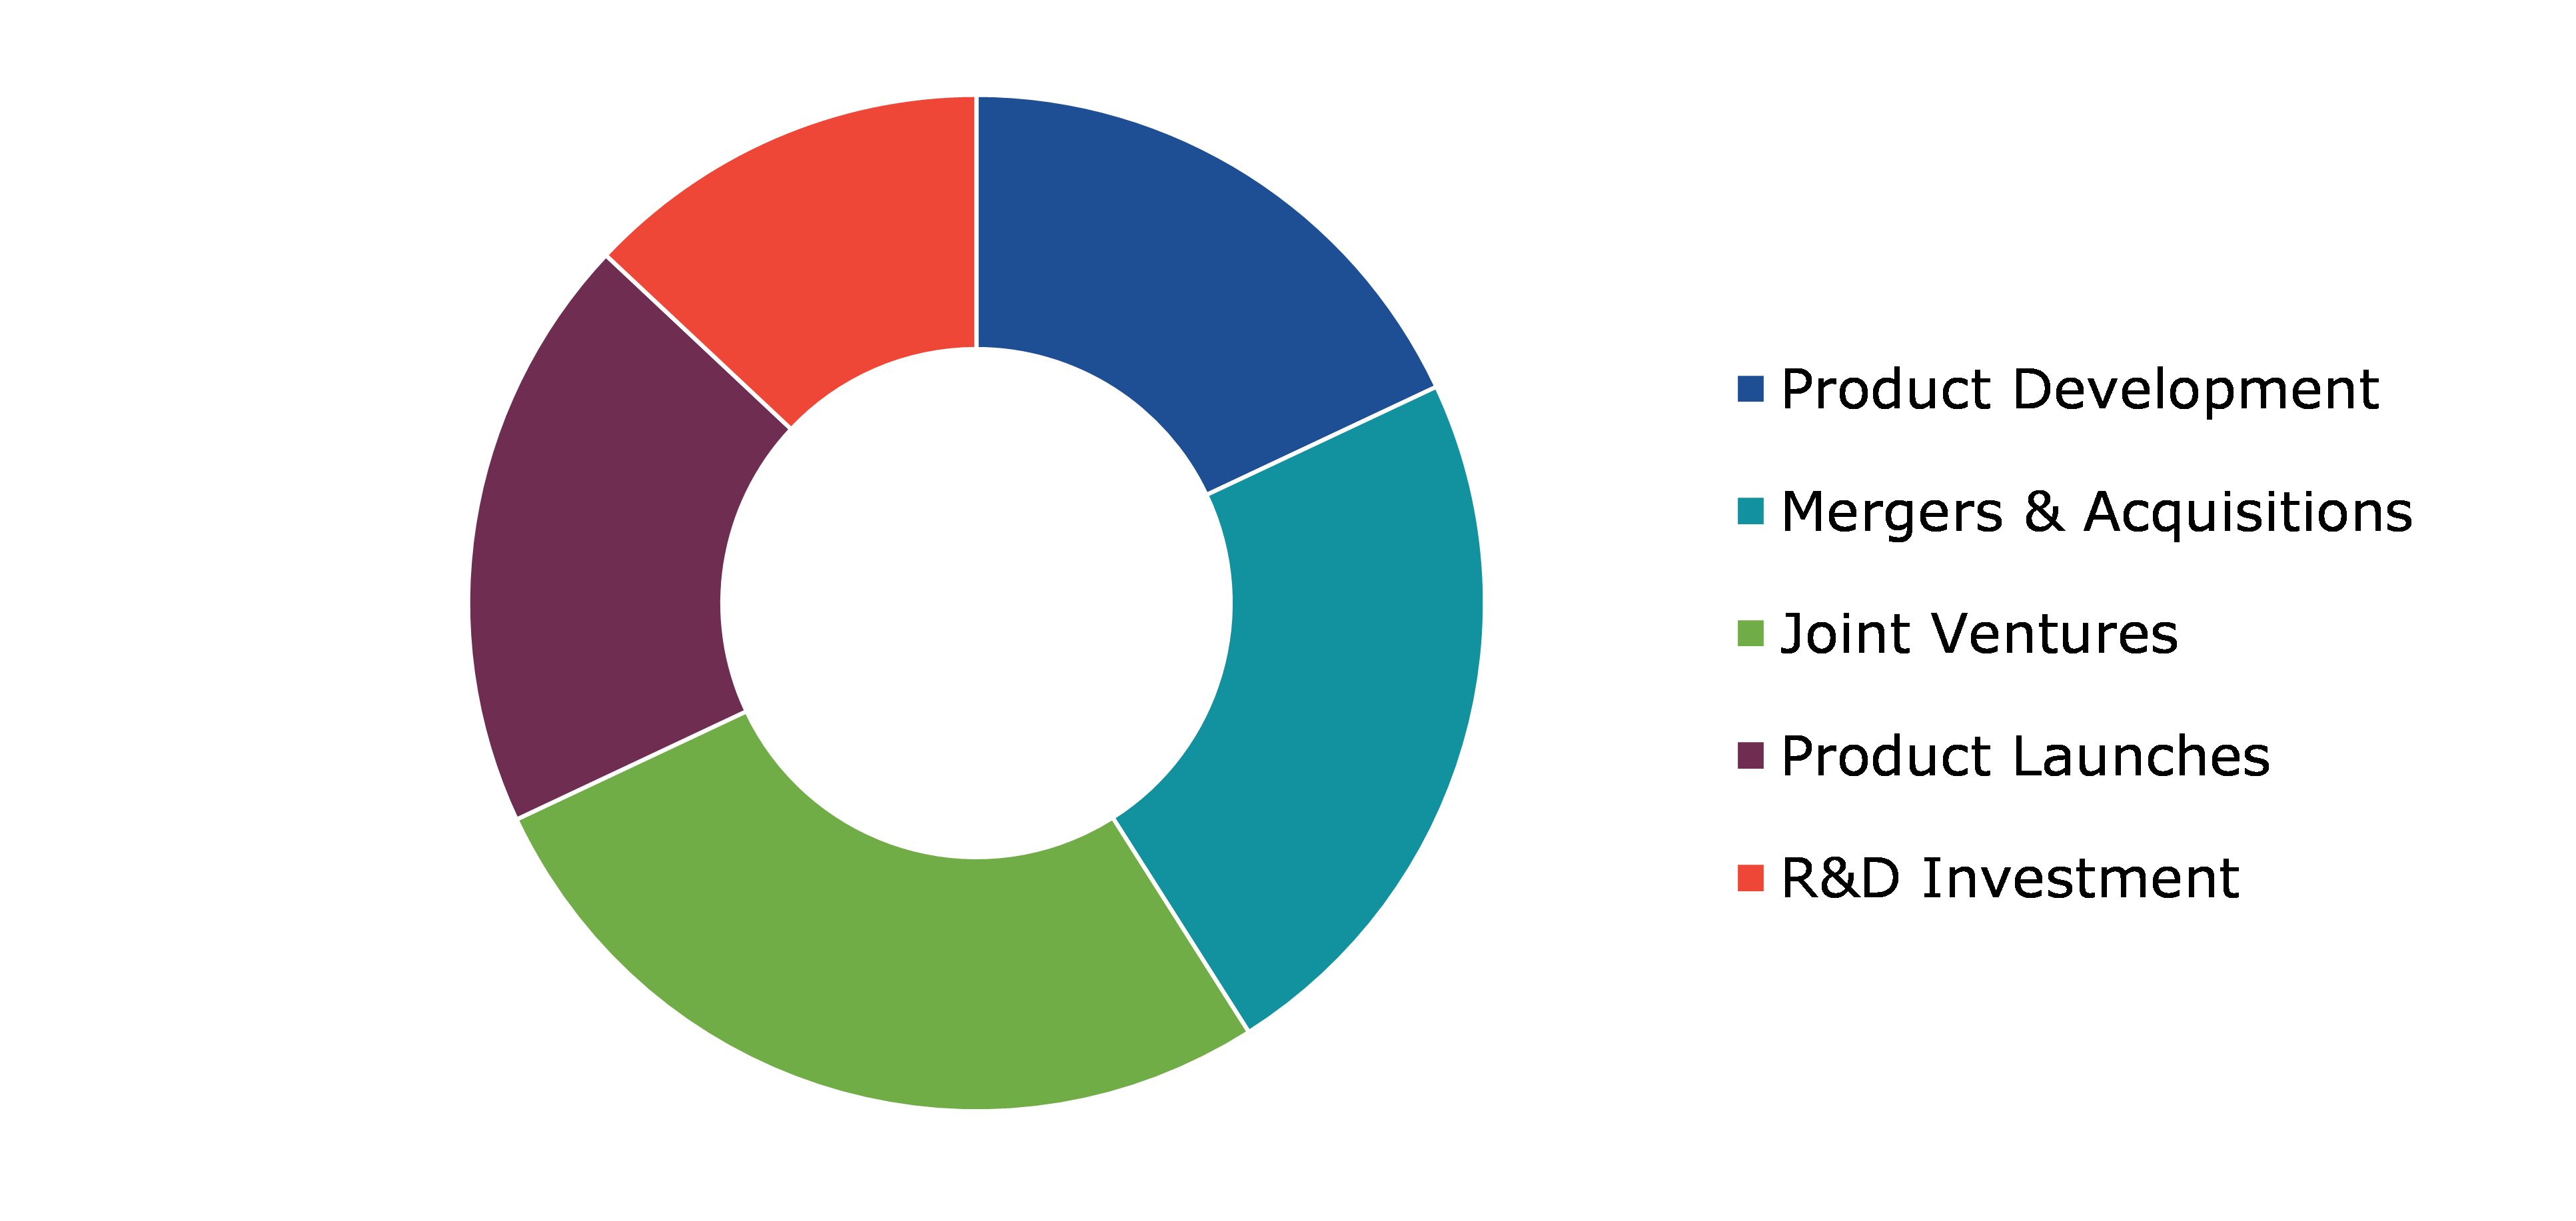
Source: Research Dive Analysis
Some of the leading power sports market analysis players are Polaris Inc., Arctic Cat Inc., Bombardier Recreational Products Inc., Suzuki Motor Corporation, Yamaha Motor Co., Ltd., Kawasaki Motors, Ltd., RumbleOn INC., Honda Motor Co., Ltd., Harley Davidson, Inc., and Kubota Corporation.
| Aspect | Particulars |
| Historical Market Estimations | 2020-2021 |
| Base Year for Market Estimation | 2022 |
| Forecast Timeline for Market Projection | 2023-2032 |
| Geographical Scope | North America, Europe, Asia-Pacific, and LAMEA |
| Segmentation by Vehicle Type |
|
| Segmentation by Application |
|
|
Segmentation by Propulsion
|
|
| Key Companies Profiled |
|
Q1. What is the size of the global power sports market?
A. The global power sports market size was over $29,617.2 million in 2022 and is projected to reach $59,364.5 million by 2032.
Q2. Which are the major companies in the power sports market?
A. Polaris Inc., Arctic Cat Inc., and Bombardier Recreational Products Inc. are some of the key players in the global power sports market.
Q3. Which region, among others, possesses greater investment opportunities in the future?
A. Asia-Pacific possesses great investment opportunities for investors in the future.
Q4. What will be the growth rate of the Asia-Pacific power sports market?
A. Asia-Pacific power sports market share is anticipated to grow at 9.4% CAGR during the forecast period.
Q5. What are the strategies opted by the leading players in this market?
A. Agreement and investment are the two key strategies opted by the operating companies in this market.
Q6. Which companies are investing more on R&D practices?
A. Suzuki Motor Corporation, Yamaha Motor Co., Ltd., and Kawasaki Motors, Ltd. are the companies investing more on R&D activities for developing new products and technologies.
1.Research Methodology
1.1.Desk Research
1.2.Real time insights and validation
1.3.Forecast model
1.4.Assumptions and forecast parameters
1.5.Market size estimation
1.5.1.Top-down approach
1.5.2.Bottom-up approach
2.Report Scope
2.1.Market definition
2.2.Key objectives of the study
2.3.Report overview
2.4.Market segmentation
2.5.Overview of the impact of COVID-19 on Global power sports market
3.Executive Summary
4.Market Overview
4.1.Introduction
4.2.Growth impact forces
4.2.1.Drivers
4.2.2.Restraints
4.2.3.Opportunities
4.3.Market value chain analysis
4.3.1.List of raw material suppliers
4.3.2.List of manufacturers
4.3.3.List of distributors
4.4.Innovation & sustainability matrices
4.4.1.Technology matrix
4.4.2.Regulatory matrix
4.5.Porter’s five forces analysis
4.5.1.Bargaining power of suppliers
4.5.2.Bargaining power of consumers
4.5.3.Threat of substitutes
4.5.4.Threat of new entrants
4.5.5.Competitive rivalry intensity
4.6.PESTLE analysis
4.6.1.Political
4.6.2.Economical
4.6.3.Social
4.6.4.Technological
4.6.5.Environmental
4.7.Impact of COVID-19 on power sports market
4.7.1.Pre-covid market scenario
4.7.2.Post-covid market scenario
5.Power Sports Market Analysis, by Vehicle Type
5.1.Overview
5.2.All-terrain Vehicles (ATV)
5.2.1.Definition, key trends, growth factors, and opportunities
5.2.2.Market size analysis, by region, 2022-2032
5.2.3.Market share analysis, by country, 2022-2032
5.3.Side by Side Vehicles
5.3.1.Definition, key trends, growth factors, and opportunities
5.3.2.Market size analysis, by region, 2022-2032
5.3.3.Market share analysis, by country, 2022-2032
5.4.Personal Watercrafts
5.4.1.Definition, key trends, growth factors, and opportunities
5.4.2.Market size analysis, by region, 2022-2032
5.4.3.Market share analysis, by country, 2022-2032
5.5.Snowmobiles
5.5.1.Definition, key trends, growth factors, and opportunities
5.5.2.Market size analysis, by region, 2022-2032
5.5.3.Market share analysis, by country, 2022-2032
5.6.Heavyweight Motorcycles
5.6.1.Definition, key trends, growth factors, and opportunities
5.6.2.Market size analysis, by region, 2022-2032
5.6.3.Market share analysis, by country, 2022-2032
5.7.Research Dive Exclusive Insights
5.7.1.Market attractiveness
5.7.2.Competition heatmap
6.Power Sports Market Analysis, by Application
6.1.On-Road
6.1.1.Definition, key trends, growth factors, and opportunities
6.1.2.Market size analysis, by region, 2022-2032
6.1.3.Market share analysis, by country, 2022-2032
6.2.Off-Road
6.2.1.Definition, key trends, growth factors, and opportunities
6.2.2.Market size analysis, by region, 2022-2032
6.2.3.Market share analysis, by country, 2022-2032
6.3.Research Dive Exclusive Insights
6.3.1.Market attractiveness
6.3.2.Competition heatmap
7.Power Sports Market Analysis, by Propulsion
7.1.Gasoline
7.1.1.Definition, key trends, growth factors, and opportunities
7.1.2.Market size analysis, by region, 2022-2032
7.1.3.Market share analysis, by country, 2022-2032
7.2.Diesel
7.2.1.Definition, key trends, growth factors, and opportunities
7.2.2.Market size analysis, by region, 2022-2032
7.2.3.Market share analysis, by country, 2022-2032
7.3.Electric
7.3.1.Definition, key trends, growth factors, and opportunities
7.3.2.Market size analysis, by region, 2022-2032
7.3.3.Market share analysis, by country, 2022-2032
7.4.Research Dive Exclusive Insights
7.4.1.Market attractiveness
7.4.2.Competition heatmap
8.Power Sports Market, by Region
8.1.North America
8.1.1.U.S.
8.1.1.1.Market size analysis, by Vehicle Type, 2022-2032
8.1.1.2.Market size analysis, by Application, 2022-2032
8.1.1.3.Market size analysis, by Propulsion, 2022-2032
8.1.2.Canada
8.1.2.1.Market size analysis, by Vehicle Type, 2022-2032
8.1.2.2.Market size analysis, by Application, 2022-2032
8.1.2.3.Market size analysis, by Propulsion, 2022-2032
8.1.3.Mexico
8.1.3.1.Market size analysis, by Vehicle Type, 2022-2032
8.1.3.2.Market size analysis, by Application, 2022-2032
8.1.3.3.Market size analysis, by Propulsion, 2022-2032
8.1.4.Research Dive Exclusive Insights
8.1.4.1.Market attractiveness
8.1.4.2.Competition heatmap
8.2.Europe
8.2.1.Germany
8.2.1.1.Market size analysis, by Vehicle Type, 2022-2032
8.2.1.2.Market size analysis, by Application, 2022-2032
8.2.1.3.Market size analysis, by Propulsion, 2022-2032
8.2.2.UK
8.2.2.1.Market size analysis, by Vehicle Type, 2022-2032
8.2.2.2.Market size analysis, by Application, 2022-2032
8.2.2.3.Market size analysis, by Propulsion, 2022-2032
8.2.3.France
8.2.3.1.Market size analysis, by Vehicle Type, 2022-2032
8.2.3.2.Market size analysis, by Application, 2022-2032
8.2.3.3.Market size analysis, by Propulsion, 2022-2032
8.2.4.Spain
8.2.4.1.Market size analysis, by Vehicle Type, 2022-2032
8.2.4.2.Market size analysis, by Application, 2022-2032
8.2.4.3.Market size analysis, by Propulsion, 2022-2032
8.2.5.Italy
8.2.5.1.Market size analysis, by Vehicle Type, 2022-2032
8.2.5.2.Market size analysis, by Application, 2022-2032
8.2.5.3.Market size analysis, by Propulsion, 2022-2032
8.2.6.Rest of Europe
8.2.6.1.Market size analysis, by Vehicle Type, 2022-2032
8.2.6.2.Market size analysis, by Application, 2022-2032
8.2.6.3.Market size analysis, by Propulsion, 2022-2032
8.2.7.Research Dive Exclusive Insights
8.2.7.1.Market attractiveness
8.2.7.2.Competition heatmap
8.3.Asia-Pacific
8.3.1.China
8.3.1.1.Market size analysis, by Vehicle Type, 2022-2032
8.3.1.2.Market size analysis, by Application, 2022-2032
8.3.1.3.Market size analysis, by Propulsion, 2022-2032
8.3.2.Japan
8.3.2.1.Market size analysis, by Vehicle Type, 2022-2032
8.3.2.2.Market size analysis, by Application, 2022-2032
8.3.2.3.Market size analysis, by Propulsion, 2022-2032
8.3.3.India
8.3.3.1.Market size analysis, by Vehicle Type, 2022-2032
8.3.3.2.Market size analysis, by Application, 2022-2032
8.3.3.3.Market size analysis, by Propulsion, 2022-2032
8.3.4.Australia
8.3.4.1.Market size analysis, by Vehicle Type, 2022-2032
8.3.4.2.Market size analysis, by Application, 2022-2032
8.3.4.3.Market size analysis, by Propulsion, 2022-2032
8.3.5.South Korea
8.3.5.1.Market size analysis, by Vehicle Type, 2022-2032
8.3.5.2.Market size analysis, by Application, 2022-2032
8.3.5.3.Market size analysis, by Propulsion, 2022-2032
8.3.6.Rest of Asia-Pacific
8.3.6.1.Market size analysis, by Vehicle Type, 2022-2032
8.3.6.2.Market size analysis, by Application, 2022-2032
8.3.6.3.Market size analysis, by Propulsion, 2022-2032
8.3.7.Research Dive Exclusive Insights
8.3.7.1.Market attractiveness
8.3.7.2.Competition heatmap
8.4.LAMEA
8.4.1.Brazil
8.4.1.1.Market size analysis, by Vehicle Type, 2022-2032
8.4.1.2.Market size analysis, by Application, 2022-2032
8.4.1.3.Market size analysis, by Propulsion, 2022-2032
8.4.2.Saudi Arabia
8.4.2.1.Market size analysis, by Vehicle Type, 2022-2032
8.4.2.2.Market size analysis, by Application, 2022-2032
8.4.2.3.Market size analysis, by Propulsion, 2022-2032
8.4.3.UAE
8.4.3.1.Market size analysis, by Vehicle Type, 2022-2032
8.4.3.2.Market size analysis, by Application, 2022-2032
8.4.3.3.Market size analysis, by Propulsion, 2022-2032
8.4.4.South Africa
8.4.4.1.Market size analysis, by Vehicle Type, 2022-2032
8.4.4.2.Market size analysis, by Application, 2022-2032
8.4.4.3.Market size analysis, by Propulsion, 2022-2032
8.4.5.Rest of LAMEA
8.4.5.1.Market size analysis, by Vehicle Type, 2022-2032
8.4.5.2.Market size analysis, by Application, 2022-2032
8.4.5.3.Market size analysis, by Propulsion, 2022-2032
8.4.6.Research Dive Exclusive Insights
8.4.6.1.Market attractiveness
8.4.6.2.Competition heatmap
9.Competitive Landscape
9.1.Top winning strategies, 2022
9.1.1.By strategy
9.1.2.By year
9.2.Strategic overview
9.3.Market share analysis, 2022
10.Company Profiles
10.1.Polaris Inc.
10.1.1.Overview
10.1.2.Business segments
10.1.3.Product portfolio
10.1.4.Financial performance
10.1.5.Recent developments
10.1.6.SWOT analysis
10.2.Arctic Cat Inc.
10.2.1.Overview
10.2.2.Business segments
10.2.3.Product portfolio
10.2.4.Financial performance
10.2.5.Recent developments
10.2.6.SWOT analysis
10.3.Bombardier Recreational Products Inc.
10.3.1.Overview
10.3.2.Business segments
10.3.3.Product portfolio
10.3.4.Financial performance
10.3.5.Recent developments
10.3.6.SWOT analysis
10.4.Suzuki Motor Corporation
10.4.1.Overview
10.4.2.Business segments
10.4.3.Product portfolio
10.4.4.Financial performance
10.4.5.Recent developments
10.4.6.SWOT analysis
10.5.Yamaha Motor Co., Ltd.
10.5.1.Overview
10.5.2.Business segments
10.5.3.Product portfolio
10.5.4.Financial performance
10.5.5.Recent developments
10.5.6.SWOT analysis
10.6.Kawasaki Motors, Ltd.
10.6.1.Overview
10.6.2.Business segments
10.6.3.Product portfolio
10.6.4.Financial performance
10.6.5.Recent developments
10.6.6.SWOT analysis
10.7.RumbleOn INC.
10.7.1.Overview
10.7.2.Business segments
10.7.3.Product portfolio
10.7.4.Financial performance
10.7.5.Recent developments
10.7.6.SWOT analysis
10.8.Honda Motor Co., Ltd.
10.8.1.Overview
10.8.2.Business segments
10.8.3.Product portfolio
10.8.4.Financial performance
10.8.5.Recent developments
10.8.6.SWOT analysis
10.9.Harley Davidson, Inc.
10.9.1.Overview
10.9.2.Business segments
10.9.3.Product portfolio
10.9.4.Financial performance
10.9.5.Recent developments
10.9.6.SWOT analysis
10.10.Kubota Corporation
10.10.1.Overview
10.10.2.Business segments
10.10.3.Product portfolio
10.10.4.Financial performance
10.10.5.Recent developments
10.10.6.SWOT analysis
Personalize this research
- Triangulate with your own data
- Request your format and definition
- Get a deeper dive on a specific application, geography, customer or competitor
- + 1-888-961-4454 Toll - Free
- support@researchdive.com
