Global Volumetric Display Market Report
RA00191
Global Volumetric Display Market by Type (Swept Volumetric Displays, Holographic Displays, and Static Volumetric Displays), Technology (Digital Light Processing (DLP) and Liquid Crystal on Silicon (LCOS)), Application (Aerospace & Defense, Medical, Automotive, Communication & Entertainment, and Others), and Region (North America, Europe, Asia-Pacific, and LAMEA): Opportunity Analysis and Industry Forecast, 2022-2031
Volumetric Display Overview
A volumetric display is a kind of display technology that projects light or voxels (volumetric pixels) into space to produce a three-dimensional image or visual representation of an item or scene. Unlike conventional two-dimensional displays that project flat pictures on a screen, such as TVs and computer monitors, volumetric displays produce images that seem to have depth and occupy real space. There are various types of volumetric displays, including holographic displays, swept-volume displays, and static volume displays.
Volumetric displays' main goal is to create a visual representation of an object or scene that takes up a volume of space rather than a flat plane. This is accomplished by projecting the picture from various angles or generating light, which creates a 3D image that can be viewed from various perspectives. This technique utilizes a display medium that rotates quickly, such as a revolving LED array or mirror. The spectator can perceive a 3D image made of light produced from various places owing to the rotation's creation of constancy of vision.
Global Volumetric Display Market Analysis
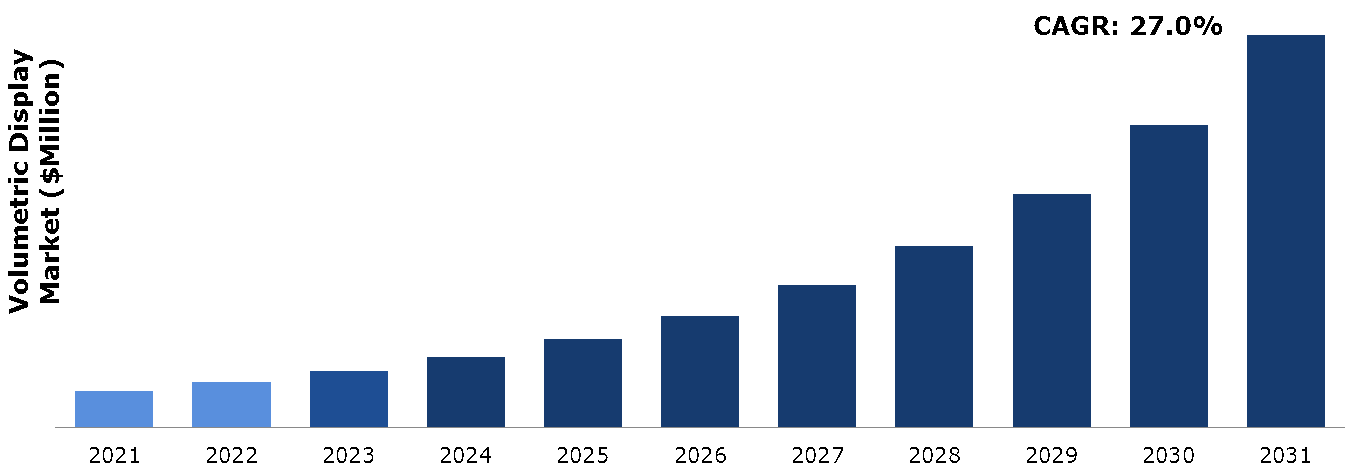
The Global Volumetric Display Market Size was $1,389.9 million in 2021 and is predicted to grow with a CAGR of 27.0%, by generating a revenue of $14,794.9 million by 2031.
Source: Research Dive Analysis
COVID-19 Impact on Global Volumetric Display Market
The COVID-19 pandemic had a mixed impact on the volumetric display market. The pandemic affected global industry and supply systems, delayed the launch of products and reduced production capacity. The pandemic led to adoption of online communication and collaboration tools and opened new applications for volumetric displays. Manufacturers experienced difficulties procuring the essential parts and components as a result, which slowed down production. The outbreak, however, also raised demand for remote collaboration tools and created new applications for volumetric displays.
As more people were required to work from home, there has been an increase in demand for technology that facilitates remote communication and collaboration. Surround screens offer a clear benefit over conventional video conferencing systems that makes the experience more immersive and interesting by allowing users to view 3D objects and visual representations from various points of view. The pandemic created challenges for the volumetric display industry, but it has also opened new business prospects as the need for communication and distant collaboration tools increases.
Rising Demand for 3D Visualization to Drive the Market Growth
A variety of applications, including gaming, advertising, and medical imaging, require volumetric displays to create immersive experiences. 3D visualization solutions are in high demand since they provide a unique visual experience Due to its ability to produce 3D objects that can be seen from various perspectives. In the medical industry, volumetric displays are used to provide 3D visualizations of human anatomy, facilitating improved diagnosis, treatment planning, and teaching. In addition, the gaming industry uses volumetric displays to produce immersive gaming environments that allow players to view 3D objects and environments from many different perspectives. Volumetric displays are also used in the advertising sector to create eye-catching advertisements that transcend standard 2D advertisements. In addition, technological advancements such as faster processors, better graphics, and higher resolution displays have made it possible to produce more realistic and in-depth 3D visualizations. Demand for volumetric displays that can deliver an immersive and interactive experience has increased as a consequence of technology. The increasing demand for 3D visualization solutions in various industries is driving the growth of the volumetric display market.
To know more about global volumetric display market drivers, get in touch with our analysts here.
High Cost of Volumetric Displays to Restrain the Market Growth
Consumer and commercial use of volumetric displays is still constrained by the displays' high manufacturing and acquisition costs. Smaller businesses may find it challenging to invest in these displays because of their high production and purchasing costs when compared to conventional 2D displays. This can be done by persuading more businesses to enter the market or by pushing display technologies that compete with volumetric displays. To make volumetric displays more affordable, one strategy is to enhance the production process. Utilizing materials or production techniques that are more cost-effective overall could be an aspect of this. Therefore, the high production cost is anticipated to hamper the volumetric display market growth.
Increasing Demand in the Healthcare Sector to Drive Excellent Opportunities
The accuracy of diagnosis and treatment planning can be increased by using volumetric displays, which can provide extremely realistic, 3D representations of medical imaging such as CT and MRI scans. With applications in medical imaging, surgical planning, and medical teaching, the healthcare industry is one of the largest and fastest growing sectors for volumetric displays. Doctors and surgeons can visualize and prepare for difficult procedures in advance by using volumetric displays to build 3D models of organs, bones, and other anatomical features. For patients with lower risks and quicker recoveries, this may result in better results. Medical students and trainees may explore and understand anatomy in a more interactive and immersive trends with the help of volumetric displays in the classroom. In addition to better preparing children for situations in the real world, this can also help them learn and retain difficult medical ideas. The rising demand for volumetric displays in the healthcare industry offers a sizable potential for businesses in this sector. They can expect to see volumetric displays used in medical applications more frequently as the technology advances and costs come down, which is expected to enhance patient outcomes and healthcare delivery.
To know more about global volumetric display market opportunities, get in touch with our analysts here.
Global Volumetric Display Market Size, by Type, 2021

Source: Research Dive Analysis
The holographic displays sub-segment accounted for the highest market share in 2022. Holographic displays are primarily demanded for advanced visualization technologies across various industries. Holographic displays offer a unique three-dimensional viewing experience that can be used for a wide range of applications, including entertainment, advertising, medical imaging, engineering design, and scientific visualization. Such displays are made using cutting-edge technological innovation and are portable and well suited to meet market demands. Modern holographic display technologies, such holo fans, which spin while displaying 3D video information on their arms, produce an image in mid-air. The short span of communication effectively requires new strategies. Social media and content marketing are already overloaded and undergoing transition for a competitive edge. Communication can be made more interactive and commanding with longer impact and retention in the subconscious level of a person.
Global Volumetric Display Market Share, by Technology, 2021

Source: Research Dive Analysis
The digital light processing (DLP) sub-segment accounted for the highest market share in 2022. An optical micro-electro-mechanical digital micromirror device is the foundation of the display technology known as digital light processing (DLP). DLP is utilized for a range of display applications, including conventional static displays, interactive displays, and non-traditional embedded applications including medical, safety, and industrial applications. In contrast to traditional displays, which are only capable of 2D representation, volumetric displays provide an immersive experience by projecting light into a specified volume to create a 3D picture that can be viewed from different angles. DLP produces high-resolution pictures by modulating light using a system of small mirrors. By quickly adjusting the angle of rotation, these mirrors reflect light either towards or away from the spectator, producing a grayscale image. DLP, which represents digital light processing uses mirrors and color wheels to reflect and filter the projected light. For home and business use, the DLP projector uses a reflective panel for all three colors.
Global Volumetric Display Market Analysis, by Application, 2021

Source: Research Dive Analysis
The medical sub-segment accounted for the highest market share in 2022. Volumetric displays provide three-dimensional representations of medical data, allowing healthcare professionals to better understand and analyze complex anatomical structures, medical images, and diagnostic information. Volumetric medical imaging, such as CT, magnetic resonance imaging (MRI), or digital breast tomosynthesis (DBT), helps retain the 3D nature of the body’s internal structures by stacking multiple cross-sectional images. Volumetric displays can be used for surgical planning by allowing surgeons to visualize patient-specific anatomy in 3D before the actual procedure. This helps in precise surgical planning and reducing the risk of complications. Volumetric displays also have potential in surgical training and simulation, providing a realistic representation of patient anatomy for trainee surgeons to practice procedures. Volumetric displays can aid in medical education by providing a more engaging and interactive learning experience. Medical students can visualize complex anatomical structures in 3D, improving their understanding of the human body.
Global Volumetric Display Market Size & Forecast, by Region, 2021-2031 ($Million)

Source: Research Dive Analysis
The North America volumetric display market generated the highest revenue in 2021. North America is known for its highly advanced technology and the region's increasing adoption of modern technology in countries such the U.S. and Canada. This has led to a high demand from the entertainment and gaming industries for immersive and visually appealing technologies. Moreover, North America has a high penetration rate of the healthcare sector and advanced medical applications such as medical imaging, surgical planning, and education, enabling 3D visualization of medical data. The demand for improved visualization tools in healthcare contributes to the growth of the volumetric display market in the region. Furthermore, North America has a strong and stable economy, which provides a favorable environment for technological advancements and market growth. The region's economic stability, combined with the presence of a large consumer base, creates a conducive market for volumetric displays. North America hosts several prominent market players in the volumetric display industry. These companies are actively investing in R&D, increasing the adoption of volumetric displays across various sectors. Their strong market presence, along with their extensive distribution networks and customer base, contributes to the growth of the regional market.
Competitive Scenario in the Global Volumetric Display Market
Investment and agreement are common strategies followed by major market players. For instance, in August 2019, Lightspace Technologies Inc. launched new volumetric 3D image display technology named, Gen3. The company used multi-layer liquid crystal switching diffuser screen along with mini/microLED for projecting backplane.

Source: Research Dive Analysis
Some of the leading volumetric display market players are Lumi Industries, Voxon Photonics, Artosci, Holoxica, Looking Glass, Burton Inc., SeeReal Technologies S.A., Sony, REALFICTION, and Alioscopy.
| Aspect | Particulars |
| Historical Market Estimations | 2020-2021 |
| Base Year for Market Estimation | 2022 |
| Forecast Timeline for Market Projection | 2022-2031 |
| Geographical Scope | North America, Europe, Asia-Pacific, and LAMEA |
| Segmentation by Type |
|
| Segmentation by Technology |
|
| Segmentation by Application |
|
| Key Companies Profiled |
|
Q1. What is the size of the global volumetric display market?
A. The size of the global volumetric display market was over $1,389.9 million in 2021 and is projected to reach $14,794.9 million by 2031.
Q2. Which are the major companies in the volumetric display market?
A. Lumi Industries, Voxon Photonics, and Artosci are some of the key players in the global volumetric display market.
Q3. Which region, among others, possesses greater investment opportunities in the future?
A. North America possesses great investment opportunities for investors in the future.
Q4. What will be the growth rate of the North America volumetric display market?
A. North America volumetric display market is anticipated to grow at 27.5% CAGR during the forecast period.
Q5. What are the strategies opted by the leading players in this market?
A. Agreement and investment are the two key strategies opted by the operating companies in this market.
Q6. Which companies are investing more on R&D practices?
A. Holoxica, Looking Glass, and Burton Inc. are the companies investing more on R&D activities for developing new products and technologies.
1.Research Methodology
1.1.Desk Research
1.2.Real time insights and validation
1.3.Forecast model
1.4.Assumptions and forecast parameters
1.5.Market size estimation
1.5.1.Top-down approach
1.5.2.Bottom-up approach
2.Report Scope
2.1.Market definition
2.2.Key objectives of the study
2.3.Report overview
2.4.Market segmentation
2.5.Overview of the impact of COVID-19 on Global volumetric display market
3.Executive Summary
4.Market Overview
4.1.Introduction
4.2.Growth impact forces
4.2.1.Drivers
4.2.2.Restraints
4.2.3.Opportunities
4.3.Market value chain analysis
4.3.1.List of raw material suppliers
4.3.2.List of manufacturers
4.3.3.List of distributors
4.4.Innovation & sustainability matrices
4.4.1.Technology matrix
4.4.2.Regulatory matrix
4.5.Porter’s five forces analysis
4.5.1.Bargaining power of suppliers
4.5.2.Bargaining power of consumers
4.5.3.Threat of substitutes
4.5.4.Threat of new entrants
4.5.5.Competitive rivalry intensity
4.6.PESTLE analysis
4.6.1.Political
4.6.2.Economical
4.6.3.Social
4.6.4.Technological
4.6.5.Environmental
4.7.Impact of COVID-19 on volumetric display market
4.7.1.Pre-covid market scenario
4.7.2.Post-covid market scenario
5.Volumetric Display Market Analysis, by Type
5.1.Overview
5.2.Swept Volumetric Displays
5.2.1.Definition, key trends, growth factors, and opportunities
5.2.2.Market size analysis, by region, 2022-2032
5.2.3.Market share analysis, by country, 2022-2032
5.3.Holographic Displays
5.3.1.Definition, key trends, growth factors, and opportunities
5.3.2.Market size analysis, by region, 2022-2032
5.3.3.Market share analysis, by country, 2022-2032
5.4.Static Volumetric Displays
5.4.1.Definition, key trends, growth factors, and opportunities
5.4.2.Market size analysis, by region, 2022-2032
5.4.3.Market share analysis, by country, 2022-2032
5.5.Research Dive Exclusive Insights
5.5.1.Market attractiveness
5.5.2.Competition heatmap
6.Volumetric Display Market Analysis, by Technology
6.1.Digital Light Processing (DLP)
6.1.1.Definition, key trends, growth factors, and opportunities
6.1.2.Market size analysis, by region, 2022-2032
6.1.3.Market share analysis, by country, 2022-2032
6.2.Liquid Crystal on Silicon (LCOS)
6.2.1.Definition, key trends, growth factors, and opportunities
6.2.2.Market size analysis, by region, 2022-2032
6.2.3.Market share analysis, by country, 2022-2032
6.3.Research Dive Exclusive Insights
6.3.1.Market attractiveness
6.3.2.Competition heatmap
7.Volumetric Display Market Analysis, by Application
7.1.Aerospace & Defense
7.1.1.Definition, key trends, growth factors, and opportunities
7.1.2.Market size analysis, by region, 2022-2032
7.1.3.Market share analysis, by country, 2022-2032
7.2.Medical
7.2.1.Definition, key trends, growth factors, and opportunities
7.2.2.Market size analysis, by region, 2022-2032
7.2.3.Market share analysis, by country, 2022-2032
7.3.Automotive
7.3.1.Definition, key trends, growth factors, and opportunities
7.3.2.Market size analysis, by region, 2021-2031
7.3.3.Market share analysis, by country, 2021-2031
7.4.Communication & Entertainment
7.4.1.Definition, key trends, growth factors, and opportunities
7.4.2.Market size analysis, by region, 2022-2032
7.4.3.Market share analysis, by country, 2022-2032
7.5.Others
7.5.1.Definition, key trends, growth factors, and opportunities
7.5.2.Market size analysis, by region, 2022-2032
7.5.3.Market share analysis, by country, 2022-2032
7.6.Research Dive Exclusive Insights
7.6.1.Market attractiveness
7.6.2.Competition heatmap
8.Volumetric Display Market, by Region
8.1.North America
8.1.1.U.S.
8.1.1.1.Market size analysis, by Type,2022-2032
8.1.1.2.Market size analysis, by Technology,2022-2032
8.1.1.3.Market size analysis, by Application,2022-2032
8.1.2.Canada
8.1.2.1.Market size analysis, by Type,2022-2032
8.1.2.2.Market size analysis, by Technology,2022-2032
8.1.2.3.Market size analysis, by Application,2022-2032
8.1.3.Mexico
8.1.3.1.Market size analysis, by Type,2022-2032
8.1.3.2.Market size analysis, by Technology,2022-2032
8.1.3.3.Market size analysis, by Application,2022-2032
8.1.4.Research Dive Exclusive Insights
8.1.4.1.Market attractiveness
8.1.4.2.Competition heatmap
8.2.Europe
8.2.1.Germany
8.2.1.1.Market size analysis, by Type,2022-2032
8.2.1.2.Market size analysis, by Technology,2022-2032
8.2.1.3.Market size analysis, by Application,2022-2032
8.2.2.UK
8.2.2.1.Market size analysis, by Type,2022-2032
8.2.2.2.Market size analysis, by Technology,2022-2032
8.2.2.3.Market size analysis, by Application,2022-2032
8.2.3.France
8.2.3.1.Market size analysis, by Type,2022-2032
8.2.3.2.Market size analysis, by Technology,2022-2032
8.2.3.3.Market size analysis, by Application,2022-2032
8.2.4.Spain
8.2.4.1.Market size analysis, by Type,2022-2032
8.2.4.2.Market size analysis, by Technology,2022-2032
8.2.4.3.Market size analysis, by Application,2022-2032
8.2.5.Italy
8.2.5.1.Market size analysis, by Type,2022-2032
8.2.5.2.Market size analysis, by Technology,2022-2032
8.2.5.3.Market size analysis, by Application,2022-2032
8.2.6.Rest of Europe
8.2.6.1.Market size analysis, by Type,2022-2032
8.2.6.2.Market size analysis, by Technology,2022-2032
8.2.6.3.Market size analysis, by Application,2022-2032
8.2.7.Research Dive Exclusive Insights
8.2.7.1.Market attractiveness
8.2.7.2.Competition heatmap
8.3.Asia-Pacific
8.3.1.China
8.3.1.1.Market size analysis, by Type,2022-2032
8.3.1.2.Market size analysis, by Technology,2022-2032
8.3.1.3.Market size analysis, by Application,2022-2032
8.3.2.Japan
8.3.2.1.Market size analysis, by Type, 2022-2032
8.3.2.2.Market size analysis, by Technology, 2022-2032
8.3.2.3.Market size analysis, by Application, 2022-2032
8.3.3.India
8.3.3.1.Market size analysis, by Type, 2022-2032
8.3.3.2.Market size analysis, by Technology, 2022-2032
8.3.3.3.Market size analysis, by Application, 2022-2032
8.3.4.Australia
8.3.4.1.Market size analysis, by Type, 2022-2032
8.3.4.2.Market size analysis, by Technology, 2022-2032
8.3.4.3.Market size analysis, by Application, 2022-2032
8.3.5.South Korea
8.3.5.1.Market size analysis, by Type, 2022-2032
8.3.5.2.Market size analysis, by Technology, 2022-2032
8.3.5.3.Market size analysis, by Application, 2022-2032
8.3.6.Rest of Asia-Pacific
8.3.6.1.Market size analysis, by Type, 2022-2032
8.3.6.2.Market size analysis, by Technology, 2022-2032
8.3.6.3.Market size analysis, by Application, 2022-2032
8.3.7.Research Dive Exclusive Insights
8.3.7.1.Market attractiveness
8.3.7.2.Competition heatmap
8.4.LAMEA
8.4.1.Brazil
8.4.1.1.Market size analysis, by Type, 2022-2032
8.4.1.2.Market size analysis, by Technology, 2022-2032
8.4.1.3.Market size analysis, by Application, 2022-2032
8.4.2.Saudi Arabia
8.4.2.1.Market size analysis, by Type, 2022-2032
8.4.2.2.Market size analysis, by Technology, 2022-2032
8.4.2.3.Market size analysis, by Application, 2022-2032
8.4.3.UAE
8.4.3.1.Market size analysis, by Type, 2022-2032
8.4.3.2.Market size analysis, by Technology, 2022-2032
8.4.3.3.Market size analysis, by Application, 2022-2032
8.4.4.South Africa
8.4.4.1.Market size analysis, by Type, 2022-2032
8.4.4.2.Market size analysis, by Technology, 2022-2032
8.4.4.3.Market size analysis, by Application, 2022-2032
8.4.5.Rest of LAMEA
8.4.5.1.Market size analysis, by Type, 2022-2032
8.4.5.2.Market size analysis, by Technology, 2022-2032
8.4.5.3.Market size analysis, by Application, 2022-2032
8.4.6.Research Dive Exclusive Insights
8.4.6.1.Market attractiveness
8.4.6.2.Competition heatmap
9.Competitive Landscape
9.1.Top winning strategies, 2022
9.1.1.By strategy
9.1.2.By year
9.2.Strategic overview
9.3.Market share analysis, 2022
10.Company Profiles
10.1.Lumi Industries
10.1.1.Overview
10.1.2.Business segments
10.1.3.Product portfolio
10.1.4.Financial performance
10.1.5.Recent developments
10.1.6.SWOT analysis
10.2.Voxon Photonics
10.2.1.Overview
10.2.2.Business segments
10.2.3.Product portfolio
10.2.4.Financial performance
10.2.5.Recent developments
10.2.6.SWOT analysis
10.3.Artosci
10.3.1.Overview
10.3.2.Business segments
10.3.3.Product portfolio
10.3.4.Financial performance
10.3.5.Recent developments
10.3.6.SWOT analysis
10.4.Holoxica
10.4.1.Overview
10.4.2.Business segments
10.4.3.Product portfolio
10.4.4.Financial performance
10.4.5.Recent developments
10.4.6.SWOT analysis
10.5.Looking Glass
10.5.1.Overview
10.5.2.Business segments
10.5.3.Product portfolio
10.5.4.Financial performance
10.5.5.Recent developments
10.5.6.SWOT analysis
10.6.Burton Inc.
10.6.1.Overview
10.6.2.Business segments
10.6.3.Product portfolio
10.6.4.Financial performance
10.6.5.Recent developments
10.6.6.SWOT analysis
10.7.SeeReal Technologies S.A.
10.7.1.Overview
10.7.2.Business segments
10.7.3.Product portfolio
10.7.4.Financial performance
10.7.5.Recent developments
10.7.6.SWOT analysis
10.8.Sony
10.8.1.Overview
10.8.2.Business segments
10.8.3.Product portfolio
10.8.4.Financial performance
10.8.5.Recent developments
10.8.6.SWOT analysis
10.9.REALFICTION
10.9.1.Overview
10.9.2.Business segments
10.9.3.Product portfolio
10.9.4.Financial performance
10.9.5.Recent developments
10.9.6.SWOT analysis
10.10.Alioscopy
10.10.1.Overview
10.10.2.Business segments
10.10.3.Product portfolio
10.10.4.Financial performance
10.10.5.Recent developments
10.10.6.SWOT analysis
Personalize this research
- Triangulate with your own data
- Request your format and definition
- Get a deeper dive on a specific application, geography, customer or competitor
- + 1-888-961-4454 Toll - Free
- support@researchdive.com
