Activated Carbon Market Report
RA00176
Activated Carbon Market, by Type (Powdered, Granular, Others), Application (Liquid Phase, Gaseous Phase), End Use Industry (Water Treatment, Food & Beverages, Pharmaceutical & Medical, Automotive, Air Purification, Others), Regional Analysis (North America, Europe, Asia-Pacific, Rest of the World): Global Opportunity Analysis and Industry Forecast, 2019–2026
Update Available On-Demand
The global activated carbon market forecast will surpass $9,486.5 million by the end of 2026, at a 9.5% CAGR, growing from $4,573.1 million in the year 2018. Asia-Pacific region will experience a significant growth and is estimated to generate a revenue of $2,910.1 million till 2026. The global market is dominated by North America region and it accounted for $2,028.6 million in 2018.
Activated Carbon Market Synopsis
The increasing support of governments of many countries to minimize the contaminants in the air and the extensive usage of activated carbon in the mercury control technology are expected to drive the activated carbon market growth.
However, the unavailability and high costs of raw materials is likely to hamper the growth of the market.
According to the regional analysis, the Asia-Pacific market for activated carbon is anticipated to have enormous opportunities for market participants and generate a revenue of $2,910.0 million during the forecast period.
Activated Carbon Market Analysis:
Activated carbon is a type of treated carbon material with low and small volume pores that are used for adsorption processes. These carbon materials have high surface area and are used in various chemical reactions. Activated carbon substances are produced from several sources such as coconut husk, wood, coir, lignite and other materials. Activated carbon plays a significant role in physical adsorption process, which is particularly useful for purification, decaffeination, filtration and other processes.
Rising demand for water decontamination along with sewage water treatment are the major driving aspects for the growth of the global Activated Carbon Market
Increasing demand for water treatment process coupled with the increasing requirement of products and their derivatives for the treatment of waste sludge produced from the manufacturing industries is significantly driving the activated carbon market growth. In addition, growing knowledge about serious health issues associated with consumption of contaminated drinking water is directly increasing the usage of activated carbon materials in the water purification, driving the market growth. Also, most of the developing countries such as China and India are highly investing in improved drinking water treatment processes, because growing population is expected to increase the demand for activated carbon materials. Moreover, growing demand for activated carbon substances for air pollution treatment processes due to increasing awareness and strict environmental standards is boosting the growth of the global activated carbon market. Furthermore, a rise in the government support to minimize the contaminants in the air along with wide usage of activated carbon in the mercury control technology are also further enhancing the market growth.
To know more about Activated Carbon Market drivers, get in touch with our analysts here.
https://www.researchdive.com/connect-to-analyst/176
High cost of raw materials is one of the key restraints for the growth of global Activated Carbon Market
The price volatility of the raw materials due to unavailability through natural resources is a significant restraining factor for the market growth. Also, high price of raw materials is another key factor that is anticipated to hinder the market growth during the projected time frame.
Industrialization along with product launches are delivering major investment opportunities for the Activated Carbon Market
Increasing population along with growing seriousness about health standards are boosting the growth of activated carbon usage in the water and air pollution treatment, generating significant growth opportunities in the activated carbon market. These products are useful as carriers, colorants and catalysts in many of the industrial and chemical processes. In addition, increasing number of new product launches by the manufacturers to meet the requirement from end use industry verticals due to industrialization particularly in developing economies is expected to propel the market growth in the near future.
To know more about Activated Carbon Market opportunities, get in touch with our analysts here.
https://www.researchdive.com/connect-to-analyst/176
Activated Carbon Market, by Type:
Outsourced monitoring type registered for highest market size and is predicted to be most lucrative throughout the forecast time
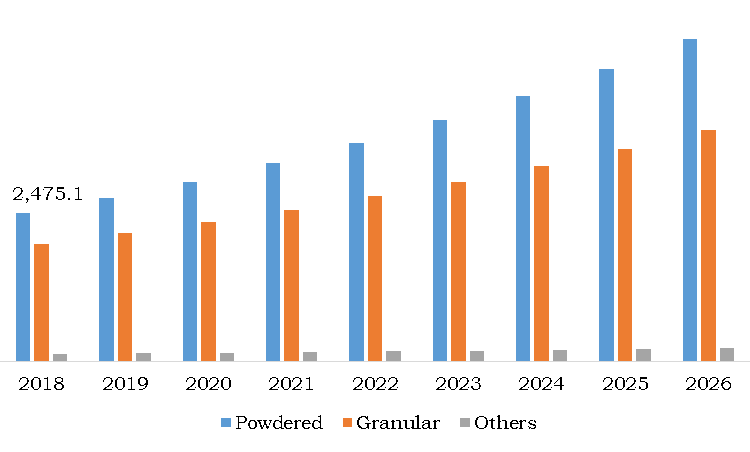
Powdered type held an evident market size in 2018, it is projected to be the fastest growing type in the global activated carbon market and will generate a revenue up to $5,387.6 million by the end of 2026. Increase in the use of powdered type products in the coal plants to eliminate air contaminants and growing usage for deodorization along with decolonization in the chemical processes is estimated to boost the market growth. Granular type occupied second spot in the global market in terms of revenue in 2018 and is expected to generate a revenue of $3,866.9 million in the end of 2026. Granular activated carbons widely used in elimination of organic carbons and in reverse osmosis process are predicted to fuel the market growth in the projected timeframe.
Activated Carbon Market, by Application:
Liquid phase type generated a major market share in 2018
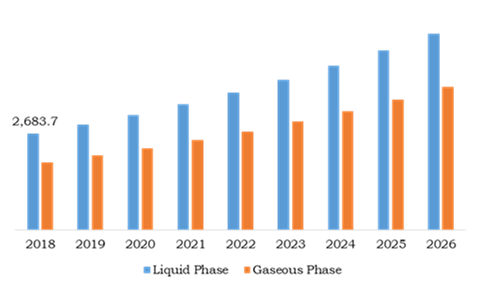
Gaseous phase is the fastest growing segment at a CAGR of 9.8% in the global activated carbon market and is estimated to reach $4,003.5 million till 2026. The growth in the gaseous phase application is accredited to rise in demand for mercury removal process and air purification applications. In addition, in the chemical & pharmaceutical industry, gaseous activated carbons are used in solvent recovery plants, chlorine & hydrogen sulfide removal process and are projected to boost the market size during the forecast period. Liquid phase application held the global market size in 2018; it was valued at $2,683.7 million in 2018 and is anticipated to grow at a notable rate of 9.3% CAGR in the estimated timeframe. The liquid activated carbon is used in removal of odor causing chemicals and removal of heavy metals such as lead, chlorine and other contaminants; this factor is estimated to drive liquid phase market size in the coming years.
Activated Carbon Market, by End Use Industry:
Water treatment end use segment accounted for the largest market size in 2018
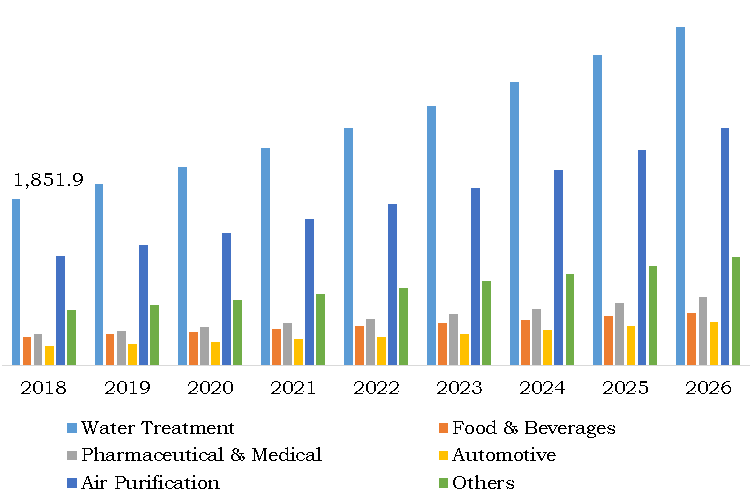
The water treatment end use industry accounted for majority of the activated carbon market share in 2018 and is estimated to retain its growth in the market size throughout the forecast period. Growth in demand for pure drinking water treatment and recyclable water for production processes in the industries is estimated to enhance the water treatment market size in the estimated time. Also, the demand for water treatment is predicted to increase because of insufficiency of water along with growing industrialization in the developing countries; this will boost the opportunity for the growth of the activated carbon market. Automotive end use industry is anticipated to witnessing a significant growth and is expected to produce a revenue of $485.4 million and growing at a rate of 10.9% CAGR. This expected growth in the automotive market is majorly owing to increasing usage of activated carbon materials in the exhaust filters to remove air contaminants. Activated carbon also plays a major role in adsorption of volatile hydrocarbons. This aspect is estimated to enhance the market growth in the coming years.
Regional Insights:
Asia-Pacific region will have massive growth opportunities for the market participants in the coming years
Asia-Pacific region registered for second spot in the global market and is projected to account for $2,910.0 million in 2026. This expected growth is majorly owing to growing demand for activated carbon materials from end use industries including food & beverages, water treatment and pharmaceutical industries. Also, increasing scarcity of water because of existence of high population economies such as China and Asia-Pacific is indirectly affecting the use of activated carbon materials in water treatment process; this factor is estimated to drive the market growth in the coming years.
North America activated carbon market held the majority of the market share in 2018 and is projected to retain its dominance during the forecast period. This dominance is majorly owing to wide usage of activated carbon materials in the several sectors including wastewater treatment and production industries. In addition, increasing implementation of environmental regulations to minimize water pollution along with growing modernization is expected to propel the growth of the market in North America region.
To explore more about activated carbon market, get in touch with our analysts here.
https://www.researchdive.com/connect-to-analyst/176
Key Players in the global Activated Carbon Market:
Product launches and R&D investments are the common strategies followed by the key players
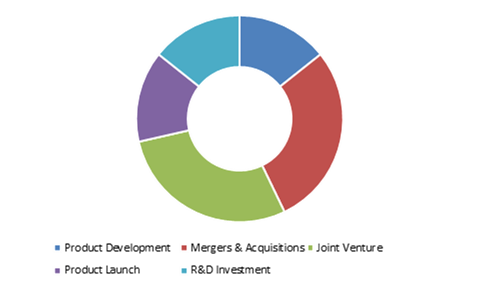
The list of significant activated carbon market players include Oxbow Activated Carbon LLC, Silcarbon Aktivkohle GmbH, Kuraray Co. Ltd, Calgon Carbon Corporation, Jacobi Carbons AB, Osaka Gas Chemical Co. Ltd., Cabot Corporation, Evoqua Water Technologies LLC Carbon Resources LLC, Carbo Tech AC GmbH, Carbon Activated Corp., Siemens Water Technologies Corp. and many others. These established players are concentration on both organic and inorganic growth strategies such as joint ventures, collaborations, product launches and mergers to gain highest market share in the global activated carbon industry.
Porter’s Five Forces Analysis for Activated Carbon Market:
- Bargaining Power of Suppliers: This market has high number of small & medium and large-scale suppliers and growing demand from end use industries are resulting in high demand for activated carbon materials. Therefore, the bargaining control of suppliers is HIGH.
- Bargaining Power of Consumers: The market has high concentration of buyers and substitutes are not available. These aspects and the high raw material costs are providing HIGH bargaining control of consumers.
- Threat of New Entrants: The market has presence of significant players along with strict government regulations on the approval of products, which is delivering MODERATE threat of new entrants.
- Threat of Substitutes: The market contains end users like automotive, pharmaceutical & medical, manufacturing and other industries. Thereby, the threat of alternatives is LOW.
- Competitive Rivalry in the Industry: There is presence of numerous players and high product loyalty in the industry. These players are emphasizing on product developments and new product launches to gain highest market share, resulting in HIGH rivalry among the market players.
| Aspect | Particulars |
| Historical Market Estimations | 2018-2019 |
| Base Year for Market Estimation | 2018 |
| Forecast timeline for Market Projection | 2019-2026 |
| Geographical Scope | North America, Europe, Asia-Pacific, LAMEA |
| Segmentation by Type |
|
| Segmentation by Application
|
|
| Segmentation by End Use |
|
| Key Countries covered | U.S., Canada, Germany, UK, Italy, Spain, Russia, Japan, China, India, South Korea, Australia, Brazil, Argentina, GCC and Saudi Arabia |
| Key Companies Profiled |
|
Source: Research Dive Analysis
Q1. What is the size of activated carbon market?
A. The global activated carbon market size was over $4,573.1 million in 2018 and is further anticipated to reach $9,486.5 million by 2026.
Q2. Who are the leading companies in the activated carbon market?
A. Jacobi Carbons AB, Evoqua Water Technologies LLC, Carbon Resources LLC, Carbon Activated Corp. and Carbo Tech AC GmbH are some of the key players in the global Activated Carbon Market.
Q3. Which region possesses greater investment opportunities in the coming future?
A. Asia-Pacific possesses great investment opportunities for the investors to witness the most promising growth in the coming years.
Q4. What is the North America region market size in 2018?
A. North America Activated Carbon Market accounted for $2,028.6 million in 2018.
Q5. What are the strategies opted by the leading players in this market?
A. Product development and joint ventures are the key strategies opted by the operating companies in this market.
Q6. Which companies are investing more on R&D practices?
A. Oxbow Activated Carbon LLC, Calgon Carbon Corporation, Jacobi Carbons AB and Carbon Activated Corp are investing more on R&D activities for developing new products and technologies.
1.Research Methodology
1.1.Desk Research
1.2.Real time insights and validation
1.3.Forecast model
1.4.Assumptions and forecast parameters
1.4.1.Assumptions
1.4.2.Forecast parameters
1.5.Data sources
1.5.1.Primary
1.5.2.Secondary
2.Executive Summary
2.1.360° summary
2.2.Type trends
2.3.Application trends
2.4.End use industry trends
3.Market overview
3.1.Market segmentation & definitions
3.2.Key takeaways
3.2.1.Top investment pockets
3.2.2.Top winning strategies
3.3.Porter’s five forces analysis
3.3.1.Bargaining power of consumers
3.3.2.Bargaining power of suppliers
3.3.3.Threat of new entrants
3.3.4.Threat of substitutes
3.3.5.Competitive rivalry in the market
3.4.Market dynamics
3.4.1.Drivers
3.4.2.Restraints
3.4.3.Opportunities
3.5.Technology landscape
3.6.Regulatory landscape
3.7.Patent landscape
3.8.Pricing overview
3.8.1.By type
3.8.2.By application
3.8.3.By end use industry
3.8.4.By region
3.9.Market value chain analysis
3.9.1.Stress point analysis
3.9.2.Raw material analysis
3.9.3.Manufacturing process
3.9.4.Distribution channel analysis
3.9.5.Operating vendors
3.9.5.1.Raw material suppliers
3.9.5.2.Product manufacturers
3.9.5.3.Product distributors
3.10.Strategic overview
4.Activated Carbon Market, by Type
4.1.Powdered
4.1.1.Market size and forecast, by region, 2018-2026
4.1.2.Comparative market share analysis, 2018 & 2026
4.2.Granular
4.2.1.Market size and forecast, by region, 2018-2026
4.2.2.Comparative market share analysis, 2018 & 2026
4.3.Others
4.3.1.Market size and forecast, by region, 2018-2026
4.3.2.Comparative market share analysis, 2018 & 2026
5.Activated Carbon Market, by Application
5.1.Liquid phase
5.1.1.Market size and forecast, by region, 2018-2026
5.1.2.Comparative market share analysis, 2018 & 2026
5.2.Gas phase
5.2.1.Market size and forecast, by region, 2018-2026
5.2.2.Comparative market share analysis, 2018 & 2026
6.Activated Carbon Market, by End use industry
6.1.Water Treatment
6.1.1.Market size and forecast, by region, 2018-2026
6.1.2.Comparative market share analysis, 2018 & 2026
6.2.Pharmaceutical & Medical
6.2.1.Market size and forecast, by region, 2018-2026
6.2.2.Comparative market share analysis, 2018 & 2026
6.3.Automotive
6.3.1.Market size and forecast, by region, 2018-2026
6.3.2.Comparative market share analysis, 2018 & 2026
6.4.Food & Beverages
6.4.1.Market size and forecast, by region, 2018-2026
6.4.2.Comparative market share analysis, 2018 & 2026
6.5.Air Purification
6.5.1.Market size and forecast, by region, 2018-2026
6.5.2.Comparative market share analysis, 2018 & 2026
6.6.Others
6.6.1.Market size and forecast, by region, 2018-2026
6.6.2.Comparative market share analysis, 2018 & 2026
7.Activated Carbon Market, by Region
7.1.North America
7.1.1.Market size and forecast, by type, 2018-2026
7.1.2.Market size and forecast, byapplication, 2018-2026
7.1.3.Market size and forecast, by end use industry, 2018-2026
7.1.4.Market size and forecast, by country, 2018-2026
7.1.5.Comparative market share analysis, 2018 & 2026
7.1.6.U.S.
7.1.6.1.Market size and forecast, by type, 2018-2026
7.1.6.2.Market size and forecast, by application, 2018-2026
7.1.6.3.Market size and forecast, by end use industry, 2018-2026
7.1.6.4.Comparative market share analysis, 2018 & 2026
7.1.7.Canada
7.1.7.1.Market size and forecast, by type, 2018-2026
7.1.7.2.Market size and forecast, by application, 2018-2026
7.1.7.3.Market size and forecast, by end use industry, 2018-2026
7.1.7.4.Comparative market share analysis, 2018 & 2026
7.1.8.Mexico
7.1.8.1.Market size and forecast, by type, 2018-2026
7.1.8.2.Market size and forecast, by application, 2018-2026
7.1.8.3.Market size and forecast, by end use industry, 2018-2026
7.1.8.4.Comparative market share analysis, 2018 & 2026
7.2.Europe
7.2.1.Market size and forecast, by type, 2018-2026
7.2.2.Market size and forecast, by application, 2018-2026
7.2.3.Market size and forecast, by end use industry, 2018-2026
7.2.4.Market size and forecast, by country, 2018-2026
7.2.5.Comparative market share analysis, 2018 & 2026
7.2.6.Germany
7.2.6.1.Market size and forecast, by type, 2018-2026
7.2.6.2.Market size and forecast, by application, 2018-2026
7.2.6.3.Market size and forecast, by end use industry, 2018-2026
7.2.6.4.Comparative market share analysis, 2018 & 2026
7.2.7.UK
7.2.7.1.Market size and forecast, by type, 2018-2026
7.2.7.2.Market size and forecast, by application, 2018-2026
7.2.7.3.Market size and forecast, by end use industry, 2018-2026
7.2.7.4.Comparative market share analysis, 2018 & 2026
7.2.8.France
7.2.8.1.Market size and forecast, by type, 2018-2026
7.2.8.2.Market size and forecast, by application, 2018-2026
7.2.8.3.Market size and forecast, by end use industry, 2018-2026
7.2.8.4.Comparative market share analysis, 2018 & 2026
7.2.9.Spain
7.2.9.1.Market size and forecast, by type, 2018-2026
7.2.9.2.Market size and forecast, by application, 2018-2026
7.2.9.3.Market size and forecast, by end use industry, 2018-2026
7.2.9.4.Comparative market share analysis, 2018 & 2026
7.2.10.Italy
7.2.10.1.Market size and forecast, by type, 2018-2026
7.2.10.2.Market size and forecast, by application, 2018-2026
7.2.10.3.Market size and forecast, by end use industry, 2018-2026
7.2.10.4.Comparative market share analysis, 2018 & 2026
7.2.11.Rest of Europe
7.2.11.1.Market size and forecast, by type, 2018-2026
7.2.11.2.Market size and forecast, by application, 2018-2026
7.2.11.3.Market size and forecast, by end use industry, 2018-2026
7.2.11.4.Comparative market share analysis, 2018 & 2026
7.3.Asia Pacific
7.3.1.Market size and forecast, by type, 2018-2026
7.3.2.Market size and forecast, by application, 2018-2026
7.3.3.Market size and forecast, by end use industry, 2018-2026
7.3.4.Market size and forecast, by country, 2018-2026
7.3.5.Comparative market share analysis, 2018 & 2026
7.3.6.China
7.3.6.1.Market size and forecast, by type, 2018-2026
7.3.6.2.Market size and forecast, by application, 2018-2026
7.3.6.3.Market size and forecast, by end use industry, 2018-2026
7.3.6.4.Comparative market share analysis, 2018 & 2026
7.3.7.India
7.3.7.1.Market size and forecast, by type, 2018-2026
7.3.7.2.Market size and forecast, by application, 2018-2026
7.3.7.3.Market size and forecast, by end use industry, 2018-2026
7.3.7.4.Comparative market share analysis, 2018 & 2026
7.3.8.Japan
7.3.8.1.Market size and forecast, by type, 2018-2026
7.3.8.2.Market size and forecast, by application, 2018-2026
7.3.8.3.Market size and forecast, by end use industry, 2018-2026
7.3.8.4.Comparative market share analysis, 2018 & 2026
7.3.9.Australia
7.3.9.1.Market size and forecast, by type, 2018-2026
7.3.9.2.Market size and forecast, by application, 2018-2026
7.3.9.3.Market size and forecast, by end use industry, 2018-2026
7.3.9.4.Comparative market share analysis, 2018 & 2026
7.3.10.Rest of Asia Pacific
7.3.10.1.Market size and forecast, by type, 2018-2026
7.3.10.2.Market size and forecast, by application, 2018-2026
7.3.10.3.Market size and forecast, by end use industry, 2018-2026
7.3.10.4.Comparative market share analysis, 2018 & 2026
7.4.LAMEA
7.4.1.Market size and forecast, by type, 2018-2026
7.4.2.Market size and forecast, by application, 2018-2026
7.4.3.Market size and forecast, by end use industry, 2018-2026
7.4.4.Market size and forecast, by country, 2018-2026
7.4.5.Comparative market share analysis, 2018 & 2026
7.4.6.Latin America
7.4.6.1.Market size and forecast, by type, 2018-2026
7.4.6.2.Market size and forecast, by application, 2018-2026
7.4.6.3.Market size and forecast, by end use industry, 2018-2026
7.4.6.4.Comparative market share analysis, 2018 & 2026
7.4.7.Middle East
7.4.7.1.Market size and forecast, by type, 2018-2026
7.4.7.2.Market size and forecast, by application, 2018-2026
7.4.7.3.Market size and forecast, by end use industry, 2018-2026
7.4.7.4.Comparative market share analysis, 2018 & 2026
7.4.8.Africa
7.4.8.1.Market size and forecast, by type, 2018-2026
7.4.8.2.Market size and forecast, by application, 2018-2026
7.4.8.3.Market size and forecast, by end use industry, 2018-2026
7.4.8.4.Comparative market share analysis, 2018 & 2026
8.Company profiles
8.1.Oxbow Activated Carbon LLC
8.1.1.Business overview
8.1.2.Financial performance
8.1.3.Product portfolio
8.1.4.Recent strategic moves & developments
8.1.5.SWOT analysis
8.2.SilcarbonAktivkohle GmbH
8.2.1.Business overview
8.2.2.Financial performance
8.2.3.Product portfolio
8.2.4.Recent strategic moves & developments
8.2.5.SWOT analysis
8.3.Kuraray Co. Ltd
8.3.1.Business overview
8.3.2.Financial performance
8.3.3.Product portfolio
8.3.4.Recent strategic moves & developments
8.3.5.SWOT analysis
8.4.Calgon Carbon Corporation
8.4.1.Business overview
8.4.2.Financial performance
8.4.3.Product portfolio
8.4.4.Recent strategic moves & developments
8.4.5.SWOT analysis
8.5.Jacobi Carbons AB
8.5.1.Business overview
8.5.2.Financial performance
8.5.3.Product portfolio
8.5.4.Recent strategic moves & developments
8.5.5.SWOT analysis
8.6.Osaka Gas Chemical Co. Ltd.
8.6.1.Business overview
8.6.2.Financial performance
8.6.3.Product portfolio
8.6.4.Recent strategic moves & developments
8.6.5.SWOT analysis
8.7.Cabot Corporation
8.7.1.Business overview
8.7.2.Financial performance
8.7.3.Product portfolio
8.7.4.Recent strategic moves & developments
8.7.5.SWOT analysis
8.8.Evoqua Water Technologies LLC.
8.8.1.Business overview
8.8.2.Financial performance
8.8.3.Product portfolio
8.8.4.Recent strategic moves & developments
8.8.5.SWOT analysis
8.9.Carbon Resources LLC
8.9.1.Business overview
8.9.2.Financial performance
8.9.3.Product portfolio
8.9.4.Recent strategic moves & developments
8.9.5.SWOT analysis
8.10.Carbon Activated Corp.
8.10.1.Business overview
8.10.2.Financial performance
8.10.3.Product portfolio
8.10.4.Recent strategic moves & developments
8.10.5.SWOT analysis
8.11.Carbo Tech AC GmbH
8.11.1.Business overview
8.11.2.Financial performance
8.11.3.Product portfolio
8.11.4.Recent strategic moves & developments
8.11.5.SWOT analysis
8.12.Siemens Water Technologies Corp.
8.12.1.Business overview
8.12.2.Financial performance
8.12.3.Product portfolio
8.12.4.Recent strategic moves & developments
8.12.5.SWOT analysis
Activated carbon or also called as an activated charcoal is a type of treated carbon material with small and low volume pores that are used in the adsorption processes. These carbon materials have high surface area and are used for diverse chemical reactions in order to upturn the reaction between molecules. Activated carbon substances are produced from several sources such as wood, coconut husk, lignite, coir, and other materials.
As per Research Dive blog , a high carbon content organic material is processed in manufacturing of activated carbon. The key property of activated carbon is physical adsorption, which can be useed for decaffeination, purification,filters, metal finishing, and removal of fuel storage and pollutants.Gaseous and liquid phase of activated carbon improves its uses in removal of dissolved radon, lead, mercury, and other odor-causing compounds. This offered benefits of activated carbon is likely to drive the global activated carbon market growth in the coming years.
Recent Developments in the Activated Carbon Industry
The governments of various developed & developing economies, and non-profit organizations are increasing implementation of environmental regulations to minimize water pollution. Also, as the technology is advancing and the top gaining players of the global activated carbon industry are coming up with new strategies and products to strengthen the position of the market.
For instance, in November 2016, the filter aid business and the activated carbon of CECA was acquired by the Calgon Carbon Corporation. The CECA is a subsidiary of France-based Arkema Group.
In April 2018, the Boston-based performance materials and specialty chemicals company, Cabot Corporation was appointed as a new supplier for granular activated carbon by the New York state department of environmental conservation. This granular activated carbon was selected for the role of removing perfluorooctanoic acid contamination.
In August 2018, Ingevity, a specialty chemicals leader of The South Carolina, developed a new product namely “AquaNuchar.” This is a wood-based activated carbon, which was used by the North Carolina water authority to treat municipal water.
In June 2019, Jacobi Carbons and Air 2 Public GmbH has entered into an agreement forthe supply activated carbon in order to efficiently remove NOx from the street air.
In October 2019, Cabot Corporation launched the “ATHLOS™”, which is the latest addition to the specialty materials family of the company.The product is a carbon nanostructures (CNS) and has an excellent electromagnetic interference balance. The ATHLOS can even equip end-users to sustainably manage and use new-age applications and plastic products.
Market Scenario of Activated Carbon Industry
Global activated carbon market is estimated to experience a progressive growth during the forecast period. Increasing number of novel product launches by leading manufacturers is playing a crucial role in creating massive opportunities in the global market. Increasing trend towards health standards is also predicted to drive the market growth from 2019 to 2026. However, price volatility of raw materials is restricting the growth of activated carbon market.
Rising demand for water treatment process along with the growing requirement of products and their derivative for the treatment of waste sludge are significant factors giving substantial uplift to the growth of activated carbon market in the coming years. As per the Research Dive report statistics, the industrial activated carbon market is expected to reach up to $9,486.5 million by the end of 2026. Geographically, the North America region is likely to dominate the industry as activated carbon is extensively used in various sectors such as production industries and waste water treatment in this region. In addition, the report profiles key players functioning in the global market who are concentrating more on new product launches and geographical expansion to maintain a strong position in the global industry.
Personalize this research
- Triangulate with your own data
- Request your format and definition
- Get a deeper dive on a specific application, geography, customer or competitor
- + 1-888-961-4454 Toll - Free
- support@researchdive.com
