Ozone Generation Market Report
RA00402
Ozone Generation Market, by Technology (Corona Discharge, Cold Plasma, Electrolysis and Ultraviolet), Application (Industrial, Potable water treatment, Municipal, Air Treatment and Others), Regional Outlook (North America, Europe, Asia-Pacific, and LAMEA): Global Opportunity Analysis and Industry Forecast, 2018–2026
Update Available On-Demand
Ozone generation market accounted for $1,053.0 million in 2018 and is predicted to generate a revenue of $1,624.7 million by 2026 with a CAGR of 5.2% in the estimated period. Asia-Pacific region market accounted for $413.8 million in 2018 and is predicted to grow with a CAGR of 7.3% in the estimated period. Rise in the demand for water is predicted to drive the market in the estimated period.
Ozone Generation Market Synopsis
The rise in demand for clean drinking water owing to the steep rise in the population, along with the rapid urbanization around the world are expected to boost the growth of the ozone generation market.
On the other hand, the high costs associated with the ozone generators is the growth-restricting factor for the market.
According to the regional analysis, the Asia-Pacific market for ozone generation valued for $413.8 million in 2018 and is expected to witness lucrative growth by growing at a CAGR of 7.3% during the review period.
Ozone Generation Market Analysis
Ozone helps in the treatment of industrial & pharmaceutical wastes and bleaching pulp & paper industry. Industrial and pharmaceutical discharges containing small quantities of organic compounds, industrial solvents, pharmacological compounds, or endocrine disrupting compounds (EDC) are rendered by ozone treatment, resulting in long-term environmental and benefits.
COVID-19 Impact Analysis on the Ozone Generation Market
The pandemic is predicted to have a negative impact on the global ozone generation market. Ozone generators are used in food and beverage processing and chemical industries for purification purposes. As in chemical industry the ozone generators are used for dis infection and oxidation processes. The lockdown due the COVID-19 pandemic has forced businesses to shut down indefinitely. Once the unlock process starts, the market is expected to increase dramatically in terms of revenue.
Rise in need for clean drinking water is predicted to be the major driving factor for the global market
Ozone is considered to be the one of the best oxidants. It is the most powerful disinfectant which is majorly used for water treatment in various industries. Increasing demand for clean water in various regions for drinking purposes is predicted to be the major driving factor for the global market in the estimated period. In addition, there has been a steep rise in the population across the globe due to which the demand for the clean drinking water has also increased, which is predicted to be the one of the major driving factors for the market in the estimated period. Moreover, rapid urbanization across the globe is predicted to drive the global ozone generation market in the forecast period.
High cost is predicted to be the biggest restraint for the ozone generation market
The installation cost of ozone generators is predicted to be very high which may hinder the market growth in the estimated period. Due to the high cost factor most of the places cannot afford the ozone generators. The operational cost of various ozone generators is also on a higher end, which is predicted to be the biggest restraint for the global market in the estimated period.
Ozone Generation Market, By Technology
Corona discharge sub-segment is predicted to be the most lucrative
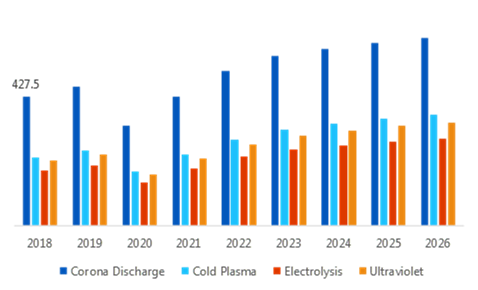
Source: Research Dive Analysis
Corona discharge sub-segment is predicted to have the maximum market share in the forecast period. Corona discharge sub-segment accounted for $427.5 million in 2018 and is predicted to grow with a CAGR of 5.9% in the estimated period. Corona discharge ozone generators create higher quantities of ozone more effectively in a cost effective manner as compared to others such as UV-ozone generation. This factor is predicted to drive the corona discharge sub-segment in the estimated period.
Ozone Generation Market, By Application:
Municipal application is predicted to have the highest market share
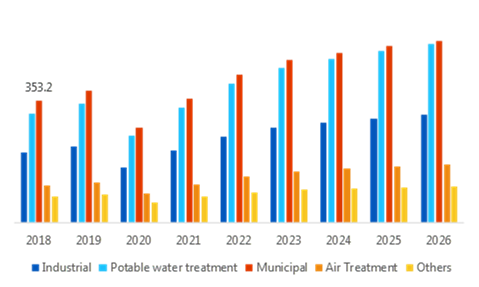
Source: Research Dive Analysis
Municipal application sub-segment is predicted to grow enormously in terms of revenue in the estimated period. Municipal application sub-segment accounted for $353.2 million in 2018 and is predicted to grow with a CAGR of 6.1% in the estimated period. Increasing product demand due to its high oxidizing power and the ability to oxidize heavy material is predicted to drive the municipal application sub-segment in the forecast period.
Ozone Generation Market, By Region:
Asia Pacific region market is predicted to create more growth opportunity for the global market in the forecast period
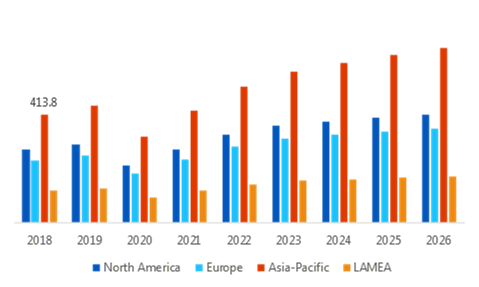
Source: Research Dive Analysis
Asia-Pacific region market is predicted to have highest market share in the estimated period. Asia-Pacific region market accounted for $413.8 million in 2018 and is predicted to grow with a CAGR of 7.3% in the estimated period. Rise in the shortage of water among population along with an increase in urbanization and industrialization is predicted to boost the region market in the estimated period. Moreover, government taking precautionary action to prevent environment pollution is predicted to drive the regional market in the estimated period. For instance, in March 2017, Singapore government toughened the regulation to meet the environment goals with the help of technology in energy efficiency.
Key Participants in the Ozone Generation Market:

Source: Research Dive Analysis
Some of the significant ozone generation market players include Absolute Systems., Chemtronics Co. Ltd, Custom Molded Products LLC, Dayton Water Systems, EBARA Technologies Inc., ESCO International, International Ozone, Mitsubishi Electric Corp., Toshiba Infrastructure Systems & Solutions Corporation and Suez among others.
Porter’s Five Forces Analysis for Ozone Generation Market:
- Bargaining Power of Suppliers: The switching cost from one supplier to another is projected to be high.
The bargaining power of suppliers is very High.
- Bargaining Power of Consumers: In this market, the concentration of buyers is low.
The bargaining power of consumers is low.
- The threat of New Entrants: Huge initial investments are essential to start a new manufacturing unit of ozone generators.
The threat of new entrants is high.
- The threat of Substitutes: This market has less number of products; moreover, availability of products is also very less due to which switching costs for clients is low.
The threat of substitutes is low.
- Competitive Rivalry in the Market: Ozone generators have numerous small, medium and large, scale players. Many major players are following several strategies, and product differentiation among them. The competitive rivalry in the industry is High.
| Aspect | Particulars |
| Historical Market Estimations | 2018-2019 |
| Base Year for Market Estimation | 2018 |
| Forecast timeline for Market Projection | 2018-2026 |
| Geographical Scope | North America, Europe, Asia-Pacific, LAMEA |
| Segmentation by Technology |
|
| Segmentation by Application |
|
| Key Countries Covered | U.S., Canada, Mexico, Germany, France, UK, Italy, Spain, Russia, Rest of Europe, China, Japan, India, Australia, South Korea, Rest of Asia-Pacific, Latin America, Middle East, Africa |
| Key Companies Profiled |
|
Q1. What is the size of ozone generation market?
A. The global ozone generation market size was over $1,053.0 million in 2018, and is predicted to grow with a CAGR of 5.2% over the forecast period.
Q2. Which are the leading companies in the Cheese Sauces Market?
A. Mitsubishi Electric Corp. and Toshiba Infrastructure Systems & Solutions Corporation are some of the key players in the global ozone generation market.
Q3. Which region possesses greater investment opportunities in the coming future?
A. Asia-Pacific possesses great investment opportunities for the investors to witness the most promising growth in the coming years.
Q4. What is the growth rate of Asia-Pacific?
A. Asia-Pacific ozone generation market is projected to grow at 7.3% CAGR during the forecast period.
Q5. What are the strategies opted by the leading players in this market?
A. Product development is the key strategies opted by the operating companies in this ozone generation market.
Q6. Which companies are investing more on R&D practices?
A. The Toshiba Infrastructure Systems & Solutions Corporation is the company investing more on R&D activities for developing new products and technologies.
1. Research Methodology
1.1. Desk Research
1.2. Real time insights and validation
1.3. Forecast model
1.4. Assumptions and forecast parameters
1.4.1. Assumptions
1.4.2. Forecast parameters
1.5. Data sources
1.5.1. Primary
1.5.2. Secondary
2. Executive Summary
2.1. 360° summary
2.2. Technology trends
2.3. Application trends
3. Market Overview
3.1. Market segmentation & definitions
3.2. Key takeaways
3.2.1. Top investment pockets
3.2.2. Top winning strategies
3.3. Porter’s five forces analysis
3.3.1. Bargaining power of consumers
3.3.2. Bargaining power of suppliers
3.3.3. Threat of new entrants
3.3.4. Threat of substitutes
3.3.5. Competitive rivalry in the market
3.4. Market dynamics
3.4.1. Drivers
3.4.2. Restraints
3.4.3. Opportunities
3.5. Technology landscape
3.6. Regulatory landscape
3.7. Patent landscape
3.8. Pricing overview
3.8.1. By Technology
3.8.2. By Application
3.8.3. By region
3.9. Market value chain analysis
3.9.1. Stress point analysis
3.9.2. Raw material analysis
3.9.3. Manufacturing process
3.9.4. Distribution channel analysis
3.9.5. Operating vendors
3.9.5.1. Raw material suppliers
3.9.5.2. Product manufacturers
3.9.5.3. Product distributors
3.10. Strategic overview
4. Disaster Recovery as Ozone Generation Market, by Technology
4.1. Corona Discharge
4.1.1. Market size and forecast, by region, 2019-2026
4.1.2. Comparative market share analysis, 2019-2026
4.2. Cold Plasma
4.2.1. Market size and forecast, by region, 2019-2026
4.2.2. Comparative market share analysis, 2019-2026
4.3. Electrolysis
4.3.1. Market size and forecast, by region, 2019-2026
4.3.2. Comparative market share analysis, 2019-2026
4.4. Ultraviolet
4.4.1. Market size and forecast, by region, 2019-2026
4.4.2. Comparative market share analysis, 2019-2026
5. Disaster Recovery as Ozone Generation Market, by Application
5.1. Industrial
5.1.1. Market size and forecast, by region, 2019-2026
5.1.2. Comparative market share analysis, 2019-2026
5.2. Potable water treatment
5.2.1. Market size and forecast, by region, 2019-2026
5.2.2. Comparative market share analysis, 2019-2026
5.3. Municipal
5.3.1. Market size and forecast, by region, 2019-2026
5.3.2. Comparative market share analysis, 2019-2026
5.4. Air Treatment
5.4.1. Market size and forecast, by region, 2019-2026
5.4.2. Comparative market share analysis, 2019-2026
5.5. Others
5.5.1. Market size and forecast, by region, 2019-2026
5.5.2. Comparative market share analysis, 2019-2026
6. Disaster Recovery as Ozone Generation Market, by Region
6.1. North Region
6.1.1. Market size and forecast, by Technology, 2019-2026
6.1.2. Market size and forecast, by Application, 2019-2026
6.1.3. Market size and forecast, by country, 2019-2026
6.1.4. Comparative market share analysis, 2019-2026
6.1.5. U.S
6.1.6. Market size and forecast, by Technology, 2019-2026
6.1.7. Market size and forecast, by Application, 2019-2026
6.1.8. Market size and forecast, by vertical, 2019-2026
6.1.9. Canada
6.1.10. Market size and forecast, by Technology, 2019-2026
6.1.11. Market size and forecast, by Application, 2019-2026
6.1.12.
6.2. Europe
6.2.1. Market size and forecast, by Technology, 2019-2026
6.2.2. Market size and forecast, by Application, 2019-2026
Market size and forecast, by country, 2019-2026
6.2.3. Comparative market share analysis, 2019-2026
6.2.4. UK
6.2.4.1. Market size and forecast, by Technology, 2019-2026
6.2.4.2. Market size and forecast, by Application, 2019-2026
6.2.4.3. Comparative market share analysis, 2019-2026
6.2.5. Germany
6.2.5.1. Market size and forecast, by Technology, 2019-2026
6.2.5.2. Market size and forecast, by Application, 2019-2026
6.2.5.3. Comparative market share analysis, 2019-2026
6.2.6. France
6.2.6.1. Market size and forecast, by Technology, 2019-2026
6.2.6.2. Market size and forecast, by Application, 2019-2026
6.2.6.3. Comparative market share analysis, 2019-2026
6.2.7. Italy
6.2.7.1. Market size and forecast, by Technology, 2019-2026
6.2.7.2. Market size and forecast, by Application, 2019-2026
6.2.7.3. Comparative market share analysis, 2019-2026
6.2.8. Rest of Europe
6.2.8.1. Market size and forecast, by Technology, 2019-2026
6.2.8.2. Market size and forecast, by Application, 2019-2026
6.2.8.3. Comparative market share analysis, 2019-2026
6.3. Asia-Pacific
6.3.1. Market size and forecast, by Technology, 2019-2026
6.3.2. Market size and forecast, by Application, 2019-202
6.3.3. Market size and forecast, by country, 2019-2026
6.3.4. Comparative market share analysis, 2019-2026
6.3.5. China
6.3.6. Market size and forecast, by Technology, 2019-2026
6.3.7. Market size and forecast, by Application, 2019-2026
6.3.8. Comparative market share analysis, 2019-2026
6.3.9. India
6.3.9.1. Market size and forecast, by Technology, 2019-2026
6.3.9.2. Market size and forecast, by Application, 2019-2026
6.3.9.3. Comparative market share analysis, 2019-2026
6.3.10. Japan
6.3.10.1. Market size and forecast, by Technology, 2019-2026
6.3.10.2. Market size and forecast, by Application, 2019-2026
6.3.10.3. Comparative market share analysis, 2019-2026
6.3.11. South Korea
6.3.11.1. Market size and forecast, by Technology, 2019-2026
6.3.11.2. Market size and forecast, by Application, 2019-202
6.3.11.3. Market size and forecast, by vertical, 2019-2026
6.3.11.4. Comparative market share analysis, 2019-2026
6.3.12. Australia
6.3.12.1. Market size and forecast, by Technology, 2019-2026
6.3.12.2. Market size and forecast, by Application, 2019-2026
6.3.12.3. Comparative market share analysis, 2019-2026
6.3.13. Rest of Asia Pacific
6.3.13.1.
6.3.13.2. Market size and forecast, by Technology, 2019-2026
6.3.13.3. Market size and forecast, by Application, 2019-2026
6.3.13.4. Comparative market share analysis, 2019-2026
6.4. LAMEA
6.4.1. Market size and forecast, by Technology, 2019-2026
6.4.2. Market size and forecast, by Application, 2019-2026
6.4.3. Market size and forecast, by country, 2019-2026
6.4.4. Comparative market share analysis, 2019-2026
6.4.5. Latin America
6.4.5.1. Market size and forecast, by Technology, 2019-2026
6.4.5.2. Market size and forecast, by Application, 2019-2026
6.4.5.3. Comparative market share analysis, 2019-2026
6.4.6. Middle East
6.4.6.1. Market size and forecast, by Technology, 2019-2026
6.4.6.2. Market size and forecast, by Application, 2019-2026
6.4.6.3. Comparative market share analysis, 2019-2026
6.4.7. Africa
6.4.7.1. Market size and forecast, by Technology, 2019-2026
6.4.7.2. Market size and forecast, by Application, 2019-2026
6.4.7.3. Comparative market share analysis, 2019-2026
7. Company Profiles
7.1. Absolute Systems Inc.
7.1.1. Business overview
7.1.2. Financial performance
7.1.3. Product portfolio
7.1.4. Recent strategic moves & developments
7.1.5. SWOT analysis
7.2. Chemtronics Co. Ltd
7.2.1. Business overview
7.2.2. Financial performance
7.2.3. Product portfolio
7.2.4. Recent strategic moves & developments
7.2.5. SWOT analysis
7.3. Custom Molded Products LLC
7.3.1. Business overview
7.3.2. Financial performance
7.3.3. Product portfolio
7.3.4. Recent strategic moves & developments
7.3.5. SWOT analysis
7.4. Dayton Water Systems
7.4.1. Business overview
7.4.2. Financial performance
7.4.3. Product portfolio
7.4.4. Recent strategic moves & developments
7.4.5. SWOT analysis
7.5. Ebara Technologies Inc.,
7.5.1. Business overview
7.5.2. Financial performance
7.5.3. Product portfolio
7.5.4. Recent strategic moves & developments
7.5.5. SWOT analysis
7.6. ESCO International
7.6.1. Business overview
7.6.2. Financial performance
7.6.3. Product portfolio
7.6.4. Recent strategic moves & developments
7.6.5. SWOT analysis
7.7. International Ozone
7.7.1. Business overview
7.7.2. Financial performance
7.7.3. Product portfolio
7.7.4. Recent strategic moves & developments
7.7.5. SWOT analysis
7.8. Mitsubishi Electric Corp
7.8.1. Business overview
7.8.2. Financial performance
7.8.3. Product portfolio
7.8.4. Recent strategic moves & developments
7.8.5. SWOT analysis
7.9. Toshiba Infrastructure Systems & Solutions Corporation
7.9.1. Business overview
7.9.2. Financial performance
7.9.3. Product portfolio
7.9.4. Recent strategic moves & developments
7.9.5. SWOT analysis
7.10. Suez
7.10.1. Business overview
7.10.2. Financial performance
7.10.3. Product portfolio
7.10.4. Recent strategic moves & developments
7.10.5. SWOT analysis
Ozone is a naturally occurring gas that is made up of three oxygen atoms. It is a reactive toxic and highly unstable gas, which combines with other gases in the air and when found in the stratosphere is known as stratospheric ozone. I addition, ozone protects living things from the harmful ultraviolet (UV) rays of the sun. Ozone helps in the treatment of pharmaceutical and industrial wastes and lighten pulp & paper. Pharmaceutical and industrial discharges containing small quantities of organic compounds, pharmacological compounds, and industrial solvents are rendered by ozone treatment, which results in long-term environmental benefits.
Ozone generation is majorly used for air purification and water treatment. Ozone generators are also used for size effluent and bio-waste treatment. The use of ozone for bio-waste treatment decreases the consumption of chemical & energy treatment which helps in reducing the overall cost related with bio-waste treatment.
COVID-19 Impact and Key Developments in the Global Market
The COVID-19 pandemic has negatively impacted the global ozone generation market owing to the shutting down of various industries to prevent the spread of the deadly coronavirus. However, the prominent players of the market are adopting several strategies such as novel generator launches and others to sustain in the pandemic crisis.
For instance, in July 2020, Airthereal announced the launch of a brand-new, mini & portable ozone generator namely ‘PA50-GO’ for traveling and for small spaces to support homeowners and businesses in the indoor disinfection and cleaning process. The portable ozone generator is available in blue and yellow, is a cordless, battery-powered equipment that is optimal for cars, staying and traveling in unfamiliar spaces, mainly because people should begin to mobilize more during the pandemic.
Moreover, the major market players are increasingly focusing on technological advancements and adopting numerous growth strategies such as mergers & acquisitions, partnerships, partnerships, and novel product launches to obtain a robust position in the overall market, which is subsequently supporting the ozone generation market to grow at a rapid pace.
For instance, in September 2017, Aqua-Aerobic Systems, Inc. and Pinnacle Ozone Solutions, LLC entered into a strategic partnership that confirms Aqua-Aerobic as the exclusive municipal distributor for Pinnacle Ozone’s ozone generation systems. The developed products will be marketed under the brand name of Aqua ElectrOzone M-Series, with models accessible to produce ozone outputs with ranges from 6.8 Kg/Day to 245 Kg/Day.
In August 2020, Faraday Ozone, launched ‘Ozodip,’ which is a patented ozone-based food detoxifier. It is a kitchen ozone generation product that uses ozone to remove all types of viruses, bacteria, and other microorganisms from the surface of vegetables, fruits, meat, fish, and other food products such as cereals. According to the company, Ozodip also effectively eliminates high concentrations of residual chemicals and pesticides
Forecast Analysis of Ozone Generation Market
Global ozone generation market is anticipated to witness a significant growth over the period of forecast owing to the increasing population and rapid urbanization all over the world. The continuous developments in ozone generation technologies across the globe is expected to create lucrative growth opportunities in the global market. Conversely, the high installation costs of ozone generators is predicted to hamper the market growth during the forecast period.
The growing need for clean drinking water along with the growing usage of ozone technologies are the significant factors expected to foster the growth of the global ozone generation market by 2026. Research Dive in its newly published report anticipates that the ozone generation market will generate a revenue of S$1,624.7 million during the forecast period. The Asia Pacific region is likely to hold a significant share in the global market in the estimated timeframe primarily due to the rise in industrialization & urbanization and the increase in the shortage of water in the region. The prominent players operating in the global industry include Chemtronics Co. Ltd, Absolute Systems, Custom Molded Products LLC, EBARA Technologies Inc., Dayton Water Systems, ESCO International, Mitsubishi Electric Corp., International Ozone, Suez, and Toshiba Infrastructure Systems & Solutions Corporation.
Personalize this research
- Triangulate with your own data
- Request your format and definition
- Get a deeper dive on a specific application, geography, customer or competitor
- + 1-888-961-4454 Toll - Free
- support@researchdive.com
