Global Particle Counters Market Report
RA01301
Global Particle Counters Market by Type (Airborne Particle Counters, Liquid Particle Counters, and Others), Modularity (Benchtop, Portable, and Handheld), Technology (Online Particle Counters and Offline Particle Counters), Application (Cleanroom Monitoring, Drinking Water Contamination Monitoring, Aerosol Monitoring & Research, Indoor Air Quality Monitoring, Contamination Monitoring of Liquids, Chemical Contamination Monitoring, and Others), Industry Vertical (Life Sciences and Medical Device Industry, Semiconductor Industry, Automotive Industry, Aerospace Industry, Food and, Beverage Industry, and Others), and Region (North America, Europe, Asia-Pacific, and LAMEA): Global Opportunity Analysis and Industry Forecast 2022–2031
Global Particle Counters Market Analysis
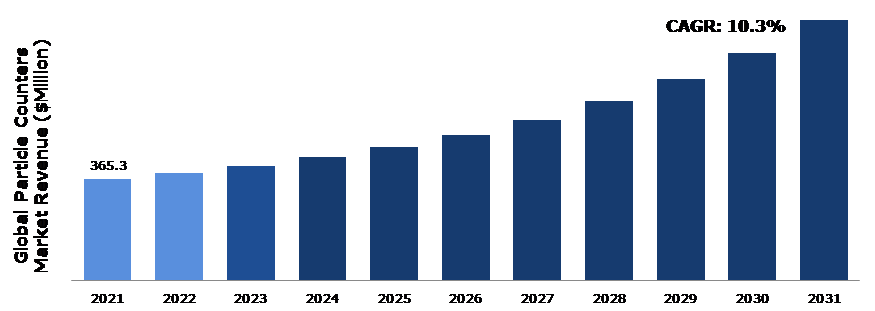
The Global Particle Counters Market Size was $365.3 million in 2021 and is predicted to grow with a CAGR of 10.3%, by generating a revenue of $936.8 million by 2031.
Global Particle Counters Market Synopsis
Particle counters are used to measure the amount of dust present in the environment by detecting particles. It is a very helpful piece of equipment for determining the level of indoor dust, especially in rooms and workplaces. A surge in demand for particle counters from the clean room facilities is anticipated to drive the particle counter market growth. Cleanrooms are useful across various industries including semiconductor, pharmaceutical, biotechnology, and other industries where a contamination-free environment and adherence to compliance are crucial for research and development activities. Cleanrooms are essential as they aid in the protection of products from contamination. A particle counter is a very important tool that is employed in cleanrooms to observe as well as investigate the source of contaminants in cleanroom facilities.
The growth of the particle counters market share is anticipated to be constrained during the analysis period due to errors that may occur with porous particles, when particles smaller than the minimum detectable size go undetected.
The surge in demand for particle counters from the food and beverage industry is anticipated to offer excellent business opportunities to particle counters market players. Food and beverage research and development activities require controlled cleanrooms where airflow rates, pressurization, air particle concentration, and humidity are closely monitored. The particle counter helps in effectively monitoring particles in the air and offers precise data to maintain quality standards of food and beverage.
Particle Counters Overview
Particle counters are used to monitor and diagnose contamination within clean media, such as air, water, and chemicals. Particle counters are utilized in a wide range of applications such as in the oil and gas industry, pharmaceuticals, medical devices, and industrial technologies to support clean production methods.
COVID-19 Impact on Global Particle Counters Market
The COVID-19 pandemic had a moderate impact on the global particle counter market revenue growth. The pandemic has accelerated drug development and research, thus, surging demand for particle counters in pharmaceutical businesses and clinical laboratories. While the demand for particle counters from other industries such as automotive, aerospace, food & beverage, and semiconductors slowed on account of strict lockdowns, social distancing as well as supply chain disruptions, demand remained robust from the pharmaceutical sector. The demand for particle counters surges in drug development, pharma-biopharma manufacturing, and medical device manufacturing. There has been a growing focus by governments across the globe to control and understand the source of air pollution. For instance, various initiatives have been taken by the Indian government to support particle counters projects. In July 2020, the Indian government launched an initiative for particle counters production. Beckman Coulter Life Sciences announced the MET ONE 3400+ portable air particle counters to help simplify cleanroom monitoring for food drug administration (FDA) and good manufacturing practices (GMP) standards.
Increasing Government Policies to Boost Global Particle Counters Market
In recent times, the use of particle counters has increased significantly in various industries such as pharmaceutical and semiconductor industries. Particle counters help to determine air quality due to air pollution. Air pollution has increased the risk of a variety of illnesses, including respiratory difficulties, bronchitis, and cancer. As a result, several regional governments are emphasizing on better monitoring and control of air pollution and its sources. The implementation and approval of rules for effective air pollution monitoring and control, as well as the increased government interest in this field, are likely to increase demand for particle counters over the research period. The expanding industrial sector in emerging economies would create a new influx of opportunities, propelling the particle counters market size over the forecast period.
To know more about global particle counters market drivers, get in touch with our analysts here.
Lack of Standardization may Hamper the Particle Counter Market Growth
The lack of standardization of particle counters and challenges in complying with industry standards is anticipated to hamper the particle counter market growth. Particle counters cannot effectively identify certain particles such as giardia cysts or clay. There are possibilities of delivering inaccurate information with no sign to the operator when this situation arises. Particle sizing errors occur when the particles passing through the particle counter are either smaller or larger than the specification of the particle counter.
Life Sciences & Medical Device Industry is expected to Create Lucrative Opportunities for the Particle counters Market
Increasing funding, investments, R&D, and manufacturing activity in life sciences and medical devices sector along with the requirement for contamination control in pharmaceutical working areas is expected to offer ample particle counters market growth opportunities. The medical industry's increased requirement for particle counters to detect toxins in compounds is pushing the market. Most pharmaceutical products are highly required to be free of contamination and there are limitations on the number of subvisible particles allowed. It is also required by various authorities that contamination is fully investigated on a timely basis. Particle counters aid in successfully determining particulate contamination for regulatory compliance.
To know more about global particle counters market opportunity, get in touch with our analysts here.
Global Particle Counters Market, by Type
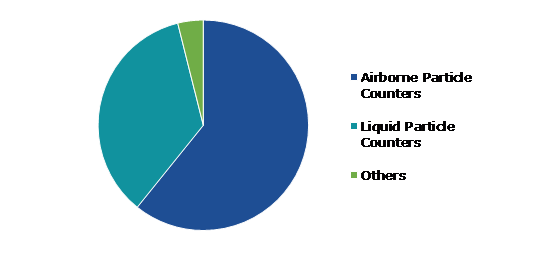
Based on type, the market has been divided into airborne particle counters, liquid particle counters, and others. Among these, airborne particle counters sub-segment accounted for the highest market share in 2021 whereas the liquid particle counters sub-segment is estimated to show the fastest growth during the forecast period.
Global Particle Counters Market Size, by Type, 2021
Source: Research Dive Analysis
The airborne particle counters sub-segment witnessed highest market share in 2021. The airborne particle counters with individually programmable locations and test protocols, save several hours of important time and are excellent for daily cleanroom particle monitoring routines.
Airborne particle counters utilize the air sampling technique to analyze if a cleanroom facility is satisfying the mandated particle concentration limits within its ISO 14644-1:2015 class parameters. Airborne particle counters are important in observing, categorizing, and analyzing the complexity and source of contaminants in cleanroom facilities.
The liquid particle counters sub-segment is expected to show a fastest growth during the forecast period. Liquid particle counters are used in the pharmaceutical, chemical, oil and gas, energy and utility, and manufacturing industries to identify and measure contaminants in process fluids. Liquid particle counters are widely employed in the pharmaceutical business, and are also utilized in oil and gas, food and beverage, chemicals, water & wastewater management, and energy & utility applications around the world. Increased investment in the development of innovative medicine formulations, as well as a favorable regulatory framework, are projected to boost the growth of liquid particle counters in the future years.
Global Particle Counters Market, by Modularity
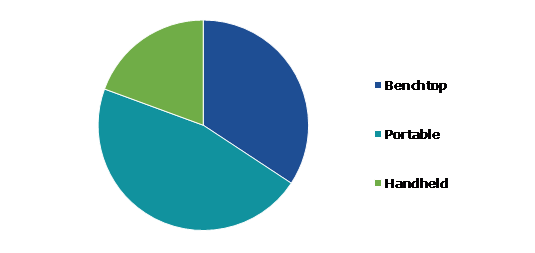
Based on modularity, the market has been divided into benchtop, portable, and handheld. Among these, the portable sub-segment accounted for highest revenue share in 2021.
Global Particle counters Market Forecast, by Modularity, 2021
Source: Research Dive Analysis
The portable sub-segment held the largest particle counter market share in 2021. A portable particle counter is a high-tech monitoring equipment that calculates the total volume of contaminants in particulate matter. The counter aids in the detection of contaminants in liquids, surfaces, or air. Portable particle counters are easy to transport and handle, and thus manufacturers are focusing on producing portable particle counters for users. Portable particle counters are in high demand in the aerospace, automotive, pharmaceutical, oil and gas, and food and beverage industries. These factors are anticipated to boost the growth of portable sub-segment during the analysis timeframe.
Global Particle Counters Market, by Technology
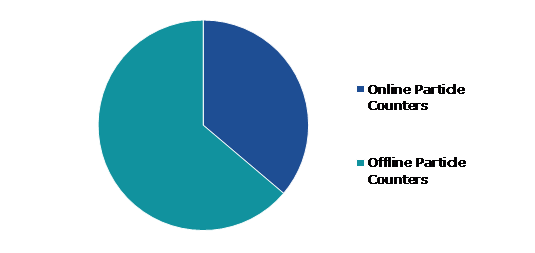
Based on technology, the market has been divided into online particle counter and offline particle counters. Among these, the offline particle counters sub-segment accounted for highest revenue share in 2021.
Global Particle Counters Market Share, by Technology, 2021
Source: Research Dive Analysis
The offline particle counters sub-segment accounted for the highest market share in 2021. Offline particle counters use a well-controlled sampling procedure that does not contaminate the liquid and prevents itself from producing false positive results, which is essential for successful spot sampling. Offline particle counters monitor data collected from the time chemicals are received to the point of processing. This may involve the use of grab samples and monitoring for particle contamination offline to understand chemical quality.
Global Particle Counters Market, by Application
Based on application, the market has been divided into cleanroom monitoring, drinking water contamination monitoring, aerosol monitoring & research, indoor air quality monitoring, contamination monitoring of liquids, chemical contamination monitoring, and others. Among these, the cleanroom monitoring sub-segment accounted for highest revenue share in 2021.
Global Particle Counters Market Growth, by Application, 2021
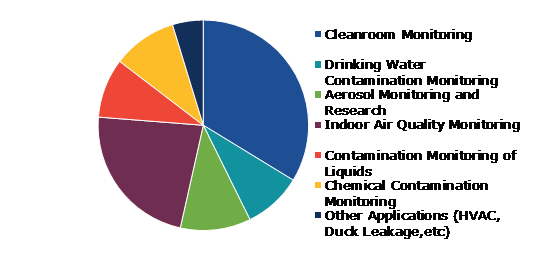
Source: Research Dive Analysis
The cleanroom monitoring sub-segment accounted the highest market share in 2021. Particle counters are utilized for cleanroom personnel to maintain room cleanliness and effectively detect potential particle contamination sources. Particle counters keep cleanrooms safe and clean while reducing downtime and maintaining compliance. Due to the ability to maintain a sterile and contamination-free environment, cleanrooms and monitored working areas are increasingly being employed to manufacture healthcare items.
Global Particle Counters Market, by Industry Vertical
Based on industry vertical, the market has been divided into life sciences & medical device industry, semiconductor industry, automotive industry, aerospace industry, food & beverage industry, and others. Among these, the life sciences & medical device industry sub-segment accounted for highest revenue share in 2021.
Global Particle Counters Market Analysis, by Industry Vertical, 2021
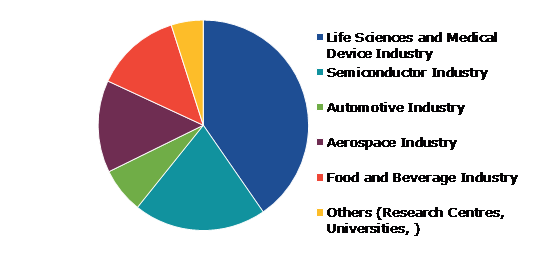
Source: Research Dive Analysis
The life sciences & medical device industry sub-segment accounted for highest market share in 2021. Pharmaceutical manufacturing, biotech manufacturing, medical devices, nutraceuticals, and food processing are some examples of life sciences applications. These are industries that generate items to increase the quality of life of people. Manufacturing environments of these life sciences applications strictly require eliminating or limiting contaminants to avoid the possibility of finished product contamination, which can result in chemical reactions inside the product and poor product quality. Due to these factors, the demand for particle counters in the life sciences & medical device industry is anticipated to accelerate during the forecast period.
Global Particle Counters Market, Regional Insights
The particle counters market was investigated across North America, Europe, Asia-Pacific, and LAMEA.
Global Particle Counters Market Size & Forecast, by Region, 2021-2031 (USD Million)
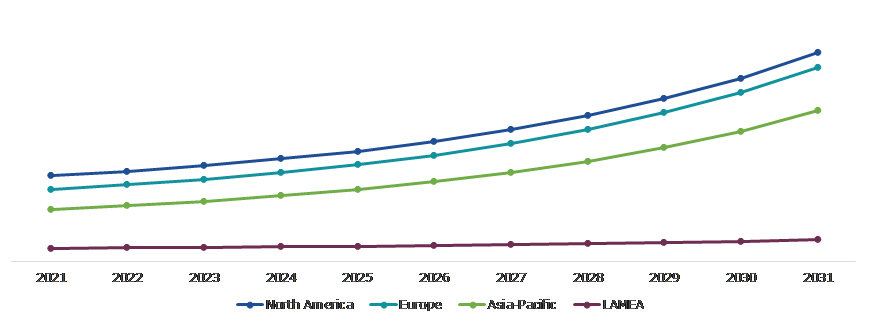
Source: Research Dive Analysis
The Market for Particle Counters in North America to be the Most Dominant
The North America particle counters market accounted highest market share in 2021. The surge in research and development (R&D) investments in the life sciences and medical devices field along with growth in product approvals is anticipated to augment the demand for particle counters in the North America region. The United States dominates the North American market due to the presence of a wide number of medical research facilities.
Competitive Scenario in the Global Particle Counters Market
Product launches and mergers & acquisitions are common strategies followed by major market players. For instance, in November 2022, Particle Measuring Systems introduced a NanoAirTM 10, a 10 nm aerosol particle counter. This product is compact and offers excellent precision. NanoAirTM 10 enables the detection of yield-impacting particles in various applications such as cleanroom areas and pressurized high-purity gas.
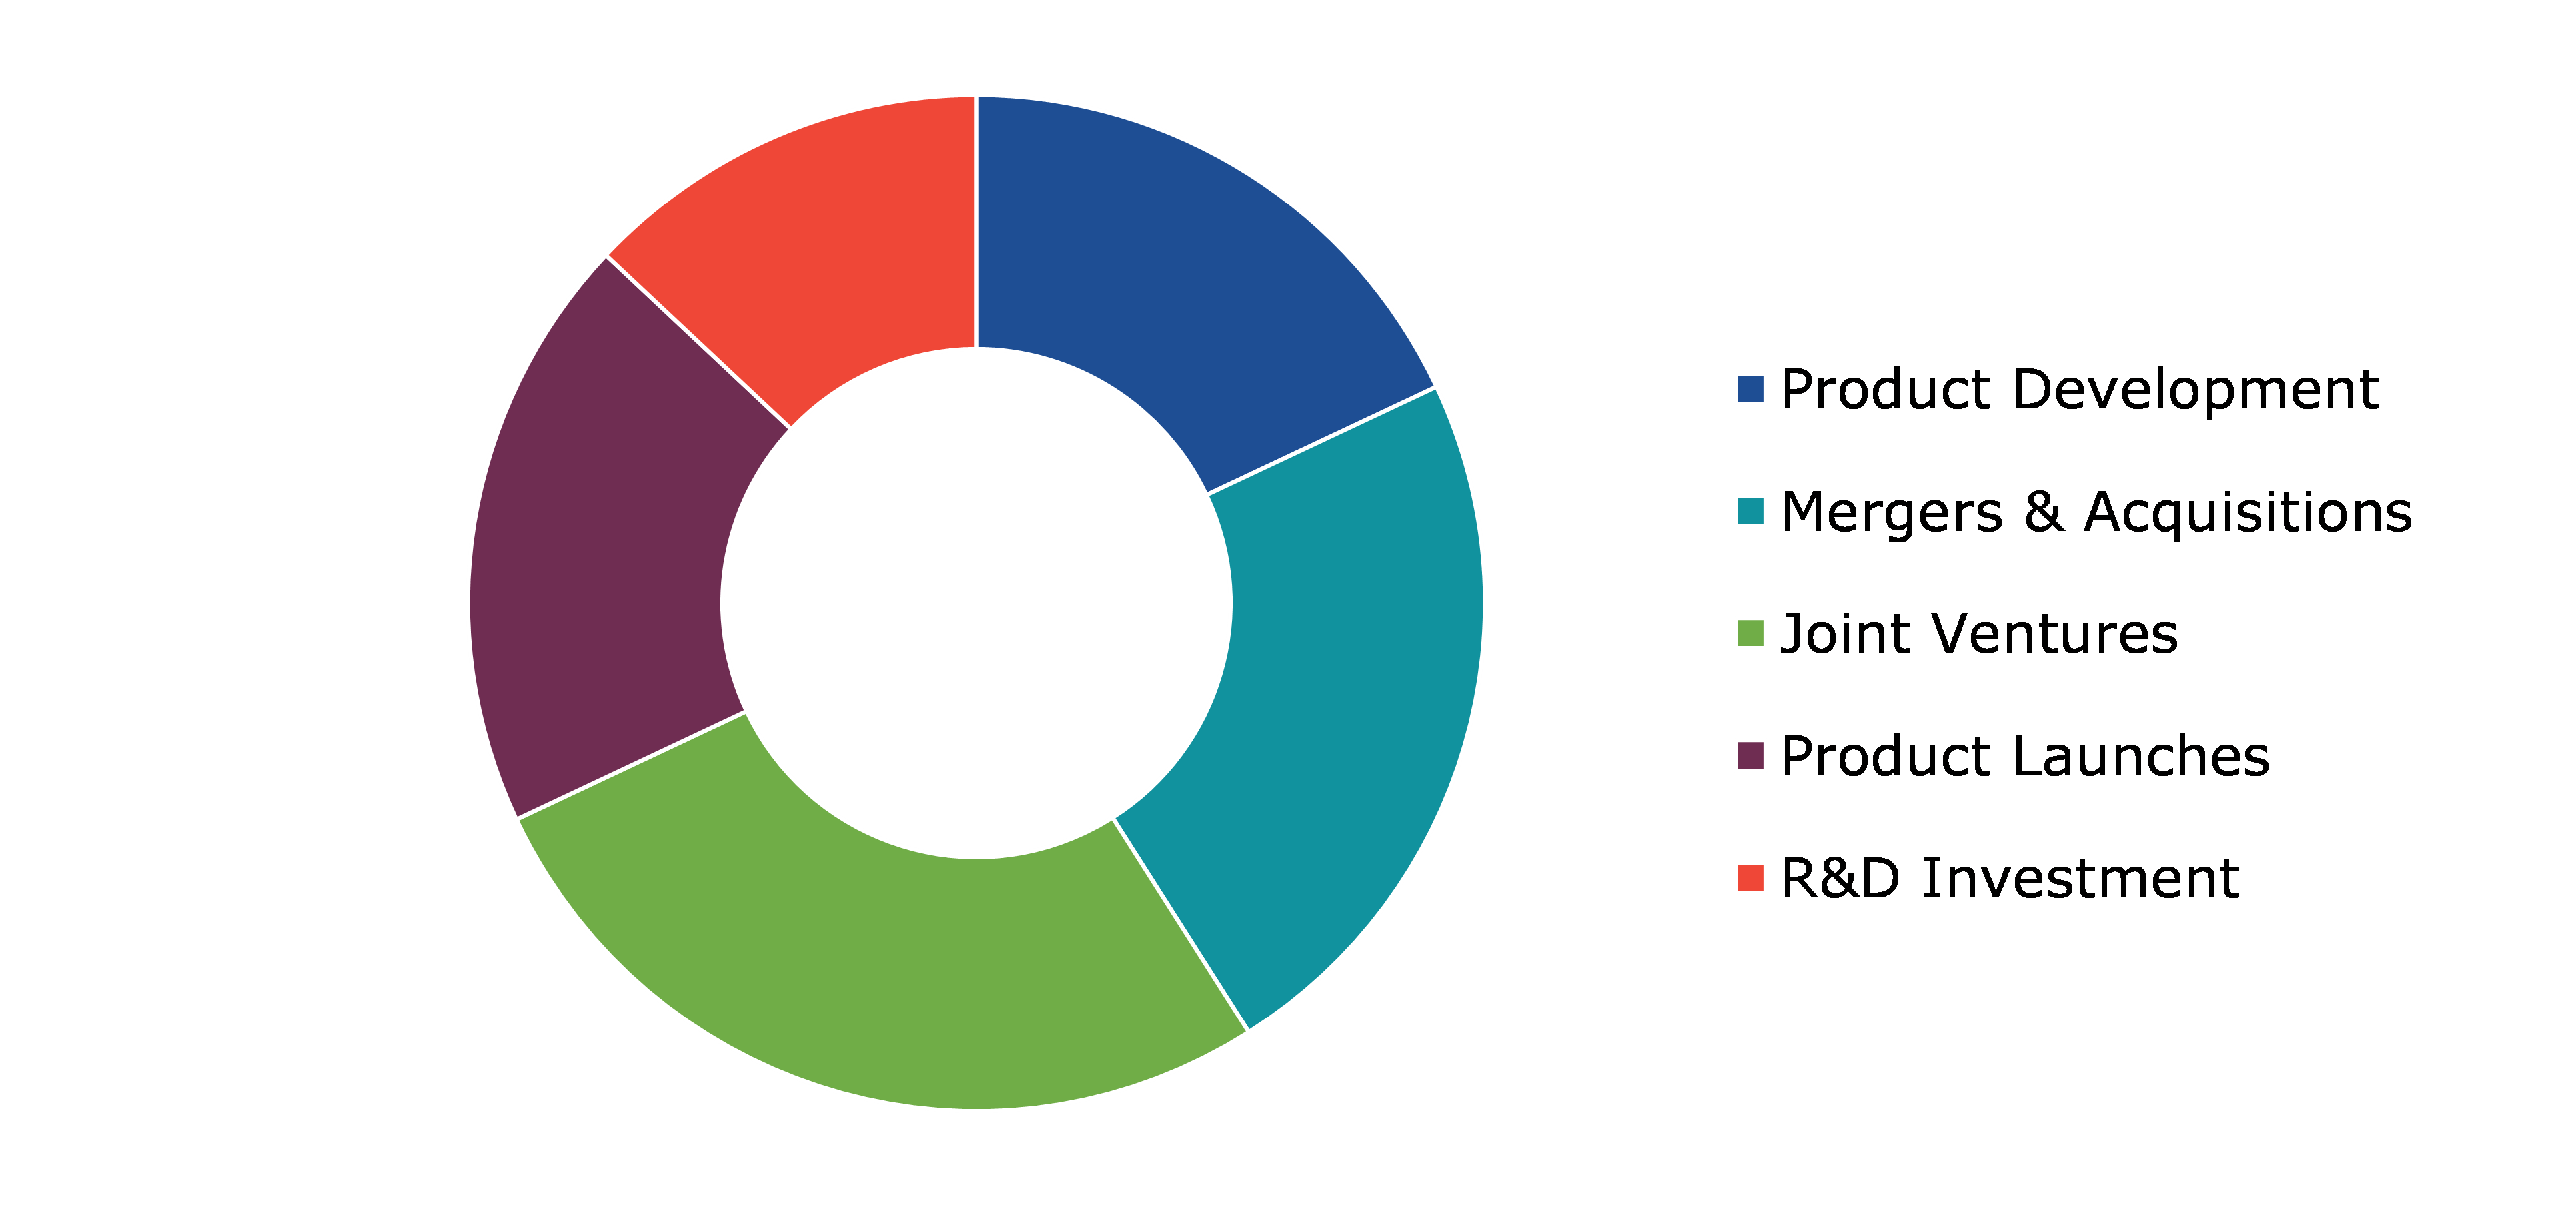
Source: Research Dive Analysis
Some of the leading particle counters market players are Beckman Coulter, Particle Measuring Systems, RION Co. Ltd., Lighthouse Worldwide Solutions, TSI, Climet Instruments Company, Met One Instruments, Particle Plus, PAMAS, and Chemtrac.
| Aspect | Particulars |
| Historical Market Estimations | 2020-2021 |
| Base Year for Market Estimation | 2021 |
| Forecast Timeline for Market Projection | 2022-2031 |
| Geographical Scope | North America, Europe, Asia-Pacific, and LAMEA |
| Segmentation by Type |
|
| Segmentation by Modularity |
|
| Segmentation by Technology |
|
| Segmentation by Application |
|
| Segmentation by Industry Vertical |
|
| Key Companies Profiled |
|
Q1. What is the size of the global particle counters market?
A. The size of the global particle counters market was over $365.3 million in 2021 and is projected to reach $936.8 million by 2031.
Q2. Which are the major companies in the particle counters market?
A. Beckman Coulter, Particle Measuring Systems, and RION Co. Ltd. are some of the key players in the global particle counters market.
Q3. Which region, among others, possesses greater investment opportunities in the near future?
A. The Asia-Pacific region possesses great investment opportunities for investors to witness the most promising growth in the future.
Q4. What will be the growth rate of the Asia-Pacific particle counters market?
A. Asia-Pacific particle counters market is anticipated to grow at 11.6% CAGR during the forecast period.
Q5. What are the strategies opted by the leading players in this market?
A. Product launches and mergers & acquisitions are the two key strategies opted by the operating companies in this market.
Q6. Which companies are investing more on R&D practices?
A. Met One Instruments, Particle Plus, and TSI are the companies investing more on R&D activities for developing new products and technologies.
1.Research Methodology
1.1.Desk Research
1.2.Real time insights and validation
1.3.Forecast model
1.4.Assumptions and forecast parameters
1.5.Market size estimation
1.5.1.Top-down approach
1.5.2.Bottom-up approach
2.Report Scope
2.1.Market definition
2.2.Key objectives of the study
2.3.Report overview
2.4.Market segmentation
2.5.Overview of the impact of COVID-19 on Global particle counters market
3.Executive Summary
4.Market Overview
4.1.Introduction
4.2.Growth impact forces
4.2.1.Drivers
4.2.2.Restraints
4.2.3.Opportunities
4.3.Market value chain analysis
4.3.1.List of raw material suppliers
4.3.2.List of manufacturers
4.3.3.List of distributors
4.4.Innovation & sustainability matrices
4.4.1.Modularity matrix
4.4.2.Regulatory matrix
4.5.Porter’s five forces analysis
4.5.1.Bargaining power of suppliers
4.5.2.Bargaining power of consumers
4.5.3.Threat of substitutes
4.5.4.Threat of new entrants
4.5.5.Competitive rivalry intensity
4.6.PESTLE analysis
4.6.1.Political
4.6.2.Economical
4.6.3.Social
4.6.4.Technological
4.6.5.Environmental
4.7.Impact of COVID-19 on particle counters market
4.7.1.Pre-covid market scenario
4.7.2.Post-covid market scenario
5.Particle Counters Market Analysis, by Type
5.1.Overview
5.2.Airborne Particle Counters
5.2.1.Definition, key trends, growth factors, and opportunities
5.2.2.Market size analysis, by region, 2022-2031
5.2.3.Market share analysis, by country, 2022-2031
5.3.Liquid Particle Counters
5.3.1.Definition, key trends, growth factors, and opportunities
5.3.2.Market size analysis, by region, 2022-2031
5.3.3.Market share analysis, by country, 2022-2031
5.4.Others
5.4.1.Definition, key trends, growth factors, and opportunities
5.4.2.Market size analysis, by region, 2022-2031
5.4.3.Market share analysis, by country, 2022-2031
5.5.Research Dive Exclusive Insights
5.5.1.Market attractiveness
5.5.2.Competition heatmap
6.Particle Counters Market Analysis, by Modularity
6.1.Overview
6.2.Benchtop
6.2.1.Definition, key trends, growth factors, and opportunities
6.2.2.Market size analysis, by region, 2022-2031
6.2.3.Market share analysis, by country, 2022-2031
6.3.Portable
6.3.1.Definition, key trends, growth factors, and opportunities
6.3.2.Market size analysis, by region, 2022-2031
6.3.3.Market share analysis, by country, 2022-2031
6.4.Handheld
6.4.1.Definition, key trends, growth factors, and opportunities
6.4.2.Market size analysis, by region, 2022-2031
6.4.3.Market share analysis, by country, 2022-2031
6.5.Research Dive Exclusive Insights
6.5.1.Market attractiveness
6.5.2.Competition heatmap
7. Particle Counters Market Analysis, by Technology
7.1.Overview
7.2.Online Particle Counters
7.2.1.Definition, key trends, growth factors, and opportunities
7.2.2.Market size analysis, by region, 2022-2031
7.2.3.Market share analysis, by country, 2022-2031
7.3.Offline Particle Counters
7.3.1.Definition, key trends, growth factors, and opportunities
7.3.2.Market size analysis, by region, 2022-2031
7.3.3.Market share analysis, by country, 2022-2031
7.4.Research Dive Exclusive Insights
7.4.1.Market attractiveness
7.4.2.Competition heatmap
8.Particle Counters Market Analysis, by Application
8.1.Overview
8.2.Cleanroom Monitoring
8.2.1.Definition, key trends, growth factors, and opportunities
8.2.2.Market size analysis, by region, 2022-2031
8.2.3.Market share analysis, by country, 2022-2031
8.3.Drinking Water Contamination Monitoring
8.3.1.Definition, key trends, growth factors, and opportunities
8.3.2.Market size analysis, by region, 2022-2031
8.3.3.Market share analysis, by country, 2022-2031
8.4.Aerosol Monitoring and Research
8.4.1.Definition, key trends, growth factors, and opportunities
8.4.2.Market size analysis, by region, 2022-2031
8.4.3.Market share analysis, by country, 2022-2031
8.5.Indoor Air Quality Monitoring
8.5.1.Definition, key trends, growth factors, and opportunities
8.5.2.Market size analysis, by region, 2022-2031
8.6.Contamination Monitoring of Liquids
8.6.1.Definition, key trends, growth factors, and opportunities
8.6.2.Market size analysis, by region, 2022-2031
8.6.3.Market share analysis, by country, 2022-2031
8.7.Chemical Contamination Monitoring
8.7.1.Definition, key trends, growth factors, and opportunities
8.7.2.Market size analysis, by region, 2022-2031
8.7.3.Market share analysis, by country, 2022-2031
8.8.Other Applications
8.8.1.Definition, key trends, growth factors, and opportunities
8.8.2.Market size analysis, by region, 2022-2031
8.8.3.Market share analysis, by country, 2022-2031
8.9.Research Dive Exclusive Insights
8.9.1.Market attractiveness
8.9.2.Competition heatmap
9.Particle Counters Market Analysis, by Industry Vertical
9.1.Overview
9.2.Life Sciences and Medical Device Industry
9.2.1.Definition, key trends, growth factors, and opportunities
9.2.2.Market size analysis, by region, 2022-2031
9.2.3.Market share analysis, by country, 2022-2031
9.3.Semiconductor Industry
9.3.1.Definition, key trends, growth factors, and opportunities
9.3.2.Market size analysis, by region, 2022-2031
9.3.3.Market share analysis, by country, 2022-2031
9.4.Automotive Industry
9.4.1.Definition, key trends, growth factors, and opportunities
9.4.2.Market size analysis, by region, 2022-2031
9.4.3.Market share analysis, by country, 2022-2031
9.5.Aerospace Industry
9.5.1.Definition, key trends, growth factors, and opportunities
9.5.2.Market size analysis, by region, 2022-2031
9.6.Food and Beverage Industry
9.6.1.Definition, key trends, growth factors, and opportunities
9.6.2.Market size analysis, by region, 2022-2031
9.6.3.Market share analysis, by country, 2022-2031
9.7.Others
9.7.1.Definition, key trends, growth factors, and opportunities
9.7.2.Market size analysis, by region, 2022-2031
9.7.3.Market share analysis, by country, 2022-2031
9.8.Research Dive Exclusive Insights
9.8.1.Market attractiveness
9.8.2.Competition heatmap
10.Particle Counters Market, by Region
10.1.North America
10.1.1.U.S.
10.1.1.1.Market size analysis, by Type , 2022-2031
10.1.1.2.Market size analysis, by Modularity, 2022-2031
10.1.1.3.Market size analysis, by Technology, 2022-2031
10.1.1.4.Market size analysis, by Application, 2022-2031
10.1.1.5.Market size analysis, by Industry Vertical, 2022-2031
10.1.2.Canada
10.1.2.1.Market size analysis, by Type , 2022-2031
10.1.2.2.Market size analysis, by Modularity, 2022-2031
10.1.2.3.Market size analysis, by Technology, 2022-2031
10.1.2.4.Market size analysis, by Application, 2022-2031
10.1.2.5.Market size analysis, by Industry Vertical, 2022-2031
10.1.3.Mexico
10.1.3.1.Market size analysis, by Type , 2022-2031
10.1.3.2.Market size analysis, by Modularity, 2022-2031
10.1.3.3.Market size analysis, by Technology, 2022-2031
10.1.3.4.Market size analysis, by Application, 2022-2031
10.1.3.5.Market size analysis, by Industry Vertical, 2022-2031
10.1.4.Research Dive Exclusive Insights
10.1.4.1.Market attractiveness
10.1.4.2.Competition heatmap
10.2.Europe
10.2.1.Germany
10.2.1.1.Market size analysis, by Type , 2022-2031
10.2.1.2.Market size analysis, by Modularity, 2022-2031
10.2.1.3.Market size analysis, by Technology, 2022-2031
10.2.1.4.Market size analysis, by Application, 2022-2031
10.2.1.5.Market size analysis, by Industry Vertical, 2022-2031
10.2.2.UK
10.2.2.1.Market size analysis, by Type , 2022-2031
10.2.2.2.Market size analysis, by Modularity, 2022-2031
10.2.2.3.Market size analysis, by Technology, 2022-2031
10.2.2.4.Market size analysis, by Application, 2022-2031
10.2.2.5.Market size analysis, by Industry Vertical, 2022-2031
10.2.3.France
10.2.3.1.Market size analysis, by Type , 2022-2031
10.2.3.2.Market size analysis, by Modularity, 2022-2031
10.2.3.3.Market size analysis, by Technology, 2022-2031
10.2.3.4.Market size analysis, by Application, 2022-2031
10.2.3.5.Market size analysis, by Industry Vertical, 2022-2031
10.2.4.Spain
10.2.4.1.Market size analysis, by Type , 2022-2031
10.2.4.2.Market size analysis, by Modularity, 2022-2031
10.2.4.3.Market size analysis, by Technology, 2022-2031
10.2.4.4.Market size analysis, by Application, 2022-2031
10.2.4.5.Market size analysis, by Industry Vertical, 2022-2031
10.2.5.Italy
10.2.5.1.Market size analysis, by Type , 2022-2031
10.2.5.2.Market size analysis, by Modularity, 2022-2031
10.2.5.3.Market size analysis, by Technology, 2022-2031
10.2.5.4.Market size analysis, by Application, 2022-2031
10.2.5.5.Market size analysis, by Industry Vertical, 2022-2031
10.2.6.Rest of Europe
10.2.6.1.Market size analysis, by Type , 2022-2031
10.2.6.2.Market size analysis, by Modularity, 2022-2031
10.2.6.3.Market size analysis, by Technology, 2022-2031
10.2.6.4.Market size analysis, by Application, 2022-2031
10.2.6.5.Market size analysis, by Industry Vertical, 2022-2031
10.2.7.Research Dive Exclusive Insights
10.2.7.1.Market attractiveness
10.2.7.2.Competition heatmap
10.3.Asia-Pacific
10.3.1.China
10.3.1.1.Market size analysis, by Type , 2022-2031
10.3.1.2.Market size analysis, by Modularity, 2022-2031
10.3.1.3.Market size analysis, by Technology, 2022-2031
10.3.1.4.Market size analysis, by Application, 2022-2031
10.3.1.5.Market size analysis, by Industry Vertical, 2022-2031
10.3.2.Japan
10.3.2.1.Market size analysis, by Type , 2022-2031
10.3.2.2.Market size analysis, by Modularity, 2022-2031
10.3.2.3.Market size analysis, by Technology, 2022-2031
10.3.2.4.Market size analysis, by Application, 2022-2031
10.3.2.5.Market size analysis, by Industry Vertical, 2022-2031
10.3.3.India
10.3.3.1.Market size analysis, by Type , 2022-2031
10.3.3.2.Market size analysis, by Modularity, 2022-2031
10.3.3.3.Market size analysis, by Technology, 2022-2031
10.3.3.4.Market size analysis, by Application, 2022-2031
10.3.3.5.Market size analysis, by Industry Vertical, 2022-2031
10.3.4.Australia
10.3.4.1.Market size analysis, by Type , 2022-2031
10.3.4.2.Market size analysis, by Modularity, 2022-2031
10.3.4.3.Market size analysis, by Technology, 2022-2031
10.3.4.4.Market size analysis, by Application, 2022-2031
10.3.4.5.Market size analysis, by Industry Vertical, 2022-2031
10.3.5.South Korea
10.3.5.1.Market size analysis, by Type , 2022-2031
10.3.5.2.Market size analysis, by Modularity, 2022-2031
10.3.5.3.Market size analysis, by Technology, 2022-2031
10.3.5.4.Market size analysis, by Application, 2022-2031
10.3.5.5.Market size analysis, by Industry Vertical, 2022-2031
10.3.6.Rest of Asia-Pacific
10.3.6.1.Market size analysis, by Type , 2022-2031
10.3.6.2.Market size analysis, by Modularity, 2022-2031
10.3.6.3.Market size analysis, by Technology, 2022-2031
10.3.6.4.Market size analysis, by Application, 2022-2031
10.3.6.5.Market size analysis, by Industry Vertical, 2022-2031
10.3.7.Research Dive Exclusive Insights
10.3.7.1.Market attractiveness
10.3.7.2.Competition heatmap
10.4.LAMEA
10.4.1.Brazil
10.4.1.1.Market size analysis, by Type , 2022-2031
10.4.1.2.Market size analysis, by Modularity, 2022-2031
10.4.1.3.Market size analysis, by Technology, 2022-2031
10.4.1.4.Market size analysis, by Application, 2022-2031
10.4.1.5.Market size analysis, by Industry Vertical, 2022-2031
10.4.2.Saudi Arabia
10.4.2.1.Market size analysis, by Type , 2022-2031
10.4.2.2.Market size analysis, by Modularity, 2022-2031
10.4.2.3.Market size analysis, by Technology, 2022-2031
10.4.2.4.Market size analysis, by Application, 2022-2031
10.4.2.5.Market size analysis, by Industry Vertical, 2022-2031
10.4.3.UAE
10.4.3.1.Market size analysis, by Type , 2022-2031
10.4.3.2.Market size analysis, by Modularity, 2022-2031
10.4.3.3.Market size analysis, by Technology, 2022-2031
10.4.3.4.Market size analysis, by Application, 2022-2031
10.4.3.5.Market size analysis, by Industry Vertical, 2022-2031
10.4.4.South Africa
10.4.4.1.Market size analysis, by Type , 2022-2031
10.4.4.2.Market size analysis, by Modularity, 2022-2031
10.4.4.3.Market size analysis, by Technology, 2022-2031
10.4.4.4.Market size analysis, by Application, 2022-2031
10.4.4.5.Market size analysis, by Industry Vertical, 2022-2031
10.4.5.Rest of LAMEA
10.4.5.1.Market size analysis, by Type , 2022-2031
10.4.5.2.Market size analysis, by Modularity, 2022-2031
10.4.5.3.Market size analysis, by Technology, 2022-2031
10.4.5.4.Market size analysis, by Application, 2022-2031
10.4.5.5.Market size analysis, by Industry Vertical, 2022-2031
10.4.6.Research Dive Exclusive Insights
10.4.6.1.Market attractiveness
10.4.6.2.Competition heatmap
11.Competitive Landscape
11.1.Top winning strategies, 2022
11.1.1.By strategy
11.1.2.By year
11.2.Strategic overview
11.3.Market share analysis, 2022
12.Company Profiles
12.1.Beckman Coulter
12.1.1.Overview
12.1.2.Business segments
12.1.3.Type portfolio
12.1.4.Financial performance
12.1.5.Recent developments
12.1.6.SWOT analysis
12.1.7.Research Dive Analyst View
12.2.Particle Measuring Systems
12.2.1.Overview
12.2.2.Business segments
12.2.3.Type portfolio
12.2.4.Financial performance
12.2.5.Recent developments
12.2.6.SWOT analysis
12.2.7.Research Dive Analyst View
12.3.RION Co. Ltd.
12.3.1.Overview
12.3.2.Business segments
12.3.3.Type portfolio
12.3.4.Financial performance
12.3.5.Recent developments
12.3.6.SWOT analysis
12.3.7.Research Dive Analyst View
12.4. Lighthouse Worldwide Solutions
12.4.1.Overview
12.4.2.Business segments
12.4.3.Type portfolio
12.4.4.Financial performance
12.4.5.Recent developments
12.4.6.SWOT analysis
12.4.7.Research Dive Analyst View
12.5.TSI
12.5.1.Overview
12.5.2.Business segments
12.5.3.Type portfolio
12.5.4.Financial performance
12.5.5.Recent developments
12.5.6.SWOT analysis
12.5.7.Research Dive Analyst View
12.6.Climet Instruments Company
12.6.1.Overview
12.6.2.Business segments
12.6.3.Type portfolio
12.6.4.Financial performance
12.6.5.Recent developments
12.6.6.SWOT analysis
12.6.7.Research Dive Analyst View
12.7.Met One Instruments
12.7.1.Overview
12.7.2.Business segments
12.7.3.Type portfolio
12.7.4.Financial performance
12.7.5.Recent developments
12.7.6.SWOT analysis
12.7.7.Research Dive Analyst View
12.8.Particle Plus
12.8.1.Overview
12.8.2.Business segments
12.8.3.Type portfolio
12.8.4.Financial performance
12.8.5.Recent developments
12.8.6.SWOT analysis
12.8.7.Research Dive Analyst View
12.9.PAMAS
12.9.1.Overview
12.9.2.Business segments
12.9.3.Type portfolio
12.9.4.Financial performance
12.9.5.Recent developments
12.9.6.SWOT analysis
12.9.7.Research Dive Analyst View
12.10.Chemtrac.
12.10.1.Overview
12.10.2.Business segments
12.10.3.Type portfolio
12.10.4.Financial performance
12.10.5.Recent developments
12.10.6.SWOT analysis
12.10.7.Research Dive Analyst View
13.Appendix
13.1.Parent & peer market analysis
13.2.Premium insights from industry experts
13.3.Related reports
A particle counter is a system or a device designed and built to monitor, diagnose, and analyze particle contamination in specific mediums like air, water, mixtures, and chemicals. Most particle counters work on the principle of light scattering by employing a high-intensity light emitter, highly-sensitive light detector, and a controlled media flow. Particle counters are extensively used in food and beverage industry, pharmaceutical industry, automobile and semiconductor manufacturing industry, etc.
Forecast Analysis of the Particle Counters Market
In the recent years, there has been a steady increase in demand for particle counters from the food and beverage industry. This surge in demand is predicted to be the primary growth driver of the particle counters market in the forecast period. Additionally, increasing demand for particle counters from the clean room facilities is anticipated to push the market forward. Along with this, increasing governmental legislations and regulations to curb air pollution is projected to offer numerous growth and investment opportunities to the market in the analysis timeframe. However, lack of standardization of particle counters is estimated to create hurdles in the full-fledged growth of the particle counters market in the coming period.
Regionally, the particle counters market in the North America region is expected to be the most dominant by 2031. Growing investments in research and development (R&D) sector of the life sciences and medical devices industry is expected to be the leading factor behind the growth of the market in this region.
According to the report published by Research Dive, the global particle counters market is expected to gather a revenue of $936.8 million by 2031 and grow at 10.3% CAGR in the 2022–2031 timeframe. Some prominent market players include Beckman Coulter, TSI, Particle Plus, Particle Measuring Systems, Climet Instruments Company, PAMAS, RION Co. Ltd., Met One Instruments, Chemtrac, Lighthouse Worldwide Solutions, and many others.
Covid-19 Impact on the Particle Counters Market
The outbreak of the Covid-19 pandemic has had a massive negative effect on almost all industries and businesses across the world. The particle counters market, however, faced a moderate impact of the pandemic. The lockdowns caused a massive decline in the manufacturing of automobiles and semiconductors which reduced the demand for particle counters from these industries. However, this was compensated by an increase in demand from the pharmaceutical industry which saw a huge boost due to drug development and research being carried on during the pandemic period.
Particle Counters Market Developments
The significant companies operating in the particle counters market are adopting numerous growth strategies & business tactics, such as partnerships, collaborations, mergers & acquisitions, and launches to maintain a robust position in the overall market, thus helping the particle counters market to flourish. For instance:
- In July 2020, Beckman Coulter, a biomedical device manufacturing company, announced the launch of a new portable particle counter for simplification of routine environmental monitoring for GMP cleanroom users. This product launch by Beckman Coulter is expected to cater to the demands of the particle counters market in a much better way in the coming period.
- In November 2022, Particle Measuring Systems, a leading particle counter system solutions provider, announced the launch of 10 nm aerosol particle counter that can help in detecting yield impact particles across critical cleanroom areas. This new product launched by Particle Measuring Systems is expected to boost the market share of the company substantially in the near future.
- In January 2023, Ansys, an American software company, announced that it was acquiring a leading particle dynamics simulation software called Rocky DEM. This acquisition of Rocky DEM will help Ansys to monitor and assess the dynamic nature of particles, and thus provide critical inputs to a wide range of industrial clients.
Personalize this research
- Triangulate with your own data
- Request your format and definition
- Get a deeper dive on a specific application, geography, customer or competitor
- + 1-888-961-4454 Toll - Free
- support@researchdive.com
