Utility Pole Market Report
RA00071
Utility Pole Market, by Type (Distribution Poles, Transmission Poles), Material (Steel, Composites, Concrete, Wood), Pole size (below 40 ft, between 40 ft and 70 ft, above 70 ft), Application (Heavy Power Lines, Sub Transmission Lines, Electricity Transmission & Distribution, Street Lighting, Telecommunication, Others), Regional Analysis (North America, Europe, Asia-Pacific, LAMEA): Global Opportunity Analysis and Industry Forecast, 2019–2026
Update Available On-Demand
Global Utility Pole Market Insights 2026:
According to the utility pole market analysis by Research Dive, the global market will surpass $57,052.3 million by 2026, increasing from $44,688.0 million in 2018, at a CAGR of 3.0%. North America region is expected to experience significant growth reach $16,167.4 million, by 2026. Asia-Pacific is expected to reach $23,020.6 million by 2026.
Utility pole is a tall pole with telephone or electrical wires attached to it. Utility poles are used to support overhead electricity cables and several public service lines that includes fiber-optic cable, electrical cable and related systems such as street lights and transformers. Based on their use, they may be referred as telecommunication poles, transmission poles, power poles and others.
Utility Pole Market Synopsis
The market for utility pole is primarily driven by technological advancements of composite utility poles and the growing energy consumption across the globe.
The main restraining factor of the payment processing solutions market is the growth in the underground connection channels.
According to the regional outlook, the North America utility pole market is anticipated to have enormous growth opportunities by surpassing a revenue of $16,167.4 million with a CAGR of 3.2% during the analysis period.
Market Drivers:
Growth in the energy consumption is one of the key utility pole market trends
Utility pole market drivers: The utility pole market is majorly driven by increase in the energy consumption across the globe coupled with increase in the acceptance in the telecommunication industry. Utility poles are primarily used to support and carry electrical lines, distribution lines and sub-transmission lines. Power transmission and power distribution are key applications and play important role in the maintaining power networks; in this process, electricity in transferred from power stations to regional sub stations and further to consumer homes. Furthermore, the utility poles are used in communication sector to carry coax for television broadcasting and fiber optic cables for telecommunication lines; these factors are projected to boost the market growth.
Market Restraints:
Growing the trend for undergoing connections is restraining the growth of utility pole market
In spite of several advantages, increase in the underground communication channels is restricting the growth of the market.
Market Opportunities:
Development of composite utility poles has created a significant investment opportunity for the growth of utility pole market
Technological advancements on composite materials as utility poles is creating ample growth opportunities in the utility pole market. These composite materials having superior properties and cost-effective materials will drive the growth of the market in the coming years.
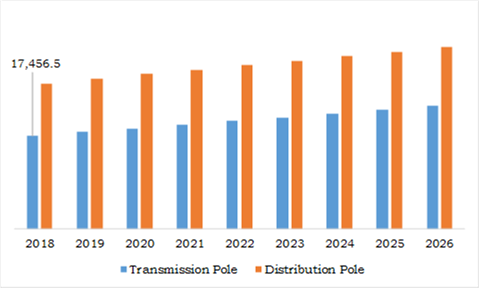
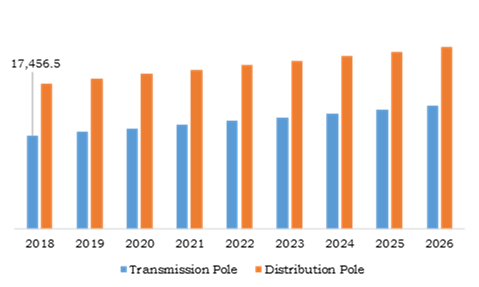
Utility Pole Market Segmentation, by Type
Transmission pole is predicted to be most lucrative till the end of 2026
Source: Research Dive Analysis
The transmission pole is expected to reach $23,027.9 million by 2026, rising at a rate of 3.5% and increasing from $17,456.5 million in 2018 due to use in the high voltage DC and AC systems. The distribution poles segment held the evident utility pole market size in 2018, generated revenue of $27,231.5 million, and is anticipated to reach $34,024.4 million by 2026. This dominance is attributed to growing energy consumption across the globe. Hence, the growth in energy consumption is directly impacting the demand for utility pole market.
Utility Pole Market, by Material
Composite material is predicted to be most lucrative till the end of 2026
Source: Research Dive Analysis
Composite pole material market will witness significant growth rate and is expected to create massive investment opportunities in the utility pole market. This is because the composite materials are resistant against corrosion, durable, light weight and strong against heavy loads. The market for composite is anticipated to reach $1,554.7 million, growing at a rate of 4.0% during forecast period and is increasing from $1,128.4 million in 2018. Wood segment generated the highest market share in 2018 and expected to continue its market growth during the forecast period, due to wide usage of wood in utility pole making. The market for wood is anticipated to reach $28,069.7 million by 2026.
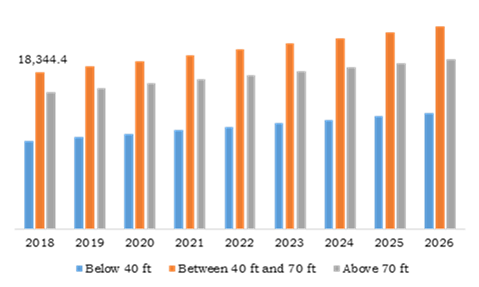
Utility Pole Market, by Pole Size
Between 40 ft and 70 ft pole is predicted to be most lucrative till 2026
Source: Research Dive Analysis
Above 70 feet pole accounted the second highest share and it will experience substantial growth during the forecast period. Electric cables are often required to pass through wildlife sanctuaries for transportation; there, poles above 70 ft of height are preferred so that they are protected from wildlife. Due to this, the market for above 70 feet is expected to reach $19,832.6 million by 2026. Between 40 ft and 70 ft poles held the largest market share on $18,344.4 million in 2018 and are expected generate $23,648.2 million by 2026. These poles are can be used in both energy distribution and energy transmission applications.
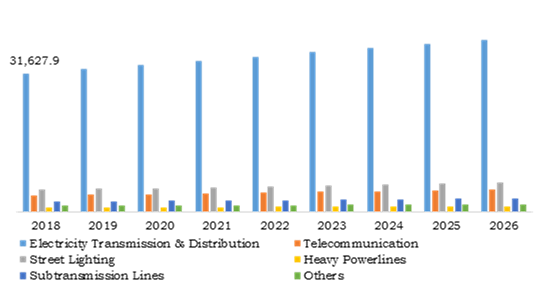
Utility Pole Market, by Application
Electricity transmission & Distribution has dominated and is projected to lucrative during forecast period.
Source: Research Dive Analysis
The utility pole market for telecommunication application is expected to experience noteworthy growth and anticipated to reach $5,077.7 million during forecast period. Electricity transmission & distribution generated the largest share in the global market, registering $31,627.9 million in 2018 and is projected to continue its growth over forecast period. This is majorly due to increase in the power consumption across the world. The growth in the consumption of utility pole for electricity transmission & distribution applications is increasing the demand for the utility pole market. The market for electricity transmission & distribution is estimated to reach $39,351.8 million, growing at a CAGR of 2.7% during forecast period. In recent times, the Indian government announced a program “100% village electrification” and India is one of the largest electricity consumers in the world.
Utility Pole Market, by Region:
North America Utility Pole Market Overview 2026:
North America will have enormous opportunities for the market investors to grow over the coming years
The utility pole market for North America region is expected to experience significant growth reach $16,167.4 million, growing at a 3.2% CAGR during forecast period and is increasing from $12,529.6 million in 2018. The growth is attributed to increase in the electricity consumption across the region requires huge number of utility poles to provide electricity to the consumers; this is expected to drive the growth of the utility pole market in the North America region.
Asia-Pacific Utility Pole Market Outlook 2026:
Asia-Pacific has dominated the global utility pole market and registered for the majority of utility pole market share of 39.1% in 2018 and is expected to continue its dominance during forecast time. This is due to presence of massive population countries like China and India and these countries are major revenue contributors in Asia-Pacific region. This factor will drive the market growth in this region. Asia-Pacific is expected to reach $23,020.6 million by 2026.
Key Participants in Global Utility Pole Market:
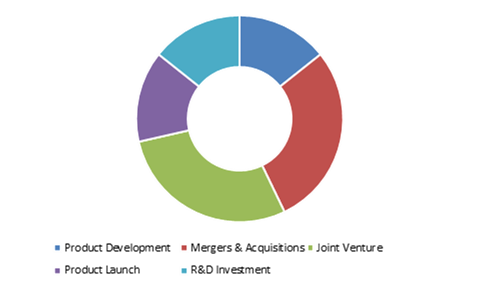
Product development and joint ventures are the most common strategies followed by the market players
Source: Research Dive Analysis
Top key utility pole market players include El Sewedy Electric Company, Hill & Smith Holdings Plc, KEC International, Valmont Industries Inc., Skipper Ltd., Omega Factory, Nippon Concrete Industries Co. Ltd., Pelco products Inc., Stella-Jones, RS Technologies Inc. and FUCHS Europoles GmbH. The key players are adopting some of the strategies such as mergers & acquisitions, geographical expansions, product developments and R&D investments to increase their position in the overall utility pole industry.
| Aspect | Particulars |
| Historical Market Estimations | 2018-2019 |
| Base Year for Market Estimation | 2018 |
| Forecast timeline for Market Projection | 2019-2026 |
| Geographical Scope | North America, Europe, Asia-Pacific, LAMEA |
| Segmentation by Type
|
|
| Segmentation by Material
|
|
| Segmentation by Pole Size
|
|
| Segmentation by Application
|
|
| Key Countries Covered | U.S., Canada, Germany, UK, Italy, Spain, Russia, Japan, China, India, South Korea, Australia, Brazil, Argentina, GCC, and Saudi Arabia |
| Key Companies Profiled |
|
Source: Research Dive Analysis
Q1. What is the size of the utility pole market?
A. The global utility pole market size was over $44,688.0 million in 2018, and is further anticipated to reach $57,052.3 million by 2026.
Q2. Which are the leading companies in the utility pole market?
A. El Sewedy Electric Company, Hill & Smith Holdings Plc, Skipper Ltd., and Nippon Concrete Industries Co. Ltd. are some of the key players in the global utility pole market.
Q3. Which region possesses greater investment opportunities in the coming future?
A. North America possesses great investment opportunities for investors to witness the most promising growth in the coming years.
Q4. What is the growth rate of the North America Market?
A. North America utility pole market is projected to grow at 3.2% CAGR during the forecast period.
Q5. What are the strategies opted by the leading players in this market?
A. Product development and joint ventures are the key strategies opted by the operating companies in this market.
Q6. Which companies are investing more on R&D practices?
A. Valmont Industries Inc., Hill & Smith Holdings Plc, and Nippon Concrete Industries Co. Ltd., are investing more on R&D activities for developing new products and technologies.
1.Research Methodology
1.1.Desk Research
1.2.Real time insights and validation
1.3.Forecast model
1.4.Assumptions and forecast parameters
1.4.1.Assumptions
1.4.2.Forecast parameters
1.5.Data sources
1.5.1.Primary
1.5.2.Secondary
2.Executive Summary
2.1.360° summary
2.2.Type trends
2.3.Material trends
2.4.Pole size trends
2.5.Application trends
3.Market overview
3.1.Market segmentation & definitions
3.2.Key takeaways
3.2.1.Top investment pockets
3.2.2.Top winning strategies
3.3.Porter’s five forces analysis
3.3.1.Bargaining power of consumers
3.3.2.Bargaining power of suppliers
3.3.3.Threat of new entrants
3.3.4.Threat of substitutes
3.3.5.Competitive rivalry in the market
3.4.Market dynamics
3.4.1.Drivers
3.4.2.Restraints
3.4.3.Opportunities
3.5.Technology landscape
3.6.Regulatory landscape
3.7.Patent landscape
3.8.Strategic overview
4.Utility Pole Market, by Type
4.1.Distribution poles
4.1.1.Market size and forecast, by region, 2018-2026
4.1.2.Market share analysis, by country
4.2.Transmission poles
4.2.1.Market size and forecast, by region, 2018-2026
4.2.2.Market share analysis, by country
5.Utility Pole Market, by Material
5.1.Steel
5.1.1.Market size and forecast, by region, 2018-2026
5.1.2.Market share analysis, by country
5.2.Composite
5.2.1.Market size and forecast, by region, 2018-2026
5.2.2.Market share analysis, by country
5.3.Concrete
5.3.1.Market size and forecast, by region, 2018-2026
5.3.2.Market share analysis, by country
5.4.Wood
5.4.1.Market size and forecast, by region, 2018-2026
5.4.2.Market share analysis, by country
6.Utility Pole Market, by Pole size
6.1.Below 40 ft
6.1.1.Market size and forecast, by region, 2018-2026
6.1.2.Market share analysis, by country
6.2.Between 40 ft and 70 ft
6.2.1.Market size and forecast, by region, 2018-2026
6.2.2.Market share analysis, by country
6.3.Above 70 ft
6.3.1.Market size and forecast, by region, 2018-2026
6.3.2.Market share analysis, by country
7.Utility Pole Market, by Application
7.1.Heavy power lines
7.1.1.Market size and forecast, by region, 2018-2026
7.1.2.Market share analysis, by country
7.2.Sub transmission lines
7.2.1.Market size and forecast, by region, 2018-2026
7.2.2.Market share analysis, by country
7.3.Electricity transmission & distribution
7.3.1.Market size and forecast, by region, 2018-2026
7.3.2.Market share analysis, by country
7.4.Street lightning
7.4.1.Market size and forecast, by region, 2018-2026
7.4.2.Market share analysis, by country
7.5.Telecommunication
7.5.1.Market size and forecast, by region, 2018-2026
7.5.2.Market share analysis, by country
7.6.Others
7.6.1.Market size and forecast, by region, 2018-2026
7.6.2.Market share analysis, by country
8.Utility Pole Market, by Region
8.1.North America
8.1.1.Market size and forecast, by type, 2018-2026
8.1.2.Market size and forecast, by material, 2018-2026
8.1.3.Market size and forecast, by pole size, 2018-2026
8.1.4.Market size and forecast, by application, 2018-2026
8.1.5.Market size and forecast, by country, 2018-2026
8.1.6.Market share analysis, by country
8.1.7.U.S.
8.1.7.1.Market size and forecast, by type, 2018-2026
8.1.7.2.Market size and forecast, by material, 2018-2026
8.1.7.3.Market size and forecast, by pole size, 2018-2026
8.1.7.4.Market size and forecast, by application, 2018-2026
8.1.7.5.Market share analysis, by country
8.1.8.Canada
8.1.8.1.Market size and forecast, by type, 2018-2026
8.1.8.2.Market size and forecast, by material, 2018-2026
8.1.8.3.Market size and forecast, by pole size, 2018-2026
8.1.8.4.Market size and forecast, by application, 2018-2026
8.1.8.5.Market share analysis, by country
8.2.Europe
8.2.1.Market size and forecast, by type, 2018-2026
8.2.2.Market size and forecast, by material, 2018-2026
8.2.3.Market size and forecast, by pole size, 2018-2026
8.2.4.Market size and forecast, by application, 2018-2026
8.2.5.Market size and forecast, by country, 2018-2026
8.2.6.Market share analysis, by country
8.2.7.Germany
8.2.7.1.Market size and forecast, by type, 2018-2026
8.2.7.2.Market size and forecast, by material, 2018-2026
8.2.7.3.Market size and forecast, by pole size, 2018-2026
8.2.7.4.Market size and forecast, by application, 2018-2026
8.2.7.5.Market share analysis, by country
8.2.8.UK
8.2.8.1.Market size and forecast, by type, 2018-2026
8.2.8.2.Market size and forecast, by material, 2018-2026
8.2.8.3.Market size and forecast, by pole size, 2018-2026
8.2.8.4.Market size and forecast, by application, 2018-2026
8.2.8.5.Market share analysis, by country
8.2.9.France
8.2.9.1.Market size and forecast, by type, 2018-2026
8.2.9.2.Market size and forecast, by material, 2018-2026
8.2.9.3.Market size and forecast, by pole size, 2018-2026
8.2.9.4.Market size and forecast, by application, 2018-2026
8.2.9.5.Market share analysis, by country
8.2.10.Spain
8.2.10.1.Market size and forecast, by type, 2018-2026
8.2.10.2.Market size and forecast, by material, 2018-2026
8.2.10.3.Market size and forecast, by pole size, 2018-2026
8.2.10.4.Market size and forecast, by application, 2018-2026
8.2.10.5.Market share analysis, by country
8.2.11.Italy
8.2.11.1.Market size and forecast, by type, 2018-2026
8.2.11.2.Market size and forecast, by material, 2018-2026
8.2.11.3.Market size and forecast, by pole size, 2018-2026
8.2.11.4.Market size and forecast, by application, 2018-2026
8.2.11.5.Market share analysis, by country
8.2.12.Rest of Europe
8.2.12.1.Market size and forecast, by type, 2018-2026
8.2.12.2.Market size and forecast, by material, 2018-2026
8.2.12.3.Market size and forecast, by pole size, 2018-2026
8.2.12.4.Market size and forecast, by application, 2018-2026
8.2.12.5.Market share analysis, by country
8.3.Asia Pacific
8.3.1.Market size and forecast, by type, 2018-2026
8.3.2.Market size and forecast, by material, 2018-2026
8.3.3.Market size and forecast, by pole size, 2018-2026
8.3.4.Market size and forecast, by application, 2018-2026
8.3.5.Market size and forecast, by country, 2018-2026
8.3.6.Market share analysis, by country
8.3.7.China
8.3.7.1.Market size and forecast, by type, 2018-2026
8.3.7.2.Market size and forecast, by material, 2018-2026
8.3.7.3.Market size and forecast, by pole size, 2018-2026
8.3.7.4.Market size and forecast, by application, 2018-2026
8.3.7.5.Market share analysis, by country
8.3.8.India
8.3.8.1.Market size and forecast, by type, 2018-2026
8.3.8.2.Market size and forecast, by material, 2018-2026
8.3.8.3.Market size and forecast, by pole size, 2018-2026
8.3.8.4.Market size and forecast, by application, 2018-2026
8.3.8.5.Market share analysis, by country
8.3.9.Australia
8.3.9.1.Market size and forecast, by type, 2018-2026
8.3.9.2.Market size and forecast, by material, 2018-2026
8.3.9.3.Market size and forecast, by pole size, 2018-2026
8.3.9.4.Market size and forecast, by application, 2018-2026
8.3.9.5.Market share analysis, by country
8.3.10.Rest of Asia Pacific
8.3.10.1.Market size and forecast, by type, 2018-2026
8.3.10.2.Market size and forecast, by material, 2018-2026
8.3.10.3.Market size and forecast, by pole size, 2018-2026
8.3.10.4.Market size and forecast, by application, 2018-2026
8.3.10.5.Market share analysis, by country
8.4.LAMEA
8.4.1.Market size and forecast, by type, 2018-2026
8.4.2.Market size and forecast, by material, 2018-2026
8.4.3.Market size and forecast, by pole size, 2018-2026
8.4.4.Market size and forecast, by application, 2018-2026
8.4.5.Market size and forecast, by country, 2018-2026
8.4.6.Market share analysis, by country
8.4.7.Latin America
8.4.7.1.Market size and forecast, by type, 2018-2026
8.4.7.2.Market size and forecast, by material, 2018-2026
8.4.7.3.Market size and forecast, by pole size, 2018-2026
8.4.7.4.Market size and forecast, by application, 2018-2026
8.4.7.5.Market share analysis, by country
8.4.8.Middle East
8.4.8.1.Market size and forecast, by type, 2018-2026
8.4.8.2.Market size and forecast, by material, 2018-2026
8.4.8.3.Market size and forecast, by pole size, 2018-2026
8.4.8.4.Market size and forecast, by application, 2018-2026
8.4.8.5.Market share analysis, by country
8.4.9.Africa
8.4.9.1.Market size and forecast, by type, 2018-2026
8.4.9.2.Market size and forecast, by material, 2018-2026
8.4.9.3.Market size and forecast, by pole size, 2018-2026
8.4.9.4.Market size and forecast, by application, 2018-2026
8.4.9.5.Market share analysis, by country
9.Company profiles
9.1.El Sewedy Electric Company
9.1.1.Business overview
9.1.2.Financial performance
9.1.3.Product portfolio
9.1.4.Recent strategic moves & developments
9.1.5.SWOT analysis
9.2.Hill & Smith Holdings Plc
9.2.1.Business overview
9.2.2.Financial performance
9.2.3.Product portfolio
9.2.4.Recent strategic moves & developments
9.2.5.SWOT analysis
9.3.KEC International
9.3.1.Business overview
9.3.2.Financial performance
9.3.3.Product portfolio
9.3.4.Recent strategic moves & developments
9.3.5.SWOT analysis
9.4.Valmont Industries Inc.
9.4.1.Business overview
9.4.2.Financial performance
9.4.3.Product portfolio
9.4.4.Recent strategic moves & developments
9.4.5.SWOT analysis
9.5.Skipper Ltd.
9.5.1.Business overview
9.5.2.Financial performance
9.5.3.Product portfolio
9.5.4.Recent strategic moves & developments
9.5.5.SWOT analysis
9.6.Omega Factory
9.6.1.Business overview
9.6.2.Financial performance
9.6.3.Product portfolio
9.6.4.Recent strategic moves & developments
9.6.5.SWOT analysis
9.7.Nippon Concrete Industries Co. Ltd.
9.7.1.Business overview
9.7.2.Financial performance
9.7.3.Product portfolio
9.7.4.Recent strategic moves & developments
9.7.5.SWOT analysis
9.8.Pelco products Inc.
9.8.1.Business overview
9.8.2.Financial performance
9.8.3.Product portfolio
9.8.4.Recent strategic moves & developments
9.8.5.SWOT analysis
9.9.Stella-Jones
9.9.1.Business overview
9.9.2.Financial performance
9.9.3.Product portfolio
9.9.4.Recent strategic moves & developments
9.9.5.SWOT analysis
9.10.RS Technologies Inc.
9.10.1.Business overview
9.10.2.Financial performance
9.10.3.Product portfolio
9.10.4.Recent strategic moves & developments
9.10.5.SWOT analysis
9.11.FUCHS Europoles GmbH
9.11.1.Business overview
9.11.2.Financial performance
9.11.3.Product portfolio
9.11.4.Recent strategic moves & developments
9.11.5.SWOT analysis
Traditionally, only wooden poles have been used in the utility sector, which are now gradually replaced by steel poles. The steel content profile was certified as a green commodity in 2013. Currently, composite material poles are showing better benefits over both steel and wood poles, and the global market could see the likelihood of composite poles replacing steel poles in the next 20 years. This is mainly due to the longer lifetime and better benefits of carbon poles. Nevertheless, the current market for utility poles is driven primarily by wood and steel poles and their demand is growing dramatically across the globe. The global market for utility poles is extremely developed in nature and is expected to show moderate growth during the forecast period.
Increased energy demand and the extension of current power networks are the main drivers of this market's growth opportunities. Governments from underdeveloped or developing countries are mainly looking forward to an increase in the rate of access to electricity, which requires heavy spending in the electricity sector to build up the total electricity network. As a consequence, countries such as Mexico, Nigeria, and Africa are anticipated to see new investment in service services in the coming years.
In the forecast period, the wood sector holds the largest market share in 2018 and is projected to be the largest market by the material. The demand for distribution poles accounted for the largest market share of utility poles in 2018 by type, Height of poles between 40 ft and 70 ft, poles are widely embraced poles and also created the highest revenue in 2018 by pole height, utility poles from 40 ft. To 70 ft. Are used in both electricity storage and energy distribution projects. The electricity transmission and distribution group accounted for the largest market share in 2018 by its applications.
North America will have enormous potential for retail holders to expand in the coming years.
Asia-Pacific emerged as the global market leader in 2018 among all countries. This can be highly credible due to the presence of extremely populous countries such as India and China, which are creating enhanced demand for electricity and increasing the rate of access to electricity across the world. The development of power transmission networks in response to the growth in energy is also a key factor in creating healthy demand for electricity in the country.
The North American utility pole market is expected to grow significantly, to $16,167.4 million, to 3.2% CAGR during the forecast period, and to raise from $12,529.6 million in 2018. Development is due to a rise in electricity consumption across the world, creating a significant number of power poles to provide electricity to customers, which is expected to drive the development of the electricity pole industry in the North American region.
Asia-Pacific led the global market for utility poles and accounted for a bulk of the market share for utility poles of 39.1% in 2018 and is predicted to lead during the forecast period. There is a massive demand for electricity across the country due to the huge population. This factor will drive the growth of the business in this area. Asia-Pacific is expected to reach 23,020.6 million dollars by 2026.
Product development and joint ventures are the most successful approaches adopted by market participants.
Some of the approaches, such as mergers and acquisitions, global extensions, product launches, and R&D spending, are embraced by key players to improve their role in the overall utility pole market. Product development and joint ventures are the most successful approaches adopted by market participants. Skipper Ltd., El Sewedy Electric Company, Stella-Jones, Omega Factory, RS Technologies Inc., Valmont Industries Inc., Nippon Concrete Industries Co. Ltd., Hill & Smith Holdings PLC, FUCHS Europoles GmbH, and Pelco Products Inc. are some of the major market participants analyzed and profiled in the global utility pole sector.
Personalize this research
- Triangulate with your own data
- Request your format and definition
- Get a deeper dive on a specific application, geography, customer or competitor
- + 1-888-961-4454 Toll - Free
- support@researchdive.com
