Aerospace 3D Printing Market Report
RA00076
Aerospace 3D Printing Market, by Type (Printers, Materials), by Application (Engine Component, Structural Component, Space Component) by End-Use (UAVs, Aircraft, Space Craft), Regional Analysis (North America, Europe, Asia-Pacific, LAMEA), Global Opportunity Analysis and Industry Forecast, 2019–2026
Update Available On-Demand
Global Aerospace 3D Printing Market Insights 2026
The global aerospace 3D printing market forecast will be $5,933.4 million by 2026, increasing from $887.9 million in 2018 at a healthy CAGR of 26.8%. North America market is anticipated to rise at a CAGR of 26.2% by generating a revenue of $2,284.3 million by 2026.
The aircraft manufacturing industry uses 3D printing to, limit warehouse space, reduction of waste production materials, decrease storage costs and manufacture end-use products. Aerospace 3D printing is also using the technology for the reduction of commercial aeroplane travel emissions. Many market players have initiated the development of on-site 3D printing operations and also started investing in the technology. Moreover, 3D printed aircraft parts are more durable along with being 65% lighter than traditional aircraft components.
Market Drivers:
Tremendously increasing demand for Boeing 787 and Airbus A320 is the massive growth factor of the Global Aerospace 3D Printing market.
Booming air travel and significantly growing demand for top-selling aircraft such as B787 and A320 are one of the major factors for the Aerospace 3D Printing Market Forecast. For instance, as per managing director of Etihad Aviation Training, Captain Paolo La Cava, travel by air is rapidly increasing and so is the demand for aviation professionals and pilots. Moreover, increasing popularity for A320 and B787 airbuses has resulted in massive growth in the pilot training division of Abu Dhabi’s Etihad Airways. These above-mentioned key factors are expected to foster the growth of the global market. In addition, the surge in the satellite industry and technological advancements in 3D printing technology are also anticipated to drive the demand for 3D printing in aerospace market.
Market Restraints:
High costs will pose a severe threat to the Global Aerospace 3D Printing Market.
The components being expensive is the major factor that will obstruct the Aerospace 3D Printing industry. In addition, 3D printing is not yet wide-spread to work with more number of materials. Furthermore, most of the 3D printing materials are not recyclable and food safe.
Market Opportunities:
Aerospace 3D printing market trends such as 3DPaaS and 3D printed UAVs can create huge opportunities for the growth of the global market.
Established aerospace manufacturers are focusing more on 3D printing to enhance the performance by reduction of maintenance requirements and saving fuel costs. Moreover, 3D printed UAVs (Unmanned Aerial Systems) have the capability to perform rescue operations and monitor the situation in which aircrafts can examine the disaster and reports to the mission control. In addition, NASA is exploring more in 3D Printing as a Service (3DPaaS) for rapid pre-prototyping. Using 3DPaaS, professionals could obtain alternative design, approval for final prototype and concept peer reviews. These huge advancements in aerospace 3D printing are expected to create lucrative opportunities for the global market.
Aerospace 3D Printing Market, by Type:
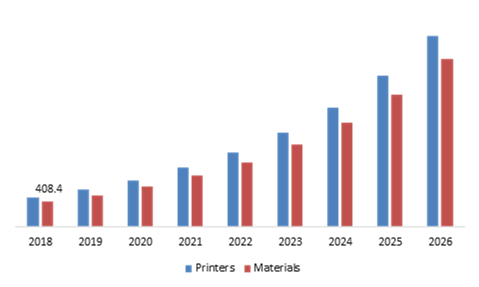
Materials segment will generate a revenue of $2,776.8 Mn by 2026
Source: Research Dive Analysis
The materials segment is anticipated to grow at a healthy rate and is forecasted to account for $2,776.8 million by 2026, rising from $408.4 million in 2018.
Materials segment of the global market is anticipated to grow at a fastest CAGR throughout the projected period. Enormously increasing demand for a wide range of materials to the print engine and structural components of aircrafts is one of the major factors for the growth of this segment. Moreover, the rising focus of market players on manufacturing engine components and heavy investments on R&D is expected to drive the growth of the global market. Printers segment has the highest share in the market, and it will generate a revenue of $3,156.6 million, during the forecasted period.
Aerospace 3D Printing Market, by Application:
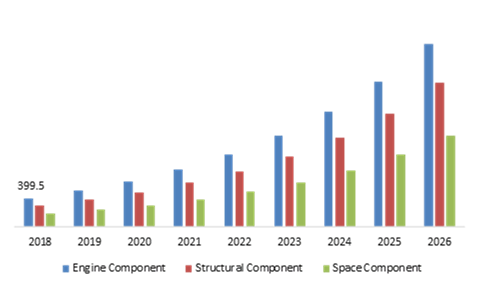
Space Component segment will generate a revenue of $1,296.3 Mn by 2026
Source: Research Dive Analysis
By application, the market is classified into engine components, structural components, and space component.
Engine components have the largest market share and it will generate a revenue of $2,598.8 million by 2026. More focus of leading engine manufacturers to enhance engine parts of turbofan engines using the 3D printing technology is anticipated to boost the growth of the global market.
Aerospace 3D printing market size for space component will witness a significant growth and is anticipated to account for $1,296.3 million by 2026, with an increase from $186.5 million in 2018; this is significantly owing to the necessity of low weight parts and high resistance against extreme conditions that can be manufactured by using 3D printing technologies.
Aerospace 3D Printing Market, by End-Use:
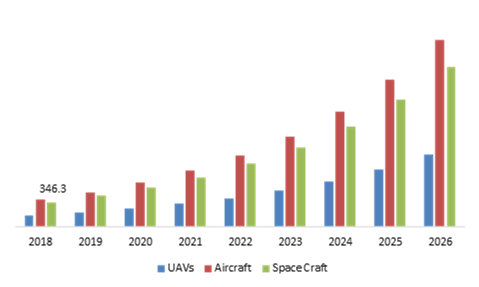
Aircraft segment will generate revenue of $2,647.1 Mn by 2026
Source: Research Dive Analysis
By end-use, the market is categorized into UAVs, Aircraft, and Space Craft. Aircraft segment is anticipated to grow at a healthy rate, and is forecasted to account for $2,647.1 million by 2026, rising from $381.8 million in 2018.
Extensively rising air travel across the globe is one of the significant factors for the boost of the global market over the projected period. In addition to increasing competitiveness among international and domestic airline companies, the air fares are decreasing exponentially, which is further enhancing demand for air travel, which in turn accelerates the demand for the global market.
Aerospace 3D Printing Market Segmentation, by Region:
North America Aerospace 3D Printing Market Overview 2026
North America market will reach up to $2,284.3 million by the end of 2026
Aerospace 3D Printing market share for North America is anticipated to rise at a CAGR of 26.2% by generating a revenue of $2,284.3 million by 2026. Improvisation in the supply chain, rising demand for lighter aircraft components is anticipated to spur the demand for 3D printing in aerospace industry. Moreover, financial support from the US government for R&D along with recent technological developments in 3D printing will drive the North American market over the projected period in this region.
Key Participants in the Global Aerospace 3D Printing Market:
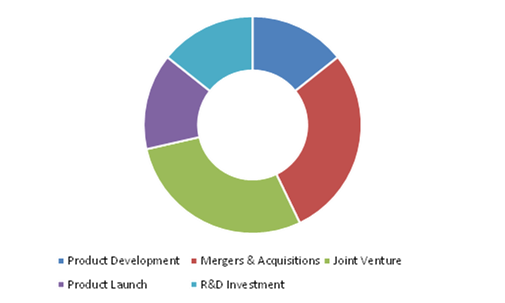
Merger & acquisition and advanced product development are the frequent strategies followed by the market players
Source: Research Dive Analysis
Some of the significant market players include Ultimaker BV, 3D Systems, Inc., Arcam AB, ExOne., Höganäs AB, EOS GmbH, Materialise, Norsk Titanium US Inc., ENVISIONTEC, INC., and Aerojet Rocketdyne. Market Players prefer inorganic growth strategies to expand into local markets. Established market players are emphasizing more on Merger & acquisition and advanced product development. These are the frequent strategies followed by established organizations, for instance, General Electric is planning to manufacture 25,000 LEAP engine nozzles by using 3D printing.
| Aspect | Particulars |
| Historical Market Estimations | 2018-2019 |
| Base Year for Market Estimation | 2018 |
| Forecast timeline for Market Projection | 2019-2026 |
| Geographical Scope | North America, Europe, Asia-Pacific, LAMEA |
| Segmentation by Type |
|
| Segmentation by Application |
|
| Segmentation by End-Use |
|
| Key Countries Covered | U.S., Canada, Germany, France, Spain, Russia, Japan, China, India, South Korea, Australia, Brazil, and Saudi Arabia |
| Key Companies Profiled |
|
Source: Research Dive Analysis
Q1. What is the size of the Aerospace 3D Printing Market system?
A. The global Aerospace 3D Printing Market system size was over $887.9 million in 2018, and is projected to reach $5,933.4 million by 2026.
Q2. Which are the leading companies in the Aerospace 3D Printing Market system?
A. Ultimaker BV, 3D Systems, Inc., Arcam AB are some of the key players in the global Aerospace 3D Printing Market system.
Q3. Which region possesses greater investment opportunities in the coming future?
A. North America region possess great investment opportunities for the investors to witness the most promising growth in the future.
Q4. What is the growth rate of the North America market?
A. North America Aerospace 3D Printing Market system is anticipated to grow at 26.2% CAGR during the forecast period.
Q5. What are the strategies opted by the leading players in this market?
A. Technological advancements, product development, along with joint ventures are the key strategies opted by the operating companies in this market.
Q6. Which companies are investing more in R&D practices?
A. Norsk Titanium US Inc., ENVISIONTEC, INC. and Aerojet Rocketdyne companies are investing more in R&D activities for developing new products and technologies.
1. Research Methodology
1.1. Desk Research
1.2. Real time insights and validation
1.3. Forecast model
1.4. Assumptions and forecast parameters
1.4.1. Assumptions
1.4.2. Forecast parameters
1.5. Data sources
1.5.1. Primary
1.5.2. Secondary
2. Executive Summary
2.1. 360° summary
2.2. Type Trends
2.3. Application Trends
2.4. End Use Trends
3. Market Overview
3.1. Market segmentation & definitions
3.2. Key takeaways
3.2.1. Top investment pockets
3.2.2. Top winning strategies
3.3. Porter’s five forces analysis
3.3.1. Bargaining power of consumers
3.3.2. Bargaining power of suppliers
3.3.3. Threat of new entrants
3.3.4. Threat of substitutes
3.3.5. Competitive rivalry in the market
3.4. Market dynamics
3.4.1. Drivers
3.4.2. Restraints
3.4.3. Opportunities
3.5. Technology landscape
3.6. Regulatory landscape
3.7. Patent landscape
3.8. Pricing overview
3.8.1. By Type
3.8.2. By Application
3.8.3. By End Use
3.9. Market value chain analysis
3.9.1. Stress point analysis
3.9.2. Raw material analysis
3.9.3. Manufacturing process
3.9.4. Distribution channel analysis
3.9.5. Operating vendors
3.9.5.1. Raw material suppliers
3.9.5.2. Product manufacturers
3.9.5.3. Product distributors
3.10. Strategic overview
4. Aerospace 3D Printing Market, by Type
4.1. Printers
4.1.1. Market size and forecast, by region, 2018-2026
4.1.2. Comparative market share analysis, 2018 & 2026
4.2. Materials
4.2.1. Market size and forecast, by region, 2018-2026
4.2.2. Comparative market share analysis, 2018 & 2026
5. Aerospace 3D Printing Market, by Application
5.1. Engine Component
5.1.1. Market size and forecast, by region, 2018-2026
5.1.2. Comparative market share analysis, 2018 & 2026
5.2. Structural Component
5.2.1. Market size and forecast, by region, 2018-2026
5.2.2. Comparative market share analysis, 2018 & 2026
5.3. Space Component
5.3.1. Market size and forecast, by region, 2018-2026
5.3.2. Comparative market share analysis, 2018 & 2026
6. Aerospace 3D printing Market, by End Use
6.1. UAVs
6.1.1. Market size and forecast, by region, 2018-2026
6.1.2. Comparative market share analysis, 2018 & 2026
6.2. Aircraft
6.2.1. Market size and forecast, by region, 2018-2026
6.2.2. Comparative market share analysis, 2018 & 2026
6.3. Space Craft
6.3.1. Market size and forecast, by region, 2018-2026
6.3.2. Comparative market share analysis, 2018 & 2026
7. Aerospace 3D Printing Market, by Region
7.1. North America
7.1.1. Market size and forecast, by type, 2018-2026
7.1.2. Market size and forecast, by application, 2018-2026
7.1.3. Market size and forecast, by end use, 2018-2026
7.1.4. Market size and forecast, by country, 2018-2026
7.1.5. Comparative market share analysis, 2018 & 2026
7.1.6. U.S.
7.1.6.1. Market size and forecast, by type, 2018-2026
7.1.6.2. Market size and forecast, by application, 2018-2026
7.1.6.3. Market size and forecast, by end use, 2018-2026
7.1.6.4. Comparative market share analysis, 2018 & 2026
7.1.7. Canada
7.1.7.1. Market size and forecast, by type, 2018-2026
7.1.7.2. Market size and forecast, by application, 2018-2026
7.1.7.3. Market size and forecast, by end use, 2018-2026
7.1.7.4. Comparative market share analysis, 2018 & 2026
7.2. Europe
7.2.1. Market size and forecast, by type, 2018-2026
7.2.2. Market size and forecast, by application, 2018-2026
7.2.3. Market size and forecast, by end use, 2018-2026
7.2.4. Market size and forecast, by country, 2018-2026
7.2.5. Comparative market share analysis, 2018 & 2026
7.2.6. Germany
7.2.6.1. Market size and forecast, by type, 2018-2026
7.2.6.2. Market size and forecast, by application, 2018-2026
7.2.6.3. Market size and forecast, by end use, 2018-2026
7.2.6.4. Comparative market share analysis, 2018 & 2026
7.2.7. UK
7.2.7.1. Market size and forecast, by type, 2018-2026
7.2.7.2. Market size and forecast, by application, 2018-2026
7.2.7.3. Market size and forecast, by end use, 2018-2026
7.2.7.4. Comparative market share analysis, 2018 & 2026
7.2.8. France
7.2.8.1. Market size and forecast, by type, 2018-2026
7.2.8.2. Market size and forecast, by application, 2018-2026
7.2.8.3. Market size and forecast, by end use, 2018-2026
7.2.8.4. Comparative market share analysis, 2018 & 2026
7.2.9. Spain
7.2.9.1. Market size and forecast, by type, 2018-2026
7.2.9.2. Market size and forecast, by application, 2018-2026
7.2.9.3. Market size and forecast, by end use, 2018-2026
7.2.9.4. Comparative market share analysis, 2018 & 2026
7.2.10. Italy
7.2.10.1. Market size and forecast, by type, 2018-2026
7.2.10.2. Market size and forecast, by application, 2018-2026
7.2.10.3. Market size and forecast, by end use, 2018-2026
7.2.10.4. Comparative market share analysis, 2018 & 2026
7.2.11. Rest of Europe
7.2.11.1. Market size and forecast, by type, 2018-2026
7.2.11.2. Market size and forecast, by application, 2018-2026
7.2.11.3. Market size and forecast, by end use, 2018-2026
7.2.11.4. Comparative market share analysis, 2018 & 2026
7.3. Asia Pacific
7.3.1. Market size and forecast, by type, 2018-2026
7.3.2. Market size and forecast, by application, 2018-2026
7.3.3. Market size and forecast, by end use, 2018-2026
7.3.4. Market size and forecast, by country, 2018-2026
7.3.5. Comparative market share analysis, 2018 & 2026
7.3.6. China
7.3.6.1. Market size and forecast, by type, 2018-2026
7.3.6.2. Market size and forecast, by application, 2018-2026
7.3.6.3. Market size and forecast, by end use, 2018-2026
7.3.6.4. Comparative market share analysis, 2018 & 2026
7.3.7. India
7.3.7.1. Market size and forecast, by type, 2018-2026
7.3.7.2. Market size and forecast, by application, 2018-2026
7.3.7.3. Market size and forecast, by end use, 2018-2026
7.3.7.4. Comparative market share analysis, 2018 & 2026
7.3.8. Australia
7.3.8.1. Market size and forecast, by type, 2018-2026
7.3.8.2. Market size and forecast, by application, 2018-2026
7.3.8.3. Market size and forecast, by end use, 2018-2026
7.3.8.4. Comparative market share analysis, 2018 & 2026
7.3.9. Rest of Asia Pacific
7.3.9.1. Market size and forecast, by type, 2018-2026
7.3.9.2. Market size and forecast, by application, 2018-2026
7.3.9.3. Market size and forecast, by end use, 2018-2026
7.3.9.4. Comparative market share analysis, 2018 & 2026
7.4. LAMEA
7.4.1. Market size and forecast, by type, 2018-2026
7.4.2. Market size and forecast, by application, 2018-2026
7.4.3. Market size and forecast, by end use, 2018-2026
7.4.4. Market size and forecast, by country, 2018-2026
7.4.5. Comparative market share analysis, 2018 & 2026
7.4.6. Latin America
7.4.6.1. Market size and forecast, by type, 2018-2026
7.4.6.2. Market size and forecast, by application, 2018-2026
7.4.6.3. Market size and forecast, by end use, 2018-2026
7.4.6.4. Comparative market share analysis, 2018 & 2026
7.4.7. Middle East
7.4.7.1. Market size and forecast, by type, 2018-2026
7.4.7.2. Market size and forecast, by application, 2018-2026
7.4.7.3. Market size and forecast, by end use, 2018-2026
7.4.7.4. Comparative market share analysis, 2018 & 2026
7.4.8. Africa
7.4.8.1. Market size and forecast, by type, 2018-2026
7.4.8.2. Market size and forecast, by application, 2018-2026
7.4.8.3. Market size and forecast, by end use, 2018-2026
7.4.8.4. Comparative market share analysis, 2018 & 2026
8. Company Profiles
8.1. Aerojet Rocketdyne
8.1.1. Business overview
8.1.2. Financial performance
8.1.3. Product portfolio
8.1.4. Recent strategic moves & developments
8.1.5. SWOT analysis
8.2. Ultimaker BV
8.2.1. Business overview
8.2.2. Financial performance
8.2.3. Product portfolio
8.2.4. Recent strategic moves & developments
8.2.5. SWOT analysis
8.3. Arcam AB
8.3.1. Business overview
8.3.2. Financial performance
8.3.3. Product portfolio
8.3.4. Recent strategic moves & developments
8.3.5. SWOT analysis
8.4. 3D Systems, Inc.
8.4.1. Business overview
8.4.2. Financial performance
8.4.3. Product portfolio
8.4.4. Recent strategic moves & developments
8.4.5. SWOT analysis
8.5. Höganäs AB
8.5.1. Business overview
8.5.2. Financial performance
8.5.3. Product portfolio
8.5.4. Recent strategic moves & developments
8.5.5. SWOT analysis
8.6. ExOne.
8.6.1. Business overview
8.6.2. Financial performance
8.6.3. Product portfolio
8.6.4. Recent strategic moves & developments
8.6.5. SWOT analysis
8.7. Materialise
8.7.1. Business overview
8.7.2. Financial performance
8.7.3. Product portfolio
8.7.4. Recent strategic moves & developments
8.7.5. SWOT analysis
8.8. EOS GmbH
8.8.1. Business overview
8.8.2. Financial performance
8.8.3. Product portfolio
8.8.4. Recent strategic moves & developments
8.8.5. SWOT analysis
8.9. ENVISIONTEC, INC.
8.9.1. Business overview
8.9.2. Financial performance
8.9.3. Product portfolio
8.9.4. Recent strategic moves & developments
8.9.5. SWOT analysis
8.10. Norsk Titanium US Inc.
8.10.1. Business overview
8.10.2. Financial performance
8.10.3. Product portfolio
8.10.4. Recent strategic moves & developments
8.10.5. SWOT analysis
3D part printing is a new technology that has come up with the prospect of transforming the way companies build new products, including defense and aerospace components. This revolutionary manufacturing process is referred to as 3D printing or additive manufacturing. Rising demand from the aerospace industry for technology capable of producing sophisticated aerospace and shorter supply chain period are key aspects that are likely to drive the aerospace 3D printing business.
However, the need for lightweight parts and components from the aerospace industry is expected to drive the 3D aerospace printing sector. A restricted range of 3D printing raw materials can impede the aerospace 3D printing market. Opportunities such as the introduction of new 3d printing technology needing less production time are projected to fuel the 3D aerospace printing market during the forecast period.
Technologically advanced aircraft are extremely fuel-efficient due to the use of 3D engineered lightweight advanced materials such as engines, sections and the entire airframe, without losing aircraft power and aerodynamics. Content made with 3D printing technology has the potential to work at extreme temperatures. The content classification is expected to be market-driven. This element is likely to drive the 3D aerospace printing business. 3D printing as a business is also anticipated to improve the 3D aerospace printing market.
3D printed UAVs (Unmanned Aerial Systems) are capable of performing rescue operations and monitoring the situation; in which aircraft are capable of inspecting the crisis and reporting to mission control. In fact, NASA is more studying 3D Printing as a service (3DPaaS) for accelerated pre-prototyping. Through 3DPaaS, practitioners may receive alternate design, final product acceptance and peer review principles. Such major developments in aerospace 3D printing are expected to create lucrative opportunities for the global market.
Booming air travel and a major increase in demand for top-selling aircraft, such as B787 and A320, are one of the key factors for aerospace 3D printing market growth. For example, as reported by the managing director of Etihad Aviation Training, Captain Paolo La Cava, air travel is rapidly increasing, as is the demand for aviation professionals and pilots.
Contrarily to this, the higher cost of the part is the main factor that will impede the Aerospace 3D Printing industry. In fact, 3D printing is not yet common in order to work with more products. Certain 3D printing products are not recyclable and food secure.
Aerospace 3D North America's market share in printing is projected to increase by 26.2 per cent to CAGR by generating revenue of $2,284.3 million by 2026. Improvisation in the supply chain The increasing demand for lighter aircraft components is expected to boost demand for 3D printing in the aerospace industry. In turn, the US government's financial support for R&D, along with recent technological advances in 3D printing, would boost the North American demand over the expected timeframe in the area.
Key Companies Profiled
- Ultimaker BV
- 3D Systems, Inc.
- Arcam AB
- ExOne.
- Höganäs AB
- EOS GmbH
- Materialise
- Norsk Titanium US Inc.
- ENVISIONTEC, INC.
- Aerojet Rocketdyne.
Some of the major market participants include: Ultimaker BV, 3D Systems, Inc., Arcam AB, ExOne., Höganäs AB, EOS GmbH, Materialise, Norsk Titanium US Inc., ENVISIONTEC, INC., Aerojet Rocketdyne. Market Players choose inorganic development approaches to extend to local markets. Established market leaders concentrate more on Merger & Acquisition and new product development. These are the common approaches adopted by existing organizations; for example, General Electric aims to produce 25.000 LEAP engine nozzles utilizing 3D printing.
Personalize this research
- Triangulate with your own data
- Request your format and definition
- Get a deeper dive on a specific application, geography, customer or competitor
- + 1-888-961-4454 Toll - Free
- support@researchdive.com
