Toll Free : + 1-888-961-4454 | Int'l : + 91 (788) 802-9103 | support@researchdive.com
EN23028631 |
Pages: 310 |
Feb 2023 |
Automation in combined heat and power systems benefits industries in a variety of ways, including district heating network optimization, steam network optimization, and safety system optimization. In addition, it is utilized to boost plant productivity and requires less labor than the traditional one. Power plants can estimate flue gas emissions thanks to automation, which also helps them react pro-actively and quickly to possible issues. The emphasis on industrial automation and resource efficiency, as well as the use of innovative technology such as IoT and AI in industrial settings, are anticipated to be the main drivers of growth in the global market for combined heat and power automation. In addition, the concept of connected enterprises is emerging, which drives the market growth overall.
However, some of the disadvantages of combined heat power include traditional systems are expensive to maintain than combined heat and electricity systems. This is significant as hybrid systems that produce both heat and power have more moving components than conventional systems. These moving components need to be maintained to prevent things from depreciating. In addition, combined heat power systems require more frequent maintenance due to increased operating temperature compared to standard systems.
Natural gas combustion is a comparatively clean process. Combined heat power may be a highly beneficial technology for facilities that have a consistent need for both heat and electricity, especially if the facility is off the main grid and has easy access to natural gas fuel. The factors such as increased support for natural gas production and related infrastructure, as well as falling natural gas production prices, are likely to boost the natural gas fuel in the combined heat power market. In October 2021, the Chia Hut Combined Heat and Power Plant project in Taiwan began commercial operations. The facility runs on natural gas and features 7HA.02 gas turbines provided by General Electric.
A technology known as a combined heat and power system (CHP) uses a variety of fuels and technologies to create both electrical and thermal energy efficiently. This system recovers lost energy by using the combined heat, which is otherwise wasted, to power plants or buildings that are connected to the energy plant through a stream pipe network. This wasted combined heat is applied to facility loads in the process of combined heating, steam, hot water, or chilled water.
The COVID-19 pandemic brought several uncertainties leading to severe economic losses as various businesses across the world were standstill. This has ultimately lowered the demand for combined heat power due to disruptions in supply chain, closure of manufacturing plants, as well as economic slowdown across several countries. The COVID-19 pandemic had a severe impact on the electronics and semiconductor industries. Owing to rise in the number of COVID-19 cases, business and industrial facilities in several nations were closed and are expected to remain closed in the first quarter of 2022. Furthermore, partial or complete lockdown affected the global supply chain, making it difficult for manufacturers to access their consumers. Owing to the lockdowns across the globe, the market has been experiencing major losses in trade and revenue as a result of the closure of manufacturing facilities. The COVID-19 disease pandemic had a significant impact on the operations of the production and manufacturing sectors, which further hindered the growth of the market for automation in combined heat power.
However, in July 2021, Capstone Green Energy signed a 10-year service and maintenance contract with New York City for 1.2 MWs of microturbines. The 1.2 MW energy efficiency plant on the building is made up of two Capstone C600S microturbines with Capstone's Integrated Heat Recovery Modules. These initiatives are anticipated to drive the combined heat power market size during the forecast period.
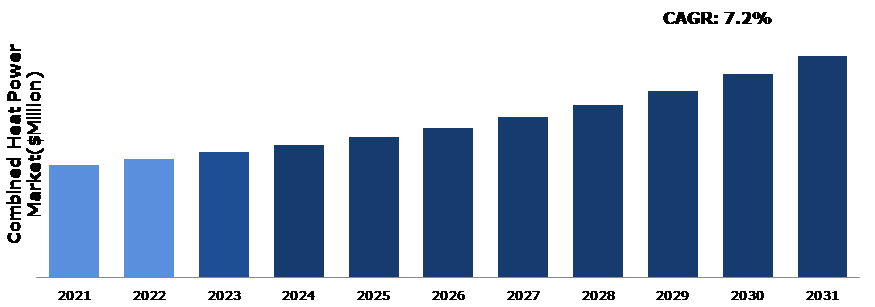
Rise in industrialization and urbanization has augmented the growth of the market. This has increased global electricity demand. Electricity consumption is expected to rise at a 2.1% annual rate until 2040, which is double the rate of primary energy demand. Therefore, demand for combined heat and power (CHP) installation infrastructure is expected to grow in the near future. To meet the rising demand for power, governments in several nations are focusing on renewable energy. This increase in electricity demand is anticipated to drive demand for combined heat power throughout the world. A growth in power consumption is expected to boost the worldwide combined heat power market during the forecast period.
To know more about global combined heat power market drivers, get in touch with our analysts here.
The high initial capital cost of establishing a combined heat power plant is a barrier. Combined heat power facilities require extra equipment in addition to power producing equipment such as prime movers and generator systems. The cost of a traditional combined heat power plant might be over 240% more than the cost of a power production plant with the same capacity and prime mover, posing a significant restriction to the combined heat power market.
A distributed generating system is a fixed or portable system with a capacity of less than 100 MW. Gas turbines are an important component of distributed power generating technology, which also includes reciprocating engines, solar panels with turbines, and fuel cells. Gas turbines have an advantage over other dispersed generation technologies in terms of backup power capacity and onsite generating demands due to their better efficiency and stable generation capacity. The growing popularity of distributed power production provides a significant opportunity for the combined heat and power market.
To know more about global combined heat power market opportunities, get in touch with our analysts here.
By fuel type, the market has been divided into natural gas, coal, biomass, and others. Among these, the natural gas segment accounted for the highest market share in 2021 and it is expected to show the fastest growth during the forecast period.
Source: Research Dive Analysis
The natural gas segment accounted for a dominant market share in 2021 and it is anticipated to show the fastest growth during the forecast period. Natural gas is a useful fuel for CHP systems due to its increased cost and availability. Natural gas is considered as a clean source of energy that helps to reduce carbon emissions. Natural gas is the most often used fuel in CHP technology. Its cost is expected to rise in proportion to other options due to its great efficiency, expanded global manufacturing, and much lower carbon emissions. Governments throughout the world are attempting to increase the number of cleaner fuels in their energy mix, which is anticipated to drive natural gas demand in the coming years. In addition, strict government regulation and targets for carbon fuels, including natural gas, are projected to increase the market share of natural gas as a fuel.
By capacity, the market has been divided into up to 10 MW ,10-150 MW, 151-300 MW, and above 300 MW. Among these, the up to 10 MW segment accounted for the highest market share in 2021 and it is expected to show the fastest growth during the forecast period.
Source: Research Dive Analysis
By capacity, the market has been divided into up to 10 MW, 10-150 MW, 151-300 MW, and above 300 MW. Among these, the up to 10 MW segment accounted for highest revenue share in 2021. Residential combined heat and power systems drive the market growth of combined heat and power systems up to 10 MW. These systems typically range in size from 1.5kW to 0.5MW and run on natural gas. In contrast to other traditional systems, it contributes to reduce energy costs up to 10 MW. Furthermore, the government's micro-CHP fuel cell effort can generate up to 10 MW of power. Unlike reciprocating engines and gas turbines, fuel cells generate power without burning fuel. For instance, AB Holding, 2G Energy, FuelCell Energy, and Capstone frequently offer cogeneration solutions in this power range.
By technology, the market has been categorized into combined cycle, steam turbine, gas turbine, reciprocating engine, and others. Among these, the combined cycle segment accounted for the highest market share in 2021
Source: Research Dive Analysis
The Combined Cycle segment accounted for the dominant market share in 2021. These systems are typically used in industries with high energy demands, such as refining, chemicals, cement, paper, pulp, sugar, and medicines. When compared to other technologies, non-fuel operation, cheap installation & maintenance costs, heat output, start-up time, fuel availability, low pollution, and energy efficiency are all significant advantages.
By application, the market has been segregated into commercial, residential, industrial, and utility. Among these, the industrial segment accounted for the highest market share in 2021.
Source: Research Dive Analysis
The industrial segment accounted for the dominant market share in 2021 and it is anticipated to show the fastest growth during the forecast period. Combined heat power is usually used in energy-intensive industries such as refining, chemicals, cement, paper & pulp, sugar, and pharmaceuticals. Combined heat power installation in industrial applications has several advantages, including non-fuel operation, inexpensive installation and maintenance costs, heat output, fuel availability, minimal emissions, and energy efficiency.
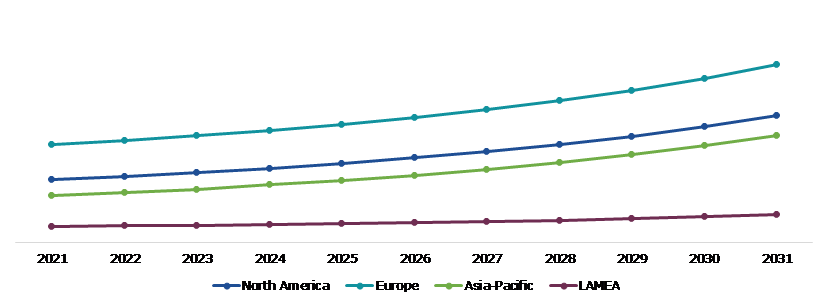
The combined heat power market was investigated across North America, Europe, Asia-Pacific, and LAMEA.
Source: Research Dive Analysis
The Asia-Pacific market accounted a dominating market share in 2021. Rising demand for district energy (heating) and cooling systems under moving climatic conditions alongside continuous mechanical developments is boosting the demand. Inferable from fuel adaptability are the significant variables supplementing the territorial standpoint of the combined heat power market. In addition, the European market is aided by tremendous carbon reduction goals by the provincial specialists, as stated by the European Commission. The broad scope of empowering sustainable arrangement destinations and energy security strategies animating interest for combined heat power. The market growth in this region is attributed to the increasing awareness of the impact of human activities on the environment and fluctuating prices of traditional fuels used for power & heat generation in the region.
Investment and agreement are common strategies followed by major market players. For instance, in February 2021, Wärtsilä secured a contract from Kraftwerke Mainz-Wiesbaden to deliver a 100 MW CHP plant, which would feed the excess heat generated during power generation into the Mainz district heating network, providing around 40,000 modern single-family homes.
Source: Research Dive Analysis
Some of the leading combined heat power market players are MAN Diesel & Turbo SE, Caterpillar Inc., Mitsubishi heavy Industries ltd., General Electric, Cummins, Bosch Thermotechnology Ltd., ABB Limited, ENER-G Rudox, and Veolia.
| Aspect | Particulars |
| Historical Market Estimations | 2020 |
| Base Year for Market Estimation | 2021 |
| Forecast Timeline for Market Projection | 2022-2031 |
| Geographical Scope | North America, Europe, Asia-Pacific, LAMEA |
| Segmentation by Fuel Type |
|
| Segmentation by Capacity |
|
| Segmentation by Technology |
|
| Segmentation by Application |
|
| Key Companies Profiled |
|
1.Research Methodology
1.1.Desk Research
1.2.Real time insights and validation
1.3.Forecast model
1.4.Assumptions and forecast parameters
1.5.Market size estimation
1.5.1.Top-down approach
1.5.2.Bottom-up approach
2.Report Scope
2.1.Market definition
2.2.Key objectives of the study
2.3.Report overview
2.4.Market segmentation
2.5.Overview of the impact of COVID-19 on Global combined heat power market
3.Executive Summary
4.Market Overview
4.1.Introduction
4.2.Growth impact forces
4.2.1.Drivers
4.2.2.Restraints
4.2.3.Opportunities
4.3.Market value chain analysis
4.3.1.List of raw material suppliers
4.3.2.List of manufacturers
4.3.3.List of distributors
4.4.Innovation & sustainability matrices
4.4.1.Technology matrix
4.4.2.Regulatory matrix
4.5.Porter’s five forces analysis
4.5.1.Bargaining power of suppliers
4.5.2.Bargaining power of consumers
4.5.3.Threat of substitutes
4.5.4.Threat of new entrants
4.5.5.Competitive rivalry intensity
4.6.PESTLE analysis
4.6.1.Political
4.6.2.Economical
4.6.3.Social
4.6.4.Technological
4.6.5.Environmental
4.7.Impact of COVID-19 on global combined heat power market
4.7.1.Pre-covid market scenario
4.7.2.Post-covid market scenario
5.Combined Heat Power Market Analysis, by Fuel Type
5.1.Overview
5.2.Natural Gas
5.2.1.Definition, key trends, growth factors, and opportunities
5.2.2.Market size analysis, by region,2022-2031
5.2.3.Market share analysis, by country,2022-2031
5.3.Coal
5.3.1.Definition, key trends, growth factors, and opportunities
5.3.2.Market size analysis, by region,2022-2031
5.3.3.Market share analysis, by country,2022-2031
5.4.Biomass
5.4.1.Definition, key trends, growth factors, and opportunities
5.4.2.Market size analysis, by region,2022-2031
5.4.3.Market share analysis, by country,2022-2031
5.5.Others
5.5.1.Definition, key trends, growth factors, and opportunities
5.5.2.Market size analysis, by region,2022-2031
5.5.3.Market share analysis, by country,2022-2031
5.6.Research Dive Exclusive Insights
5.6.1.Market attractiveness
5.6.2.Competition heatmap
6.Combined Heat Power Market, by Capacity
6.1.Overview
6.2.Up to 10 MW
6.2.1.Definition, key trends, growth factors, and opportunities
6.2.2.Market size analysis, by region,2022-2031
6.2.3.Market share analysis, by country,2022-2031
6.3.10-150 MW
6.3.1.Definition, key trends, growth factors, and opportunities
6.3.2.Market size analysis, by region,2022-2031
6.3.3.Market share analysis, by country,2022-2031
6.4.151-300 MW
6.4.1.Definition, key trends, growth factors, and opportunities
6.4.2.Market size analysis, by region,2022-2031
6.4.3.Market share analysis, by country,2022-2031
6.5.Above 300 MW
6.5.1.Definition, key trends, growth factors, and opportunities
6.5.2.Market size analysis, by region,2022-2031
6.5.3.Market share analysis, by country,2022-2031
6.6.Research Dive Exclusive Insights
6.6.1.Market attractiveness
6.6.2.Competition heatmap
7.Combined Heat Power Market, by Technology
7.1.Overview
7.2.Combined Cycle
7.2.1.Definition, key trends, growth factors, and opportunities
7.2.2.Market size analysis, by region,2022-2031
7.2.3.Market share analysis, by country,2022-2031
7.3.Steam Turbine
7.3.1.Definition, key trends, growth factors, and opportunities
7.3.2.Market size analysis, by region,2022-2031
7.3.3.Market share analysis, by country,2022-2031
7.4.Gas Turbine
7.4.1.Definition, key trends, growth factors, and opportunities
7.4.2.Market size analysis, by region,2022-2031
7.4.3.Market share analysis, by country,2022-2031
7.5.Reciprocating Engine
7.5.1.Definition, key trends, growth factors, and opportunities
7.5.2.Market size analysis, by region,2022-2031
7.5.3.Market share analysis, by country,2022-2031
7.6.Others
7.6.1.Definition, key trends, growth factors, and opportunities
7.6.2.Market size analysis, by region,2022-2031
7.6.3.Market share analysis, by country,2022-2031
7.7.Research Dive Exclusive Insights
7.7.1.Market attractiveness
7.7.2.Competition heatmap
8.Combined Heat Power Market, by Application
8.1.Overview
8.2.Commercial
8.2.1.Definition, key trends, growth factors, and opportunities
8.2.2.Market size analysis, by region,2022-2031
8.2.3.Market share analysis, by country,2022-2031
8.3.Residential
8.3.1.Definition, key trends, growth factors, and opportunities
8.3.2.Market size analysis, by region,2022-2031
8.3.3.Market share analysis, by country,2022-2031
8.4.Industrial
8.4.1.Definition, key trends, growth factors, and opportunities
8.4.2.Market size analysis, by region,2022-2031
8.4.3.Market share analysis, by country,2022-2031
8.5.Utility
8.5.1.Definition, key trends, growth factors, and opportunities
8.5.2.Market size analysis, by region,2022-2031
8.5.3.Market share analysis, by country,2022-2031
8.6.Research Dive Exclusive Insights
8.6.1.Market attractiveness
8.6.2.Competition heatmap
9.Combined Heat Power Market, by Region
9.1.North America
9.1.1.U.S.
9.1.1.1.Market size analysis, by Fuel Type,2022-2031
9.1.1.2.Market size analysis, by Capacity,2022-2031
9.1.1.3.Market size analysis, by Technology,2022-2031
9.1.1.4.Market size analysis, by Application,2022-2031
9.1.2.Canada
9.1.2.1.Market size analysis, by Fuel Type,2022-2031
9.1.2.2.Market size analysis, by Capacity,2022-2031
9.1.2.3.Market size analysis, by Technology,2022-2031
9.1.2.4.Market size analysis, by Application,2022-2031
9.1.3.Mexico
9.1.3.1.Market size analysis, by Fuel Type,2022-2031
9.1.3.2.Market size analysis, by Capacity,2022-2031
9.1.3.3.Market size analysis, by Technology,2022-2031
9.1.3.4.Market size analysis, by Application,2022-2031
9.1.4.Research Dive Exclusive Insights
9.1.4.1.Market attractiveness
9.1.4.2.Competition heatmap
9.2.Europe
9.2.1.Germany
9.2.1.1.Market size analysis, by Fuel Type,2022-2031
9.2.1.2.Market size analysis, by Capacity,2022-2031
9.2.1.3.Market size analysis, by Technology,2022-2031
9.2.1.4.Market size analysis, by Application,2022-2031
9.2.2.U.K.
9.2.2.1.Market size analysis, by Fuel Type,2022-2031
9.2.2.2.Market size analysis, by Capacity,2022-2031
9.2.2.3.Market size analysis, by Technology,2022-2031
9.2.2.4.Market size analysis, by Application,2022-2031
9.2.3.France
9.2.3.1.Market size analysis, by Fuel Type,2022-2031
9.2.3.2.Market size analysis, by Capacity,2022-2031
9.2.3.3.Market size analysis, by Technology,2022-2031
9.2.3.4.Market size analysis, by Application,2022-2031
9.2.4.Spain
9.2.4.1.Market size analysis, by Fuel Type,2022-2031
9.2.4.2.Market size analysis, by Capacity,2022-2031
9.2.4.3.Market size analysis, by Technology,2022-2031
9.2.4.4.Market size analysis, by Application,2022-2031
9.2.5.Italy
9.2.5.1.Market size analysis, by Fuel Type,2022-2031
9.2.5.2.Market size analysis, by Capacity,2022-2031
9.2.5.3.Market size analysis, by Technology,2022-2031
9.2.5.4.Market size analysis, by Application,2022-2031
9.2.6.Rest of Europe
9.2.6.1.Market size analysis, by Fuel Type,2022-2031
9.2.6.2.Market size analysis, by Capacity,2022-2031
9.2.6.3.Market size analysis, by Technology,2022-2031
9.2.6.4.Market size analysis, by Application,2022-2031
9.2.7.Research Dive Exclusive Insights
9.2.7.1.Market attractiveness
9.2.7.2.Competition heatmap
9.3.Asia-Pacific
9.3.1.China
9.3.1.1.Market size analysis, by Fuel Type,2022-2031
9.3.1.2.Market size analysis, by Capacity,2022-2031
9.3.1.3.Market size analysis, by Technology,2022-2031
9.3.1.4.Market size analysis, by Application,2022-2031
9.3.2.Japan
9.3.2.1.Market size analysis, by Fuel Type,2022-2031
9.3.2.2.Market size analysis, by Capacity,2022-2031
9.3.2.3.Market size analysis, by Technology,2022-2031
9.3.2.4.Market size analysis, by Application,2022-2031
9.3.3.India
9.3.3.1.Market size analysis, by Fuel Type,2022-2031
9.3.3.2.Market size analysis, by Capacity,2022-2031
9.3.3.3.Market size analysis, by Technology,2022-2031
9.3.3.4.Market size analysis, by Application,2022-2031
9.3.4.Australia
9.3.4.1.Market size analysis, by Fuel Type,2022-2031
9.3.4.2.Market size analysis, by Capacity,2022-2031
9.3.4.3.Market size analysis, by Technology,2022-2031
9.3.4.4.Market size analysis, by Application,2022-2031
9.3.5.South Korea
9.3.5.1.Market size analysis, by Fuel Type,2022-2031
9.3.5.2.Market size analysis, by Capacity,2022-2031
9.3.5.3.Market size analysis, by Technology,2022-2031
9.3.5.4.Market size analysis, by Application,2022-2031
9.3.6.Rest of Asia Pacific
9.3.6.1.Market size analysis, by Fuel Type,2022-2031
9.3.6.2.Market size analysis, by Capacity,2022-2031
9.3.6.3.Market size analysis, by Technology,2022-2031
9.3.6.4.Market size analysis, by Application,2022-2031
9.3.7.Research Dive Exclusive Insights
9.3.7.1.Market attractiveness
9.3.7.2.Competition heatmap
9.4.LAMEA
9.4.1.Brazil
9.4.1.1.Market size analysis, by Fuel Type,2022-2031
9.4.1.2.Market size analysis, by Capacity,2022-2031
9.4.1.3.Market size analysis, by Technology,2022-2031
9.4.1.4.Market size analysis, by Application,2022-2031
9.4.2.Saudi Arabia
9.4.2.1.Market size analysis, by Fuel Type,2022-2031
9.4.2.2.Market size analysis, by Capacity,2022-2031
9.4.2.3.Market size analysis, by Technology,2022-2031
9.4.2.4.Market size analysis, by Application,2022-2031
9.4.3.UAE
9.4.3.1.Market size analysis, by Fuel Type,2022-2031
9.4.3.2.Market size analysis, by Capacity,2022-2031
9.4.3.3.Market size analysis, by Technology,2022-2031
9.4.3.4.Market size analysis, by Application,2022-2031
9.4.4.South Africa
9.4.4.1.Market size analysis, by Fuel Type,2022-2031
9.4.4.2.Market size analysis, by Capacity,2022-2031
9.4.4.3.Market size analysis, by Technology,2022-2031
9.4.4.4.Market size analysis, by Application,2022-2031
9.4.5.Rest of LAMEA
9.4.5.1.Market size analysis, by Fuel Type,2022-2031
9.4.5.2.Market size analysis, by Capacity,2022-2031
9.4.5.3.Market size analysis, by Technology,2022-2031
9.4.5.4.Market size analysis, by Application,2022-2031
9.4.6.Research Dive Exclusive Insights
9.4.6.1.Market attractiveness
9.4.6.2.Competition heatmap
10.Competitive Landscape
10.1.Top winning strategies, 2022
10.1.1.By strategy
10.1.2.By year
10.2.Strategic overview
10.3.Market share analysis, 2022
11.Company Profiles
11.1.MAN Diesel & Turbo SE
11.1.1.Overview
11.1.2.Business segments
11.1.3.Product portfolio
11.1.4.Financial performance
11.1.5.Recent developments
11.1.6.SWOT analysis
11.2.Caterpillar Inc.
11.2.1.Overview
11.2.2.Business segments
11.2.3.Product portfolio
11.2.4.Financial performance
11.2.5.Recent developments
11.2.6.SWOT analysis
11.3.Mitsubishi heavy Industries ltd.
11.3.1.Overview
11.3.2.Business segments
11.3.3.Product portfolio
11.3.4.Financial performance
11.3.5.Recent developments
11.3.6.SWOT analysis
11.4.General Electric
11.4.1.Overview
11.4.2.Business segments
11.4.3.Product portfolio
11.4.4.Financial performance
11.4.5.Recent developments
11.4.6.SWOT analysis
11.5.Cummins
11.5.1.Overview
11.5.2.Business segments
11.5.3.Product portfolio
11.5.4.Financial performance
11.5.5.Recent developments
11.5.6.SWOT analysis
11.6.Bosch Thermotechnology Ltd.
11.6.1.Overview
11.6.2.Business segments
11.6.3.Product portfolio
11.6.4.Financial performance
11.6.5.Recent developments
11.6.6.SWOT analysis
11.7.ABB Limited
11.7.1.Overview
11.7.2.Business segments
11.7.3.Product portfolio
11.7.4.Financial performance
11.7.5.Recent developments
11.7.6.SWOT analysis
11.8.ENER-G Rudox
11.8.1.Overview
11.8.2.Business segments
11.8.3.Product portfolio
11.8.4.Financial performance
11.8.5.Recent developments
11.8.6.SWOT analysis
11.9.Veolia
11.9.1.Overview
11.9.2.Business segments
11.9.3.Product portfolio
11.9.4.Financial performance
11.9.5.Recent developments
11.9.6.SWOT analysis
12.Appendix
12.1.Parent & peer market analysis
12.2.Premium insights from industry experts
12.3.Related reports
* Taxes/Fees, If applicable will be added during checkout. All prices in USD.
Have a question ?
Enquire To BuyNeed to add more ?
Request Customization