Toll Free : + 1-888-961-4454 | Int'l : + 91 (788) 802-9103 | support@researchdive.com
EN23028615 |
Pages: 230 |
Feb 2023 |
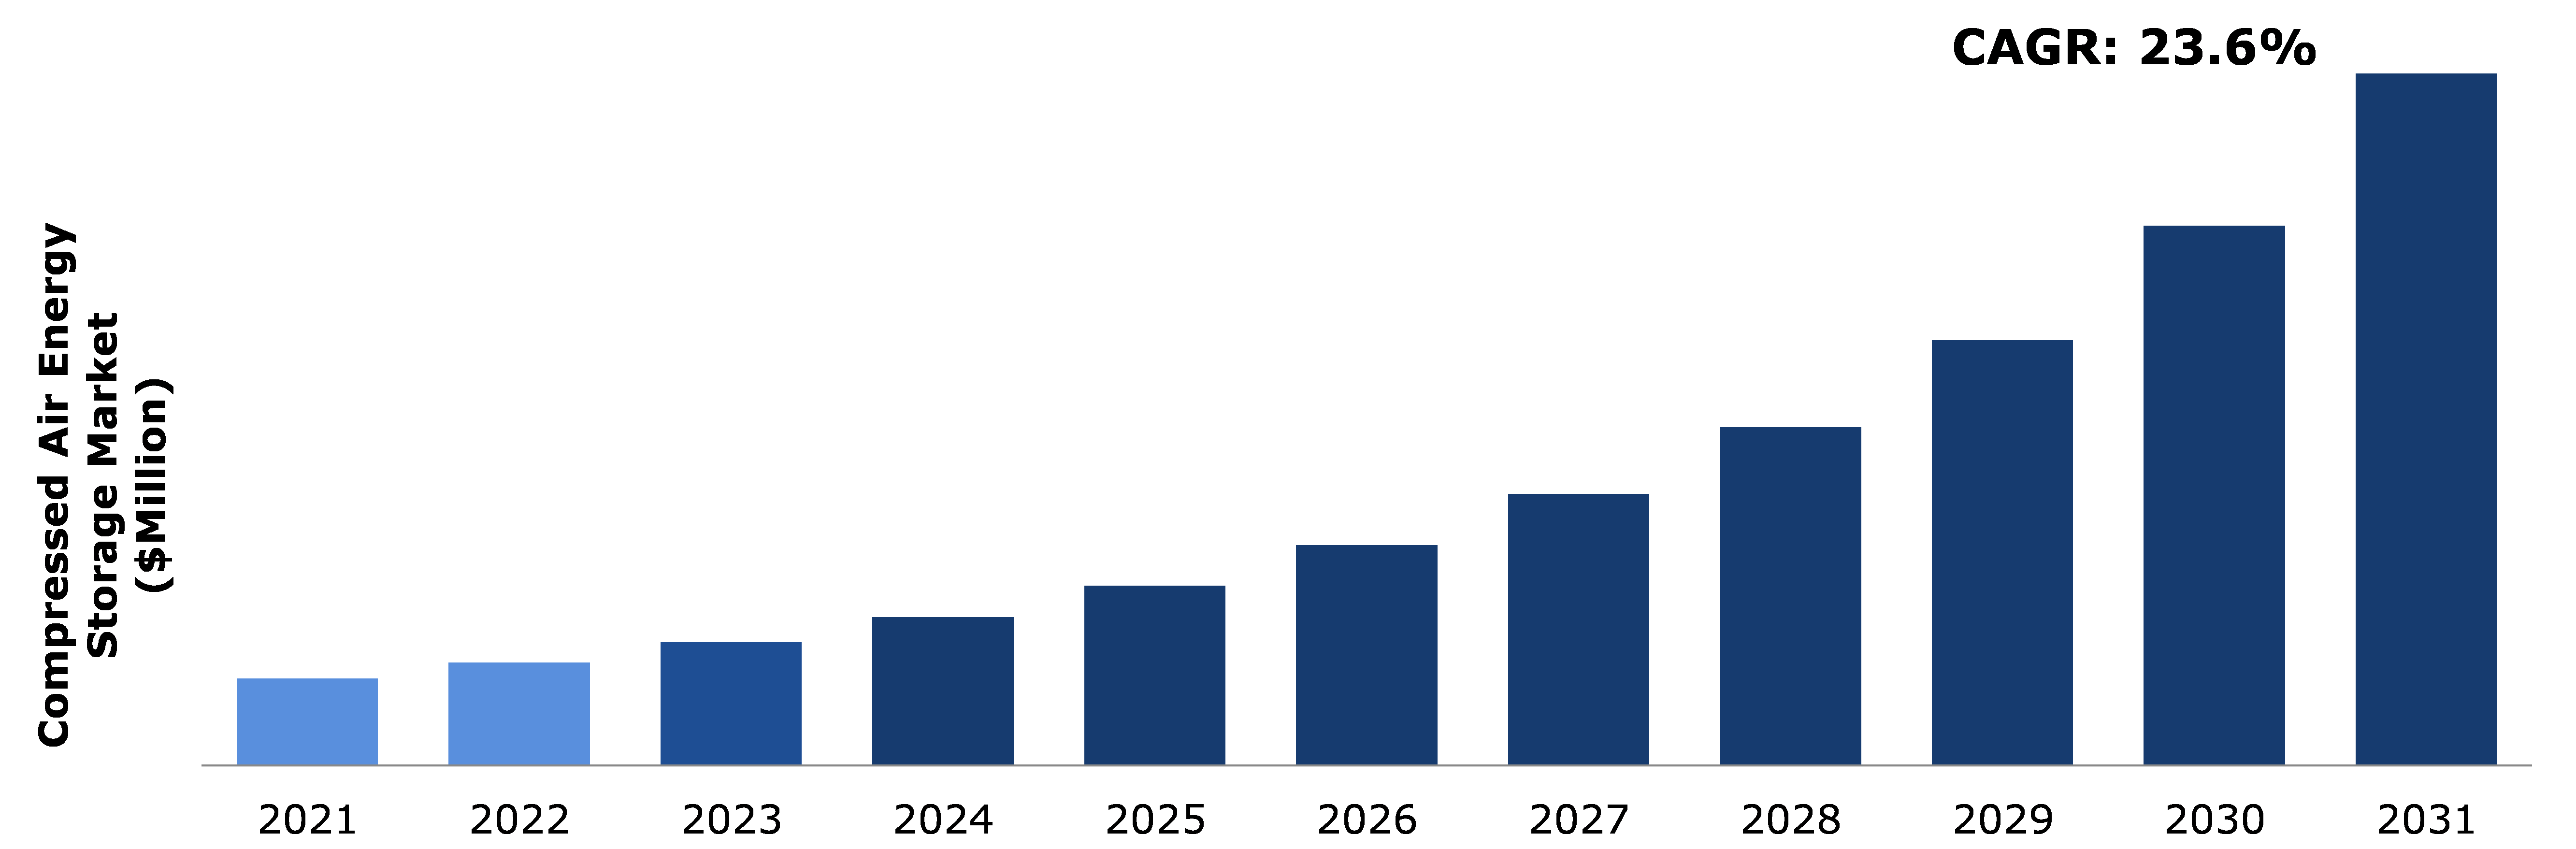
Compressed air energy storage (CAES) is an efficient energy storage technology in which the energy stored at one time can be used at another time. This technology can be widely used during off-peak and can be used to meet high energy demand during the peak load period. Compresses air energy storage market size can be attributed to the ability of CAES systems that offers effective and on-demand energy for its use across various industries such as power generation.
However, high cost involved in setting up compressed air energy storage plants is estimated to restrain the compressed air energy storage market share in the upcoming years. The cost involved in CAES comprises of complicated cooling systems, high self-discharge rate, and high cost involved in setting up underground storage intercoolers for dissipating heat.
The benefits associated with compressed air energy storage industry is projected to generate excellent opportunities in the market. The CAES technology offers excellent energy savings as it is used to enhance energy storage during peak periods. This technology helps the energy companies in offering sufficient energy for entire service for energy production during peak usage. These factors are anticipated to have positive impact on compressed air energy storage market outlook in the upcoming years.
According to regional analysis, the North America compressed air energy storage market accounted for a highest market share for compressed air energy storage majorly owing to the growing prevalence of parties and events across U.S., Canada, and Mexico.
Compressed air energy storage technology can be used for large-scale energy storage in which the compressed air is stored in pressurized storage tanks or in underground caverns. Additionally, the pressurized air is pumped into an enclosure with the help of a compressor, till the energy is utilized. The stored energy is then utilized that allows the air to expand by pushing the high-pressure air through the air for generating electricity.
The impact of the COVID-19 pandemic has rippled through several industries causing social, economic, as well as political disruptions. The compressed air energy storage market demand was also negatively impacted during the pandemic. This was majorly owing to travel restrictions, and stay-at-home orders. The suspension of manufacturing and production plants due to shortage of labors, delay in the availability of raw materials has led to a negative impact on the compressed air energy storage market opportunities during the pandemic. The shipments of various components, such as pistons, electric motors, storage tanks, and others, involved in setting up CAES plants was delayed. This was majorly owing to the import-export restrictions, closed borders, and economic uncertainty. CAES technology requires huge capital investments, and it is governed by several government norms and regulations.
The healthcare facilities across the world had collapsed owing to drastic increase in the number of patients suffering from the novel coronavirus. Owing to the same, majority of government budgets were diverted towards strengthening of healthcare facilities across the world. Hence, the setup of CAES plants was temporarily halted or postponed. All these factors have negatively impacted the compressed air energy storage market growth during the pandemic.
The global compressed air energy storage market provides enhanced air quality by lowering harmful carbon dioxide emissions. For instance, using adiabatic CAES, processes the carbon emissions can be reduced to zero. This helps in reducing the dependence on fossil-fuel powered energy grids. Hence, compressed air energy storage is an eco-friendly energy storage solution that can help in achieving net zero carbon emission goals. The use of CAES as supplemental energy storage offers power grid stability during the peak times of electricity use. This minimizes the load on electrical infrastructure thereby enhancing the energy reliability. Even for small-scale operations, this technology provides reliable and stable electricity production option. These factors are anticipated to propel the compressed air energy storage market size in the coming years.
To know more about global compressed air energy storage market drivers, get in touch with our analysts here.
Some of the limitations associated with CAES system is extensive use of natural gas required for heating up air during the expansion stage. Also, compared to pumped hydrogen storage technology, the CAES has low efficiency. Furthermore pumped-hydro storage is a well-established technology with numerous systems worldwide. These have a large storage capacity, making them suitable for wind energy applications; however, their main drawbacks are the high capital cost and the possibility of water loss due to evaporation. These factors are anticipated to restrain the market growth in the coming years.
The demand for sustainable energy that helps in reducing the emission of harmful greenhouse gases is increasing across the world. Rising global population and urbanization has led to manifold rise in the energy demand. This has led to an increase in demand for power generation plants and necessary infrastructure. The compressed air energy storage system helps in meeting the growing energy demand as it has untapped potential in renewable energy generation. Also, in CAES systems the compressed air is stored, due to which the compressor does not have to run frequently. This increases the service life of compressor and reduces overall wear of compressor. These factors are anticipated to generate excellent opportunities to boost the market growth.
To know more about global compressed air energy storage market opportunities, get in touch with our analysts here.
Based on method, the market has been divided into diabatic, adiabatic, and isothermal. Out of these, the isothermal sub-segment accounted for a dominant market share in 2021 and it is anticipated to show the fastest growth during the analysis period.
Source: Research Dive Analysis
The isothermal method accounted for the highest market size during the 2021. The isothermal method of compressed air energy storage market is an emerging technology that helps in addressing the limitations associated with traditional diabatic and adiabatic methods. Some of the benefits associated CAES is that it allows double the air compression compared to adiabatic CAES. This helps in reducing the cost of CAES system by about one-seventh compared to that of traditional CAES methods. Also, the round-trip efficiency of isothermal CAES is estimated to reach 100% theoretically, with the practical limit estimated to be 80%. This is higher compared to diabatic and adiabatic CAES methods. These factors are projected to generate favorable opportunities for isothermal CAES method in the forecast period.
Based on storage the analysis has been divided into traditional CAES storage and liquid gas CAES storage. The traditional CAES storage sub-segment accounted for a dominant market share and liquid gas CAES storage sub-segment is anticipated to show the fastest growth by 2031.
Source: Research Dive Analysis
The traditional CAES storage sub-segment of the global compressed air energy storage accounted for the highest market size in 2021. The traditional CAES storage method is widely used as it is cost efficient and a reliable storage option. In this storage method, the compressed air is stored in large underground sealed caverns. The operational efficiency of traditional CAES method is high owing to which it is quite popular. These factors are projected to drive the traditional CAES storage popularity in the upcoming years.
The liquid gas CAES storage sub-segment of the global compressed air energy storage is anticipated to have fastest growth by 2031. The liquid gas CAES storage is gaining huge popularity as it uses electricity to cool air until it liquifies. This technology then stores liquid air into the tank and the liquid air is converted back into the gaseous state by exposing it to the ambient air. This gas is then used for driving the motor turbines to generate electricity. This technology involves low risk as the compressed air is generated at a very low-temperatures.
Based on application, the market has been divided into energy management, backup & seasonal reserves, and renewable integration. Among these, energy management was a dominant sub-segment in 2021, and it is projected to show the fastest growth in the global market.
Source: Research Dive Analysis
The energy management sub-segment accounted for a dominant market share in 2021. The compressed air energy storage facilitates robust energy management solutions with integrated storage technologies that can drive the future of sustainable energy storage systems. Compressed air energy storage systems are reliable and readily available that can meet the higher energy demands of the energy management sector. Also, these plants can meet the variable demands of the energy management sector owing to variable size of cavern storage, volume, and pressure.
Source: Research Dive Analysis
The power station sub-segment accounted for the dominant market share in 2021. The compressed air energy storage market holds huge potential for its use at power stations that help in reducing the dependance on fossil-fuel based energy. At large power stations the CAES can be used for varying applications involving peak shaving, load shifting, voltage & frequency control. It can be used at renewable energy stations such as wind power plants for smooth power output. These factors are anticipated to boost the power station market share in the upcoming years.
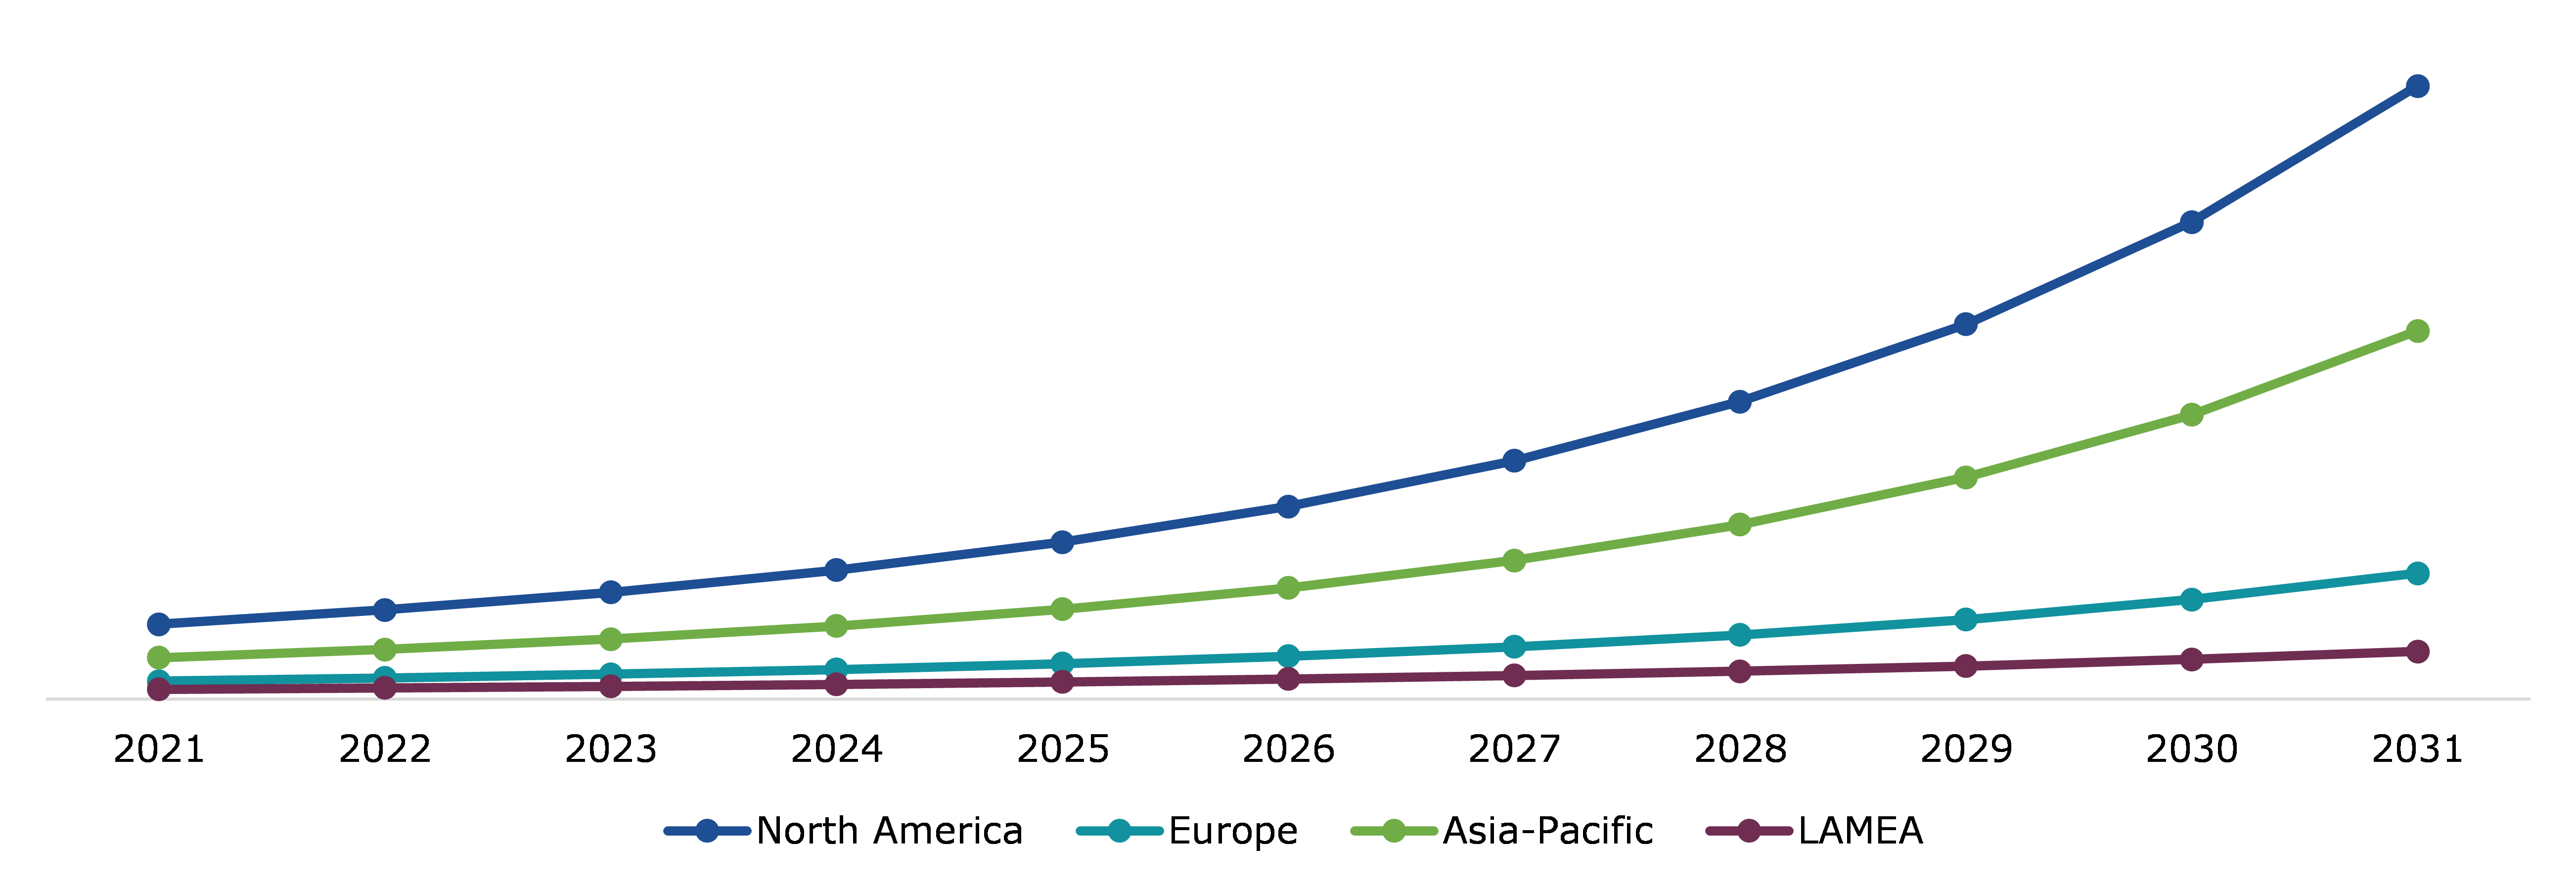
The compressed air energy storage market analysis was investigated across North America, Europe, Asia-Pacific, and LAMEA.
Source: Research Dive Analysis
North America compressed air energy storage market registered the highest market size in 2021. The demand for compressed air energy storage in the U.S. is driven by California’s mandate of meeting 50% of the state electricity demand with the use of renewable energy generation sources such as solar and wind power plants by 2030. Owing to such initiatives, the region is already ahead in installing and meeting the growing energy demand with the use of renewable power plants such as CAES systems. CAES holds significant potential in meeting the energy demands by reducing the need of fossil-fuel based energy generation with the help of reliable, efficient CAES systems. In April 2021, Hydrostor Inc., the Canada-based company involved in setting up CAES plants have announced the ambitious plans to build advanced CAES facility in Rosamond, California. Hence, California is set to become home for two new CAES facilities which will be the world’s largest non-hydro energy storage systems. These factors are anticipated to boost the North America compressed air energy storage market growth during the projected timeframe.
The share of the Asia-Pacific compressed air energy storage market is anticipated to grow at the fastest rate during the forecast period. The Asia-Pacific countries namely India, China, Japan, and other are constantly evaluating feasible energy storage and energy generation technologies to achieve climate sustainability goals. In September 2022, the world’s biggest 100-MW advanced CAES plant was connected to power generation grid in the China’s Hebei province which is ready for its commercial operations. This plant can produce more than 132 million kWh electricity and it is developed by Institute of Engineering Thermophysics (IET), China. These factors are anticipated to have a positive impact on the compressed air energy storage market opportunities in the Asia-Pacific region.
Business expansions, partnerships, and investments are common strategies followed by major market players. For instance, in April 2022, Canada Pension Plan (CPP) Investment Board have announced an investment of US$ 25 million for Hydrostor Inc. the leading energy storage provider company. This investment will help Hydrostor in development advanced compressed air energy storage systems.
Source: Research Dive Analysis
Some of the leading compressed air energy storage market players are Siemens Energy AG, General Compression Ltd (GCL), Hydrostor Inc., Bright Energy Storage Technologies, Pacific Gas and Electric Company, Apex Compressed Air Energy Storage, LLC, Ridge Energy Storage and Grid Services LP, ALACAES, Storelectric Limited, and LightSail Energy.
| Aspect | Particulars |
| Historical Market Estimations | 2020 |
| Base Year for Market Estimation | 2021 |
| Forecast Timeline for Market Projection | 2022-2031 |
| Geographical Scope | North America, Europe, Asia-Pacific, and LAMEA |
| Segmentation by Method |
|
| Segmentation by Storage |
|
| Segmentation by Application |
|
| Segmentation by End-use Industry |
|
| Key Companies Profiled |
|
1.Research Methodology
1.1.Desk Research
1.2.Real time insights and validation
1.3.Forecast model
1.4.Assumptions and forecast parameters
1.5.Market size estimation
1.5.1.Top-down approach
1.5.2.Bottom-up approach
2.Report Scope
2.1.Market definition
2.2.Key objectives of the study
2.3.Report overview
2.4.Market segmentation
2.5.Overview of the impact of COVID-19 on Global compressed air energy storage market
3.Executive Summary
4.Market Overview
4.1.Introduction
4.2.Growth impact forces
4.2.1.Drivers
4.2.2.Restraints
4.2.3.Opportunities
4.3.Market value chain analysis
4.3.1.List of component providers
4.3.2.List of manufacturers
4.3.3.List of distributors
4.4.Innovation & sustainability matrices
4.4.1.Technology matrix
4.4.2.Regulatory matrix
4.5.Porter’s five forces analysis
4.5.1.Bargaining power of suppliers
4.5.2.Bargaining power of consumers
4.5.3.Threat of substitutes
4.5.4.Threat of new entrants
4.5.5.Competitive rivalry intensity
4.6.PESTLE analysis
4.6.1.Political
4.6.2.Economical
4.6.3.Social
4.6.4.Technological
4.6.5.Environmental
4.7.Impact of COVID-19 on Compressed air energy storage market
4.7.1.Pre-covid market scenario
4.7.2.Post-covid market scenario
5.Compressed Air Energy Storage Market Analysis, by Method
5.1.Overview
5.2.Diabatic
5.2.1.Definition, key trends, growth factors, and opportunities
5.2.2.Market size analysis, by region, 2022-2031
5.2.3.Market share analysis, by country, 2022-2031
5.3.Adiabatic
5.3.1.Definition, key trends, growth factors, and opportunities
5.3.2.Market size analysis, by region, 2022-2031
5.3.3.Market share analysis, by country, 2022-2031
5.4.Isothermal
5.4.1.Definition, key trends, growth factors, and opportunities
5.4.2.Market size analysis, by region, 2022-2031
5.4.3.Market share analysis, by country, 2022-2031
5.5.Research Dive Exclusive Insights
5.5.1.Market attractiveness
5.5.2.Competition heatmap
6.Compressed Air Energy Storage Market Analysis, by Storage
6.1.Overview
6.2.Traditional CAES Storage
6.2.1.Definition, key trends, growth factors, and opportunities
6.2.2.Market size analysis, by region, 2022-2031
6.2.3.Market share analysis, by country, 2022-2031
6.3.Liquid Gas CAES Storage
6.3.1.Definition, key trends, growth factors, and opportunities
6.3.2.Market size analysis, by region, 2022-2031
6.3.3.Market share analysis, by country, 2022-2031
6.4.Research Dive Exclusive Insights
6.4.1.Market attractiveness
6.4.2.Competition heatmap
7. Compressed Air Energy Storage Market Analysis, by Application
7.1.Overview
7.2.Energy Management
7.2.1.Definition, key trends, growth factors, and opportunities
7.2.2.Market size analysis, by region, 2022-2031
7.2.3.Market share analysis, by country, 2022-2031
7.3.Backup and Seasonal Reserves
7.3.1.Definition, key trends, growth factors, and opportunities
7.3.2.Market size analysis, by region, 2022-2031
7.3.3.Market share analysis, by country, 2022-2031
7.4.Renewable Integration
7.4.1.Definition, key trends, growth factors, and opportunities
7.4.2.Market size analysis, by region, 2022-2031
7.4.3.Market share analysis, by country, 2022-2031
7.5.Research Dive Exclusive Insights
7.5.1.Market attractiveness
7.5.2.Competition heatmap
8.Compressed Air Energy Storage Market Analysis, by End-use Industry
8.1.Overview
8.2.Power Station
8.2.1.Definition, key trends, growth factors, and opportunities
8.2.2.Market size analysis, by region, 2022-2031
8.2.3.Market share analysis, by country, 2022-2031
8.3.Distributed Energy System
8.3.1.Definition, key trends, growth factors, and opportunities
8.3.2.Market size analysis, by region, 2022-2031
8.3.3.Market share analysis, by country, 2022-2031
8.4.Automotive Power
8.4.1.Definition, key trends, growth factors, and opportunities
8.4.2.Market size analysis, by region, 2022-2031
8.4.3.Market share analysis, by country, 2022-2031
8.5.Research Dive Exclusive Insights
8.5.1.Market attractiveness
8.5.2.Competition heatmap
9.Compressed Air Energy Storage Market, by Region
9.1.North America
9.1.1.U.S.
9.1.1.1.Market size analysis, by Method, 2022-2031
9.1.1.2.Market size analysis, by Storage, 2022-2031
9.1.1.3.Market size analysis, by Application, 2022-2031
9.1.1.4.Market size analysis, by End-Use Industry, 2022-2031
9.1.2.Canada
9.1.2.1.Market size analysis, by Method, 2022-2031
9.1.2.2.Market size analysis, by Storage, 2022-2031
9.1.2.3.Market size analysis, by Application, 2022-2031
9.1.2.4.Market size analysis, by End-Use Industry, 2022-2031
9.1.3.Mexico
9.1.3.1.Market size analysis, by Method, 2022-2031
9.1.3.2.Market size analysis, by Storage, 2022-2031
9.1.3.3.Market size analysis, by Application, 2022-2031
9.1.3.4.Market size analysis, by End-Use Industry, 2022-2031
9.1.4.Research Dive Exclusive Insights
9.1.4.1.Market attractiveness
9.1.4.2.Competition heatmap
9.2.Europe
9.2.1.Germany
9.2.1.1.Market size analysis, by Method, 2022-2031
9.2.1.2.Market size analysis, by Storage, 2022-2031
9.2.1.3.Market size analysis, by Application, 2022-2031
9.2.1.4.Market size analysis, by End-Use Industry, 2022-2031
9.2.2.UK
9.2.2.1.Market size analysis, by Method, 2022-2031
9.2.2.2.Market size analysis, by Storage, 2022-2031
9.2.2.3.Market size analysis, by Application, 2022-2031
9.2.2.4.Market size analysis, by End-Use Industry, 2022-2031
9.2.3.France
9.2.3.1.Market size analysis, by Method, 2022-2031
9.2.3.2.Market size analysis, by Storage, 2022-2031
9.2.3.3.Market size analysis, by Application, 2022-2031
9.2.3.4.Market size analysis, by End-Use Industry, 2022-2031
9.2.4.Spain
9.2.4.1.Market size analysis, by Method, 2022-2031
9.2.4.2.Market size analysis, by Storage, 2022-2031
9.2.4.3.Market size analysis, by Application, 2022-2031
9.2.4.4.Market size analysis, by End-Use Industry, 2022-2031
9.2.5.Italy
9.2.5.1.Market size analysis, by Method, 2022-2031
9.2.5.2.Market size analysis, by Storage, 2022-2031
9.2.5.3.Market size analysis, by Application, 2022-2031
9.2.5.4.Market size analysis, by End-Use Industry, 2022-2031
9.2.6.Rest of Europe
9.2.6.1.Market size analysis, by Method, 2022-2031
9.2.6.2.Market size analysis, by Storage, 2022-2031
9.2.6.3.Market size analysis, by Application, 2022-2031
9.2.6.4.Market size analysis, by End-Use Industry, 2022-2031
9.2.7.Research Dive Exclusive Insights
9.2.7.1.Market attractiveness
9.2.7.2.Competition heatmap
9.3.Asia-Pacific
9.3.1.China
9.3.1.1.Market size analysis, by Method, 2022-2031
9.3.1.2.Market size analysis, by Storage, 2022-2031
9.3.1.3.Market size analysis, by Application, 2022-2031
9.3.1.4.Market size analysis, by End-Use Industry, 2022-2031
9.3.2.Japan
9.3.2.1.Market size analysis, by Method, 2022-2031
9.3.2.2.Market size analysis, by Storage, 2022-2031
9.3.2.3.Market size analysis, by Application, 2022-2031
9.3.2.4.Market size analysis, by End-Use Industry, 2022-2031
9.3.3.India
9.3.3.1.Market size analysis, by Method, 2022-2031
9.3.3.2.Market size analysis, by Storage, 2022-2031
9.3.3.3.Market size analysis, by Application, 2022-2031
9.3.3.4.Market size analysis, by End-Use Industry, 2022-2031
9.3.4.Australia
9.3.4.1.Market size analysis, by Method, 2022-2031
9.3.4.2.Market size analysis, by Storage, 2022-2031
9.3.4.3.Market size analysis, by Application, 2022-2031
9.3.4.4.Market size analysis, by End-Use Industry, 2022-2031
9.3.5.South Korea
9.3.5.1.Market size analysis, by Method, 2022-2031
9.3.5.2.Market size analysis, by Storage, 2022-2031
9.3.5.3.Market size analysis, by Application, 2022-2031
9.3.5.4.Market size analysis, by End-Use Industry, 2022-2031
9.3.6.Rest of Asia-Pacific
9.3.6.1.Market size analysis, by Method, 2022-2031
9.3.6.2.Market size analysis, by Storage, 2022-2031
9.3.6.3.Market size analysis, by Application, 2022-2031
9.3.6.4.Market size analysis, by End-Use Industry, 2022-2031
9.3.7.Research Dive Exclusive Insights
9.3.7.1.Market attractiveness
9.3.7.2.Competition heatmap
9.4.LAMEA
9.4.1.Brazil
9.4.1.1.Market size analysis, by Method, 2022-2031
9.4.1.2.Market size analysis, by Storage, 2022-2031
9.4.1.3.Market size analysis, by Application, 2022-2031
9.4.1.4.Market size analysis, by End-Use Industry, 2022-2031
9.4.2.Saudi Arabia
9.4.2.1.Market size analysis, by Method, 2022-2031
9.4.2.2.Market size analysis, by Storage, 2022-2031
9.4.2.3.Market size analysis, by Application, 2022-2031
9.4.2.4.Market size analysis, by End-Use Industry, 2022-2031
9.4.3.UAE
9.4.3.1.Market size analysis, by Method, 2022-2031
9.4.3.2.Market size analysis, by Storage, 2022-2031
9.4.3.3.Market size analysis, by Application, 2022-2031
9.4.3.4.Market size analysis, by End-Use Industry, 2022-2031
9.4.4.South Africa
9.4.4.1.Market size analysis, by Method, 2022-2031
9.4.4.2.Market size analysis, by Storage, 2022-2031
9.4.4.3.Market size analysis, by Application, 2022-2031
9.4.4.4.Market size analysis, by End-Use Industry, 2022-2031
9.4.5.Rest of LAMEA
9.4.5.1.Market size analysis, by Method, 2022-2031
9.4.5.2.Market size analysis, by Storage, 2022-2031
9.4.5.3.Market size analysis, by Application, 2022-2031
9.4.5.4.Market size analysis, by End-Use Industry, 2022-2031
9.4.6.Research Dive Exclusive Insights
9.4.6.1.Market attractiveness
9.4.6.2.Competition heatmap
10.Competitive Landscape
10.1.Top winning strategies, 2021
10.1.1.By strategy
10.1.2.By year
10.2.Strategic overview
10.3.Market share analysis
11.Company Profiles
11.1.Siemens Energy AG
11.1.1.Overview
11.1.2.Business segments
11.1.3.Product Type portfolio
11.1.4.Financial performance
11.1.5.Recent developments
11.1.6.SWOT analysis
11.1.7.Research Dive Analyst View
11.2. General Compression Ltd (GCL)
11.2.1.Overview
11.2.2.Business segments
11.2.3.Product Type portfolio
11.2.4.Financial performance
11.2.5.Recent developments
11.2.6.SWOT analysis
11.2.7.Research Dive Analyst View
11.3.Hydrostor Inc.
11.3.1.Overview
11.3.2.Business segments
11.3.3.Product Type portfolio
11.3.4.Financial performance
11.3.5.Recent developments
11.3.6.SWOT analysis
11.3.7.Research Dive Analyst View
11.4. Bright Energy Storage Technologies
11.4.1.Overview
11.4.2.Business segments
11.4.3.Product Type portfolio
11.4.4.Financial performance
11.4.5.Recent developments
11.4.6.SWOT analysis
11.4.7.Research Dive Analyst View
11.5.Pacific Gas and Electric Company
11.5.1.Overview
11.5.2.Business segments
11.5.3.Product Type portfolio
11.5.4.Financial performance
11.5.5.Recent developments
11.5.6.SWOT analysis
11.5.7.Research Dive Analyst View
11.6.Apex Compressed Air Energy Storage, LLC
11.6.1.Overview
11.6.2.Business segments
11.6.3.Product Type portfolio
11.6.4.Financial performance
11.6.5.Recent developments
11.6.6.SWOT analysis
11.6.7.Research Dive Analyst View
11.7.Ridge Energy Storage and Grid Services LP
11.7.1.Overview
11.7.2.Business segments
11.7.3.Product Type portfolio
11.7.4.Financial performance
11.7.5.Recent developments
11.7.6.SWOT analysis
11.7.7.Research Dive Analyst View
11.8.ALACAES
11.8.1.Overview
11.8.2.Business segments
11.8.3.Product Type portfolio
11.8.4.Financial performance
11.8.5.Recent developments
11.8.6.SWOT analysis
11.8.7.Research Dive Analyst View
11.9.Storelectric Limited
11.9.1.Overview
11.9.2.Business segments
11.9.3.Product Type portfolio
11.9.4.Financial performance
11.9.5.Recent developments
11.9.6.SWOT analysis
11.9.7.Research Dive Analyst View
11.10.LightSail Energy
11.10.1.Overview
11.10.2.Business segments
11.10.3.Product Type portfolio
11.10.4.Financial performance
11.10.5.Recent developments
11.10.6.SWOT analysis
11.10.7.Research Dive Analyst View
* Taxes/Fees, If applicable will be added during checkout. All prices in USD.
Have a question ?
Enquire To BuyNeed to add more ?
Request Customization