In-game Advertising Market Report
RA08527
In-game Advertising Market by Type (Static Ads, Dynamic Ads, and Advergaming), Device Type (PC/Laptop and Smartphone/Tablet), and Regional Analysis (North America, Europe, Asia-Pacific, and LAMEA): Global Opportunity Analysis and Industry Forecast, 2022–2030
In-game Advertising Market Analysis
The global in-game advertising market is anticipated to garner $17,591.6 million in the 2022-2030 timeframe, growing from $6,816.6 million in 2021, at a healthy CAGR 11.0%.

Market Synopsis
The in-game advertising market is expected to grow due to acquisitions and business expansion by key market players to increase the adoption of in-game advertising for various applications. Growing interest in social media and mobile gaming is likely to accelerate the global market. Advertisements can be integrated into desktop and mobile games via commercials, cut-scenes, billboards, and background displays with in-game advertising. Furthermore, these advertisements are non-interruptive, allowing players to have a more seamless experience. In-game advertisements are expected to have a greater audio-visual impact, leaving viewers with favorable and long-lasting product impressions. All such aspects will drive the global in-game advertising market.
User’s devices with limited games support can act as restraining factor for the market. Issues such as incompatible device with the version, memory issue, internet support, and others might restrict the market growth.
According to the regional analysis of the market, the Asia-Pacific in-game advertising market is anticipated to grow at a CAGR of 12.6%, by generating a revenue of $4,855.3 million during the review period.
In-game Advertising Overview
In-game advertising, or IGA, is advertisement that appears in computers & smartphones video games. Advertisements are being integrated into mobile games and computer games, according to IGA. Pop-up messages, on-screen advertisements, cut-scenes, billboards, and background displays are common examples. In-game advertising includes static (non-changeable) ads, dynamic (changeable ads), and advergaming (a game built as an advertisement). The increasing internet penetration across the globe is one of the major factors driving the growth of the market.
Impact Analysis of COVID-19 on the Global In-game Advertising Market
The world is currently witnessing an unprecedented pandemic. While many industries struggle to adapt to digital customer service and maintain demand until the crisis ends, digital-content-focused segments of the entertainment industry have found themselves well placed to weather the change, and in some cases, are thriving. The covid-19 pandemic had a positive effect on the in-game advertising market. Gamers are an engaged, diverse, and growing audience, making it one of the reasons of the in-game advertising market’s gaining popularity. Gaming has entered the mainstream as a result of mobile technology and the popularity of games such as Animal Crossing, Wordscapes, and Farm Ville. People are not leaving their homes, which is fueling the growth of the in-game advertising market. People became more interested in online portals and social networking sites as time went on, resulting in an increase in online population and streaming.
However, the increase in social media traffic has contributed new capacity to participate with website visitors while maintaining brand awareness. Furthermore, the coronavirus has dispersed uncontrollably, and governments worldwide are still trying to comprise it by having to close public areas, school systems, as well as borders; as a consequence, all businesses and marketers must keep updating their internet marketing strategies. Furthermore, due to the global epidemic, companies are encouraged to raise more in online advertising, fueling in-game advertising market growth.
Rising Number of Smartphone Users and Increasing Number of Gamers to Propel Growth
In today's technology-driven world, smartphones are being adopted at an astonishing speed all over the world. As a result, it is changing the socialization and communication patterns of the masses. Smartphone users can use many apps to access a variety of services and content via the internet. The growing popularity of mobile gaming is driving the in-game advertising market. The growing popularity of smartphones, as well as the increasing availability of high-speed internet has prompted game developers to place a greater emphasis on improving app design. Furthermore, vendors are increasingly adopting freemium models, in which the first level of a game is provided for free, but users must pay to access the advanced levels. These factors have significantly increased end-user demand for mobile games. Other factors such as an upsurge in the number of gamers and a rising partnership between advertisers and video game companies are also expected to propel the in-game advertising market during the forecast period. For instance, in May 2021, Riot Games, a video game developer, publisher, and esports tournament organizer, from the United States, announced the addition of digital advertisements to the main map of League of Legends, Summoner's Rift. The appearance of a new digital product on an in-game map heralds a significant shift in promotion.
To know more about global in-game advertising market drivers, get in touch with our analysts here.
Inability of the Devices to Support Some Games Can Restrain Market Growth
The need to limit poorly designed advertisements with low consumer impact may impede market growth. Furthermore, an increase in the number of unrelated and distracting advertisements for online and social gaming is expected to have a negative impact on market growth.
The Market is Expected to be Driven by the Emerging Trend of Online Gaming and the Rise of In-game Advertising
In recent years, businesses of all sizes have had opportunities to advertise in the video game industry, mostly in connection with esports games. In April 2021, for example, BMW, a German multinational corporate manufacturer of luxury vehicles, signed global partnership agreements with five major esports teams (Cloud9, Fnatic, FunPlus Phoenix, G2 Esports, and T1 Entertainment & Sports). Moreover, rising disposable income and a growing middle-class population in developing regions are some of the factors driving smartphone demand, which is expected to positively impact the growth of the in-game advertising market throughout the forecast period and beyond. The increasing popularity of business-to-business (B2B), business-to-consumer (B2C), and consumer-to-consumer (C2C) e-commerce websites, as well as the emerging trend of online gaming is driving market growth. The rapidly growing adoption of mobile games as a result of the penetration of numerous online multiplayer games and location-based games such as Pokémon Go, Player Unknown's Battlegrounds, and Free Fire, among others, is one of the primary factors driving the in-game advertising market. Growing internet penetration in developing economies also plays a significant role in driving the market. The availability of faster and cheaper internet services is driving the widespread use of smartphones for gaming which has resulted in the rise in in-game advertising market across the globe.
To know more about global in-game advertising market opportunities, get in touch with our analysts here.
Global In-game Advertising Market, by Type
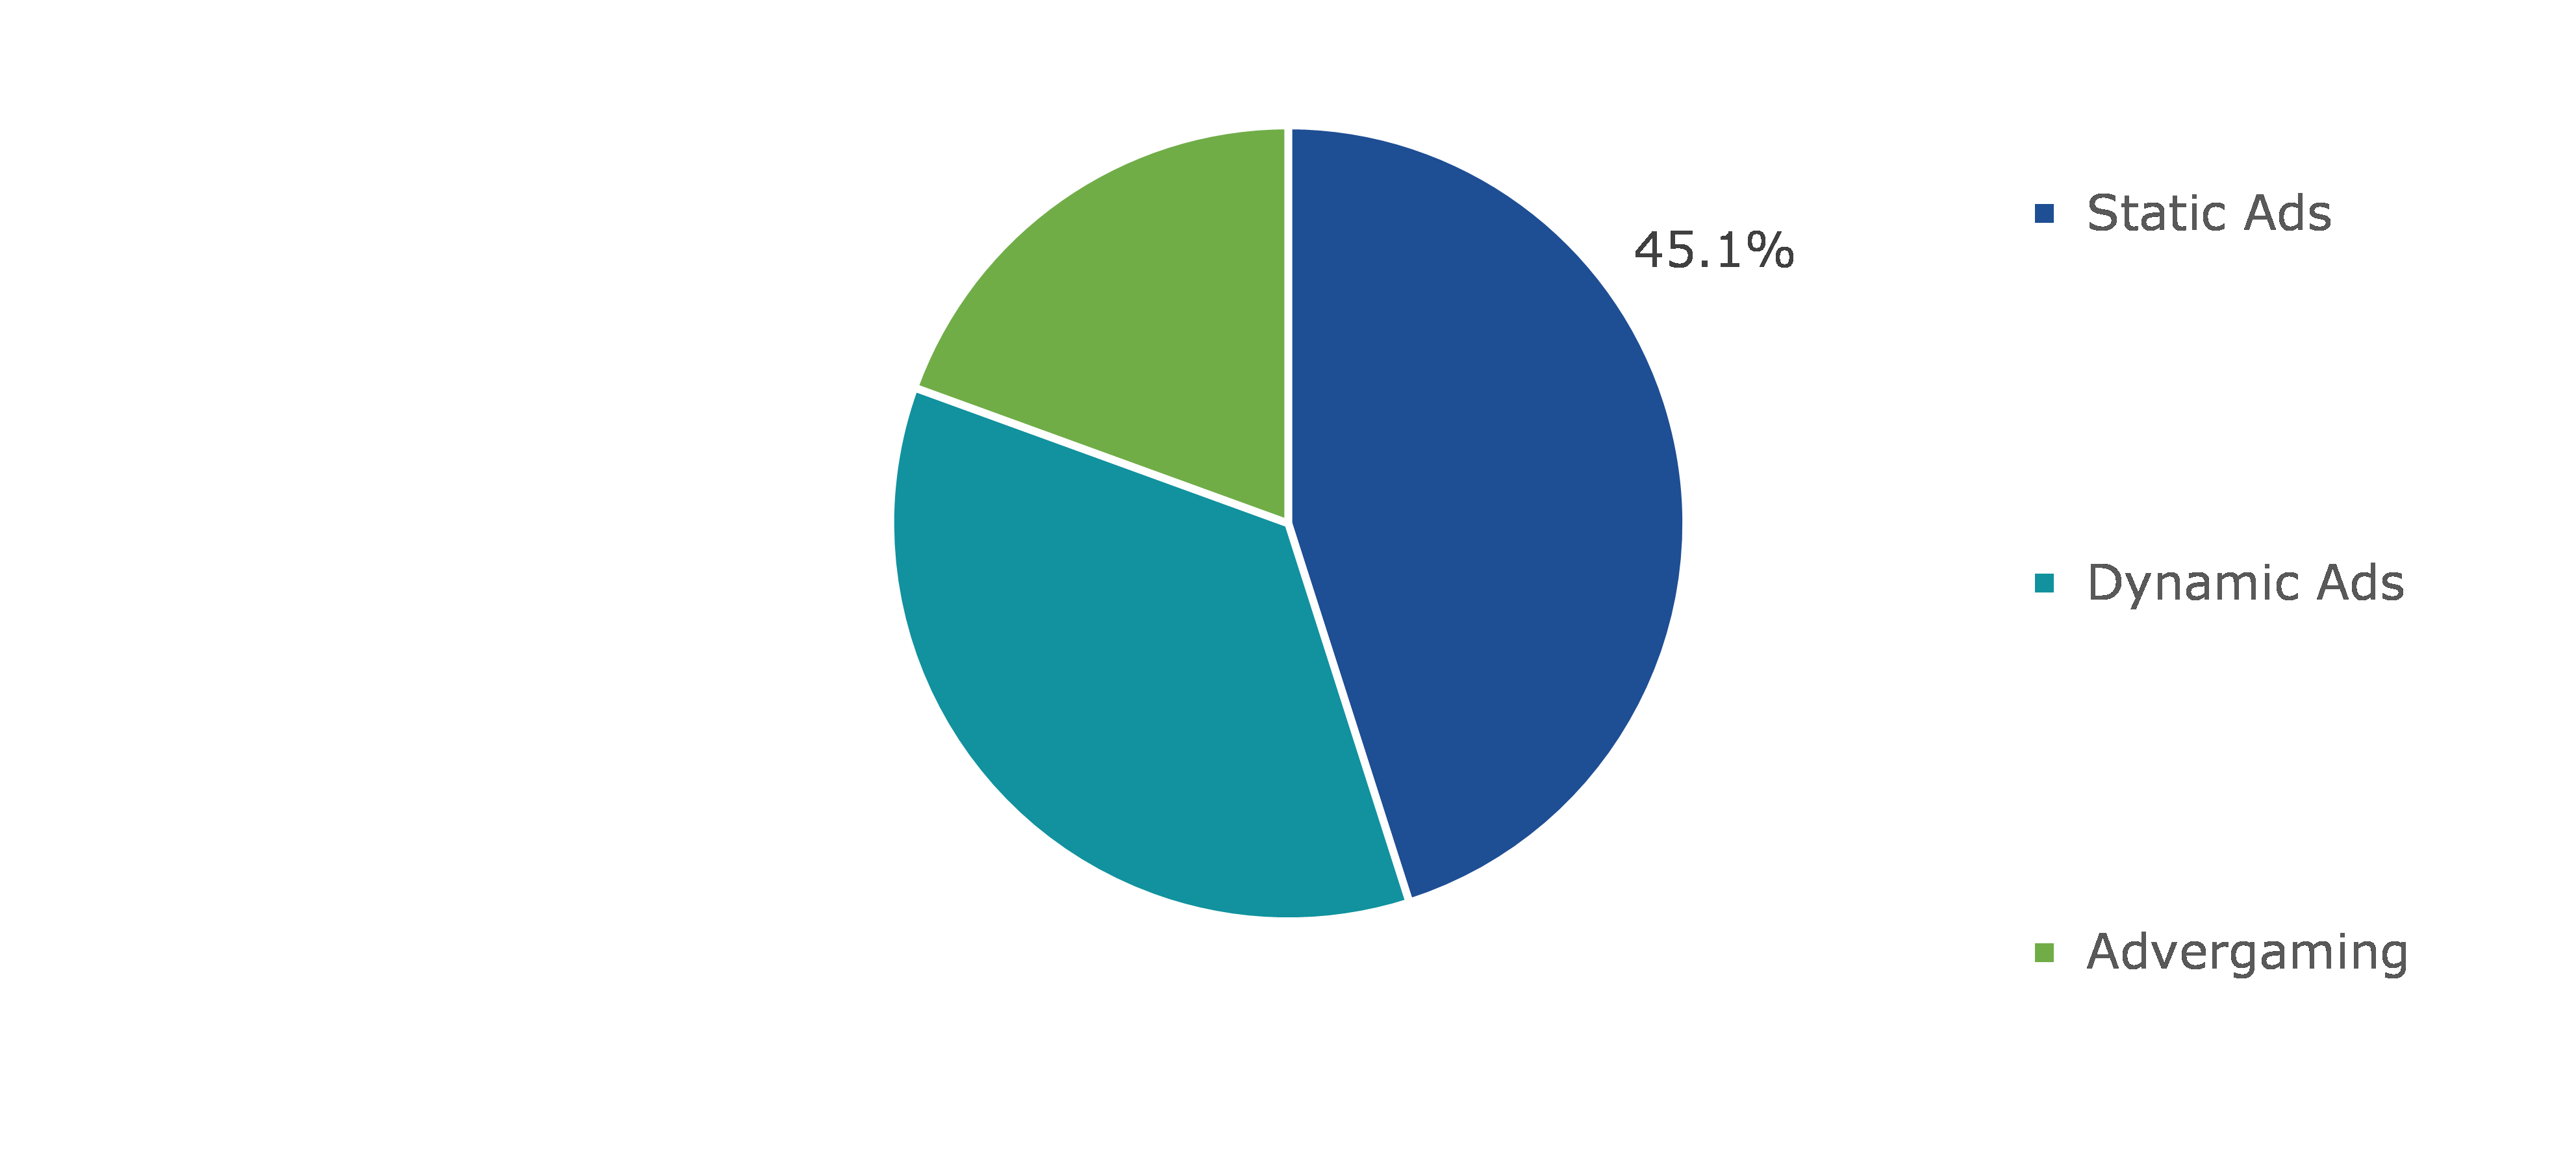
Based on type, the market has been divided into static ads, dynamic ads, and advergaming. Static ads sub-segment accounted for the highest revenue share in 2021, and dynamic ads sub-segment is predicted to show the fastest growth during the forecast period.
Global In-game Advertising Market Share, By Type, 2021
Source: Research Dive Analysis
The static ads sub-segment is anticipated to have a dominant market share and generate a revenue of $8,033.2 million by 2030, growing from $3,072.7 million in 2021. Because developers are increasingly using static ads as a strategy for promoting their games, the static ads sub-segment is expected to dominate the in-game advertising market. Static advertisements have a greater impact on consumers in less time. Static ads are integrated directly into the game. These advertisements are compatible with both desktop and mobile games. The plot of the game is intertwined with static advertisements. These ads' questions allow players to interact with the advertisement. These advertisements introduce players to the games. Static ads are in high demand because they allow for greater customization and allow game developers & advertisers to plan their advertisements.
Global In-game Advertising Market, by Device Type
Based on device type, the analysis has been divided into PC/laptop and smartphone/tablet. Out of these, PC/laptop sub-segment is predicted to be the most dominant and smartphone/tablet sub-segment is anticipated to show the fastest growth during the forecast period.
Global In-game Advertising Market Share, By Device Type, 2021

Source: Research Dive Analysis
The smartphone/tablet sub-segment of the global in-game advertising market is anticipated to have the fastest growth and surpass $7,873.1 million by 2030, with an increase from $2,820.4 million in 2021, with highest CAGR of 11.9%. Increasing demand for social media and mobile gaming, rising internet penetration, expanding reach & ROI, and the ease with which advertisements in social gaming can be configured are expected to drive market growth. Furthermore, these advertisements are non-intrusive, allowing players to have a more enjoyable experience, and this service may generate additional revenue for game developers, leading to the adoption of in-game advertising throughout the forecast period. Increased smartphone penetration and technological advancement, as well as increased adoption of trending technologies for game development is driving the growth of the mobile gaming industry.
Global In-game Advertising Market, Regional Insights:
The in-game advertising market was investigated across North America, Europe, Asia-Pacific, and LAMEA.
Global In-game Advertising Market Size & Forecast, By Region, 2021-2030 (USD Million)

Source: Research Dive Analysis
The Market for In-game Advertising in North America to be the Most Dominant
The North America in-game advertising market accounted $2,398.8 million in 2021 and is projected to register a revenue of $5,731.3 million by 2030. North America is one of the largest in-game advertising markets due to investments in online advertising. This, in turn, influences demand for online advertising services from businesses; additionally, due to the presence of a large gaming population, brands are now investing in advertisements on social media platforms and gaming apps. The advertising landscape in North America is constantly changing, with new trends and technologies transforming the industry at a rapid pace. Among the numerous innovations, the transition from traditional to digital media has had the greatest impact on the in-game advertising market to date. With increasing internet penetration and the spread of digital content across the continent, vendors are allocating larger budgets to digital platforms than ever before, transforming digital advertising into a multibillion-dollar industry. Because of the rise of in-game advertising expenditure, North America dominates the in-game advertising market. This is a major factor driving market growth in this region. For example, the Olympic Games in Tokyo and the 2020 elections are expected to boost ad spending in the United States, contributing to the growth of the in-game advertising market. Magna Global, IPG Mediabrands' strategic global media unit, predicted that ad spending in the United States would rise by 5.1% in 2019 and 6.6% in 2020.
Competitive Scenario in the Global In-game Advertising Market
Product advancements, innovations, and business expansion are common strategies followed by major market players.

Source: Research Dive Analysis
Some of the leading in-game advertising market players are Alphabet Inc., Anzu Virtual Reality Ltd., Blizzard Entertainment Inc., Electronic Arts Inc., MediaSpike Inc., ironSource Ltd., Motive Interactive Inc., Playwire LLC, RapidFire Inc., WPP Plc.
| Aspect | Particulars |
| Historical Market Estimations | 2020-2021 |
| Base Year for Market Estimation | 2021 |
| Forecast Timeline for Market Projection | 2022-2030 |
| Geographical Scope | North America, Europe, Asia-Pacific, LAMEA |
| Segmentation by Type |
|
| Segmentation by Device Type |
|
|
Key Companies Profiled |
|
Q1. What is the size of the global in-game advertising market?
A. The size of the global in-game advertising market was over $6,816.6 million in 2021 and is projected to reach $17,591.6 million by 2030.
Q2. Which are the major companies in the in-game advertising market?
A. Blizzard Entertainment Inc., Electronic Arts Inc., Alphabet Inc., and Anzu Virtual Reality Ltd. are some of the major companies operating in the global in-game advertising market.
Q3. Which region, among others, possesses greater investment opportunities in the near future?
A. The Asia-Pacific region possesses great investment opportunities for investors to witness the most promising growth in the future.
Q4. What will be the growth rate of the Asia-Pacific in-game advertising market?
A. The growth rate of the Asia-Pacific in-game advertising market is 12.6%.
Q5. What are the strategies opted by the leading players in this market?
A. Technological advancements and business expansions are the key strategies opted by the operating companies in this market.
Q6. Which companies are investing more on R&D practices?
A. Electronic Arts Inc., Alphabet Inc., and Anzu Virtual Reality Ltd. are some of the major companies investing more on R&D practices.
1.Research Methodology
1.1.Desk Research
1.2.Real time insights and validation
1.3.Forecast model
1.4.Assumptions and forecast parameters
1.5.Market size estimation
1.5.1.Top-down approach
1.5.2.Bottom-up approach
2.Report Scope
2.1.Market definition
2.2.Key objectives of the study
2.3.Report overview
2.4.Market segmentation
2.5.Overview of the impact of COVID-19 on Global In-game advertising market
3.Executive Summary
4.Market Overview
4.1.Introduction
4.2.Growth impact forces
4.2.1.Drivers
4.2.2.Restraints
4.2.3.Opportunities
4.3.Market value chain analysis
4.3.1.List of raw material suppliers
4.3.2.List of manufacturers
4.3.3.List of distributors
4.4.Innovation & sustainability matrices
4.4.1.Technology matrix
4.4.2.Regulatory matrix
4.5.Porter’s five forces analysis
4.5.1.Bargaining power of suppliers
4.5.2.Bargaining power of consumers
4.5.3.Threat of substitutes
4.5.4.Threat of new entrants
4.5.5.Competitive rivalry intensity
4.6.PESTLE analysis
4.6.1.Political
4.6.2.Economical
4.6.3.Social
4.6.4.Technological
4.6.5.Environmental
4.7.Impact of COVID-19 on In-game advertising market
4.7.1.Pre-covid market scenario
4.7.2.Post-covid market scenario
5.In-game advertising Market Analysis, by Type
5.1.Static Ads
5.1.1.Market size and forecast, by region, 2022-2030
5.1.2.Comparative market share analysis, 2022 & 2030
5.2.Dynamic Ads
5.2.1.Market size and forecast, by region, 2022-2030
5.2.2.Comparative market share analysis, 2022 & 2030
5.3.Advergaming
5.3.1.Market size and forecast, by region, 2022-2030
5.3.2.Comparative market share analysis, 2022 & 2030
5.4.Research Dive Exclusive Insights
5.4.1.Market attractiveness
5.4.2.Competition heatmap
6.5.In-game advertising Market, by Device Type
6.1.PC/Laptop
6.1.1.Market size and forecast, by region, 2022-2030
6.1.2.Comparative market share analysis, 2022 & 2030
6.2.Smartphone/Tablet
6.2.1.Market size and forecast, by region, 2022-2030
6.2.2.Comparative market share analysis, 2022 & 2030
6.3.Research Dive Exclusive Insights
6.3.1.Market attractiveness
6.3.2.Competition heatmap
7.5.In-game advertising Market, by Region
7.1.North America
7.1.1.U.S.
7.1.2.Market size and forecast, by Type, 2022-2030
7.1.3.Market size and forecast, by Device Type, 2022-2030
7.1.4.Canada
7.1.5.Market size and forecast, by Type , 2022-2030
7.1.6.Market size and forecast, by Device Type , 2022-2030
7.1.7.Mexico
7.1.8.Market size and forecast, by Type , 2022-2030
7.1.9.Market size and forecast, by Device Type , 2022-2030
7.1.10.Research Dive Exclusive Insights
7.1.10.1.Market attractiveness
7.1.10.2.Competition heatmap
7.2.Europe
7.2.1.Germany
7.2.2.Market size and forecast, by Type , 2022-2030
7.2.3.Market size and forecast, by Device Type, 2022-2030
7.2.4.UK
7.2.5.Market size and forecast, by Type , 2022-2030
7.2.6.Market size and forecast, by Device Type, 2022-2030
7.2.7.France
7.2.8.Market size and forecast, by Type , 2022-2030
7.2.9.Market size and forecast, by Device Type, 2022-2030
7.2.10.Spain
7.2.11.Market size and forecast, by Type , 2022-2030
7.2.12.Market size and forecast, by Device Type, 2022-2030
7.2.13.Italy
7.2.14.Market size and forecast, by Type , 2022-2030
7.2.15.Market size and forecast, by Device Type, 2022-2030
7.2.16.Rest of Europe
7.2.17.Market size and forecast, by Type , 2022-2030
7.2.18.Market size and forecast, by Device Type, 2022-2030
7.2.19.Research Dive Exclusive Insights
7.2.19.1.Market attractiveness
7.2.19.2.Competition heatmap
7.3.Asia Pacific
7.3.1.China
7.3.2.Market size and forecast, by Type , 2022-2030
7.3.3.Market size and forecast, by Device Type, 2022-2030
7.3.4.Japan
7.3.5.Market size and forecast, by Type , 2022-2030
7.3.6.Market size and forecast, by Device Type, 2022-2030
7.3.7.India
7.3.8.Market size and forecast, by Type , 2022-2030
7.3.9.Market size and forecast, by Device Type, 2022-2030
7.3.10.Australia
7.3.11.Market size and forecast, by Type , 2022-2030
7.3.12.Market size and forecast, by Device Type, 2022-2030
7.3.13.South Korea
7.3.14.Market size and forecast, by Type , 2022-2030
7.3.15.Market size and forecast, by Device Type, 2022-2030
7.3.16.Rest of Asia Pacific
7.3.17.Market size and forecast, by Type , 2022-2030
7.3.18.Market size and forecast, by Device Type, 2022-2030
7.3.19.Research Dive Exclusive Insights
7.3.19.1.Market attractiveness
7.3.19.2.Competition heatmap
7.4.LAMEA
7.4.1.Brazil
7.4.2.Market size and forecast, by Type , 2022-2030
7.4.3.Market size and forecast, by Device Type, 2022-2030
7.4.4.Saudi Arabia
7.4.5.Market size and forecast, by Type , 2022-2030
7.4.6.Market size and forecast, by Device Type, 2022-2030
7.4.7.UAE
7.4.8.Market size and forecast, by Type , 2022-2030
7.4.9.Market size and forecast, by Device Type, 2022-2030
7.4.10.South Africa
7.4.11.Market size and forecast, by Type , 2022-2030
7.4.12.Market size and forecast, by Device Type, 2022-2030
7.4.13.Rest of LAMEA
7.4.14.Market size and forecast, by Type , 2022-2030
7.4.15.Market size and forecast, by Device Type, 2022-2030
7.4.16.Research Dive Exclusive Insights
7.4.16.1.Market attractiveness
7.4.16.2.Competition heatmap
8.Competitive Landscape
8.1.Top winning strategies, 2021
8.1.1.By strategy
8.1.2.By year
8.2.Strategic overview
8.3.Market share analysis, 2021
9.Company Profiles
9.1.Alphabet Inc.
9.1.1.Business overview
9.1.2.Financial performance
9.1.3.Product portfolio
9.1.4.Recent strategic moves & developments
9.1.5.SWOT analysis
9.2.Anzu Virtual Reality Ltd.
9.2.1.Business overview
9.2.2.Financial performance
9.2.3.Product portfolio
9.2.4.Recent strategic moves & developments
9.2.5.SWOT analysis
9.3.Blizzard Entertainment Inc.
9.3.1.Business overview
9.3.2.Financial performance
9.3.3.Product portfolio
9.3.4.Recent strategic moves & developments
9.3.5.SWOT analysis
9.4.Electronic Arts Inc.
9.4.1.Business overview
9.4.2.Financial performance
9.4.3.Product portfolio
9.4.4.Recent strategic moves & developments
9.4.5.SWOT analysis
9.5.MediaSpike Inc.
9.5.1.Business overview
9.5.2.Financial performance
9.5.3.Product portfolio
9.5.4.Recent strategic moves & developments
9.5.5.SWOT analysis
9.6.ironSource Ltd
9.6.1.Business overview
9.6.2.Financial performance
9.6.3.Product portfolio
9.6.4.Recent strategic moves & developments
9.6.5.SWOT analysis
9.7.Motive Interactive Inc.
9.7.1.Business overview
9.7.2.Financial performance
9.7.3.Product portfolio
9.7.4.Recent strategic moves & developments
9.7.5.SWOT analysis
9.8.Playwire LLC
9.8.1.Business overview
9.8.2.Financial performance
9.8.3.Product portfolio
9.8.4.Recent strategic moves & developments
9.8.5.SWOT analysis
9.9.RapidFire Inc
9.9.1.Business overview
9.9.2.Financial performance
9.9.3.Product portfolio
9.9.4.Recent strategic moves & developments
9.9.5.SWOT analysis
9.10.WPP Plc
9.10.1.Business overview
9.10.2.Financial performance
9.10.3.Product portfolio
9.10.4.Recent strategic moves & developments
9.10.5.SWOT analysis
10.Appendix
10.1.Parent & peer market analysis
10.2.Premium insights from industry experts
10.3.Related reports
The video game arena is experiencing rapid evolution over the past few years. As the adoption of games skyrocketed due to the rising developments in gaming industry, marketing managers started seeing video games as luxuriant, new ground for placing advertisements.
The in-game advertising technique plays a crucial role in the todays marketing strategies. To begin with, this technique can aid brands in being more visible, on advertising platforms where the competition is yet low. Also, by picking the right in-game advertising layout, marketers can differentiate their brand from the rest of the competition, and reach a highly specific target audience. Besides, by capitalizing in in-game advertising, brands are able to optimize advertisements in real-time. The customization features available in this technique offer several lucrative opportunities for businesses, if their aim is to develop a customized advertising message.
The increasing number of smartphone users and gamers, and the emerging trend of online gaming is driving the growth of the in-game advertising market. In addition, the growing interest of people in social media and mobile gaming is likely to upsurge the global market growth.
In-game Advertising Market Trends and Developments
The rising attraction toward mobile gaming especially among youngsters is driving the in-game advertising market. Also, the rising use of smartphones and growing availability of high-speed internet have encouraged game developers to focus on enhancing app design. Also, in the past few years, companies of all sizes have grabbed opportunities to market their brand through video games, mainly in connection with e-sports games.
Gradually, there have been numerous advances in the in-game advertising sector. Market players are considerably investing in in-depth research for enhancing the efficiency of this amazing technology. As per a report by Research Dive, the global in-game advertising market is expected to gather a revenue of $17,591.6 million by 2030, owing to the rising demand for in-game advertising technology among marketers all across the globe.
Some of the foremost players of the in-game advertising market are Alphabet Inc., Blizzard Entertainment Inc., Anzu Virtual Reality Ltd., Electronic Arts Inc., ironSource Ltd., MediaSpike Inc., Motive Interactive Inc., RapidFire Inc., Playwire LLC, and WPP Plc. These players are focused on developing strategies such as partnerships, product development, mergers and acquisitions, and collaborations to achieve a foremost position in the global market. For instance,
- In April 2021, InMobi, a foremost independent marketing cloud, launched in-game advertising, which is now accessible for brands worldwide to access programmatically on InMobi Exchange.
- In June 2021, Adverty, a gaming adtech firm, launched interactive in-game ad format which will be first available in Magic Finger 3D, an iOS & Android game from Netherlands-based Lucky Kat.
- In June 2021, Playwire, a leading technology company specializing in revenue amplification for app developers and publishers, entered into a strategic collaboration with HP for the new OMEN Oasis feature for OMEN Gaming Hub. Omen Oasis is a place for online gamers to host elite watch parties for high-quality game streaming, plus text chat, audio chat, and video chat.
- In March 2022, Anzu Virtual Reality, an in-game advertising platform, raised $20 million in a round of funding to expand in-game advertising efforts, bringing its total capital raised to $37 million. The funding round saw participation from new investors HTC and NBCUniversal, as well as support from Bitkraft Ventures, HBSE Ventures, Sony Innovation Fund, Alumni Ventures Group, Goal Ventures, The Chicago Cubs, and WPP.
Impact of the COVID-19 Pandemic on the Global In-Game Advertising Market
The sudden outburst of the coronavirus pandemic has positively impacted the global in-game advertising market. During the pandemic, digital advertising techniques started gaining much prominence. Businesses began renovating their marketing strategies and started to run online ads for a better reach across potential audiences. Moreover, a number of businesses and industries have adopted virtual mode of working, and are hence, thinking to expand a major share of their advertising budget on digital platforms. The in-game advertisement market’s growth is projected to be greatly fueled by growing digitalization and rising adoption of video games during the lockdown period. To sum-up, the global in-game advertising industry is sure to observe tremendous growth and garner significant revenue in the coming years.
Regional Analysis
The North America region in the in-game advertising market is predicted to garner a revenue of $5,731.3 million by 2030. The significant growth of the region is mainly because North America is one of the largest in-game advertising markets owing to the investments in online advertising, which in turn, influences demand for online advertising services from various businesses. Besides, brands are now greatly investing in advertisements in gaming apps and social media platforms due to the presence of a large gaming population in the region.
Personalize this research
- Triangulate with your own data
- Request your format and definition
- Get a deeper dive on a specific application, geography, customer or competitor
- + 1-888-961-4454 Toll - Free
- support@researchdive.com
