Toll Free : + 1-888-961-4454 | Int'l : + 91 (788) 802-9103 | support@researchdive.com
BF21118508 |
Pages: 221 |
Nov 2021 |
The global specialty insurance market size is predicted to garner a revenue of $243.70 billion in the 2021–2028 timeframe, growing from $133.64 billion in 2020, at a healthy CAGR of 7.6%.
The specialty insurance market share is expected to rise due to an increase in demand for specialized expertise and technology advancements.
However, misconceptions and a lack of information about specialty insurance may hinder the specialty insurance market's expansion.
According to the regional analysis of the market, the Asia-Pacific specialty insurance market share is anticipated to grow at a CAGR of 8.0%, by generating a revenue of $69.11 billion during the review period.
Specialty insurance is meant to protect enterprises with unusual needs from liability claims. Furthermore, this insurance is sought for objects or situations that are considered one-of-a-kind and are not often covered by ordinary insurance policies. Specialty insurance is in great demand in the construction, environmental, healthcare, and energy industries. Errors and omissions (E&O) insurance, a sort of professional liability insurance, is also a common type of specialty insurance plan.
In March 2020, the World Health Organization declared COVID-19 as a pandemic, which resulted in restrictions on travel and disturbances in financial markets, as well as negatively impacted supply chains and production levels. The COVID-19 pandemic has caused massive disruptions and changes in a variety of businesses. The COVID-19 pandemic is having a negative influence on specialty insurance. During the crisis, worldwide travel, trade, and new developments were halted, affecting industries like aviation, marine, and construction. As a result, the utilization of underlying assets has decreased fast, and losses in these sectors have resulted in a drop in specialty insurance coverages. As a result, during the global health crisis, demand for specialty insurance policies has plummeted.
Insurance businesses are leveraging innovative digital solutions to extend their operations and establish product lines based on niche client demand as a result of shifting business models, which contributes considerably to market growth. For loss prediction and prevention, risk monitoring, and claims processing, the integration of technologies such as cloud computing, artificial intelligence, and blockchain is becoming a prominent element that is expected to provide profitable potential for specialty insurance market growth in the coming years.
To know more about global specialty insurance market trends, get in touch with our analysts here.
Misconceptions and a lack of information about specialty insurance stifle the specialty insurance market's expansion. Competitive pricing based on coverages, the need for a whole new policy to cover a company's assets, and agent commissions are just a few of the common myths about specialty insurance. Furthermore, market restrictions include awareness of the various specialty risk insurance covered, repayment mechanisms, and transparency in terms of prices for specialty insurance.
Developing nations, particularly rising economies like Australia, India, China, Singapore, and South Korea provide considerable opportunity for specialty insurers to expand and develop their portfolios. Specialty insurance offers a wide range of coverage alternatives as well as a great deal of flexibility in terms of coverages, policy term, and policy duration, all of which contribute to the specialty insurance market's expansion. Furthermore, a surge in demand for specialized expertise is a major driver of market expansion.
To know more about global specialty insurance market opportunities, get in touch with our analysts here.
[TYPEGRAPH]
Source: Research Dive Analysis
The life insurance sub-segment is predicted to have a dominating market share in the global market and register a revenue of $200.21 billion during the forecast period. For those who would have difficulty qualifying for standard coverage, specialty life insurance focuses on guaranteed and simplified life insurance policies. For someone with a pre-existing medical condition, these insurances may make sense. They are also wonderful options for individuals who do not have the time or desire to undertake a physical examination.
The non-life insurance sub-segment is expected to be the fastest growing in the global market and register a revenue of $43.49 billion, with a CAGR of 8.3% during the forecast period. Non-life insurance covers commercial auto insurances, flood insurance, cyber liability insurance, special event insurance and others. One of the reasons for non-life insurance's consistent growth is a greater emphasis on innovation, which is driven by a greater emphasis on customer centricity. Behavioral developments and preferences of insurance purchasers have fueled increased innovation in the insurance sector throughout the years. Consumer behavior has shifted as a result of increased internet usage, more social networking, and behavioral shifts related to increased use of mobile and handheld technology.
[DISTRIBUTIONCHANNELGRAPH]
Source: Research Dive Analysis
The direct channel sub-segment is predicted to have a dominating market share in the global market and register a revenue of $149.41 billion during the forecast period. Advertising via traditional media, telemarketing, and the use of the internet to solicit business are all examples of direct response marketing. On the internet, consumers may readily compare policy benefits and pricing, particularly on various sites dedicated to comparing insurance prices. The direct response technique is the most cost effective for the consumer because marketing insurance goods is significantly cheaper than through an agency network, and the competition is much broader.
The indirect channel sub-segment is anticipated to experience the fastest market growth during the forecast period. It is predicted that the market shall generate a revenue of $94.29 billion by 2028, growing from $51.02 billion in 2020, with a CAGR of 7.8%. The indirect channel is comprised of agents and brokers. Insurance agents and brokers are investing in digital technologies such as cloud computing in order to better serve customers online while increasing sales and margins. These internet portals and other mobile platforms are intended to improve corporate processing efficiency while cutting costs. The growth of the sub-segment is predicted to be boosted by the integration of technology into existing services.
[ENDUSERSGRAPH]
Source: Research Dive Analysis
The businesses insurance sub-segment is anticipated to generate highest revenue during the forecast period. It is predicted that the market shall generate a revenue of $186.56 billion by 2028, growing from $100.89 billion in 2020, with a CAGR of 7.8%. Specialty insurance plans are becoming increasingly important for businesses to protect themselves against unforeseen losses. Specialty business insurance protects them from lawsuits, property damage, commercial obligations, and other risks that aren't covered by standard non-life insurance plans. The growth of the businesses sub-segment is expected to accelerate in the next years as a result of these causes.
[REGIONGRAPH]
Source: Research Dive Analysis
Asia-Pacific is anticipated to be the fastest growing market during the forecast time period and reach $69.11 billion by 2028, with a CAGR of 8.0%. The Asia-Pacific region market is predicted to increase significantly throughout the forecast period due to the presence of various emerging economies and financial centers such as Singapore, India, and Hong Kong. Insurance firms in the region are aiming to give low-cost insurance premium options. As cloud technologies become more widely used and internet users become more frequent, the region's insurance companies are increasingly moving to digital insurance platforms.
Source: Research Dive Analysis
Some of the leading specialty insurance market players are AXA, American International Group Inc., Allianz, Assicurazioni Generali S.P.A., Berkshire Hathaway Inc., Chubb, Munich Re, PICC, Tokio Marine HCC, and Zurich.
Porter’s Five Forces Analysis for the Global Specialty Insurance Market:
| Aspect | Particulars |
| Historical Market Estimations | 2019-2020 |
| Base Year for Market Estimation | 2020 |
| Forecast Timeline for Market Projection | 2021-2028 |
| Geographical Scope | North America, Europe, Asia-Pacific, LAMEA |
| Segmentation by Type |
|
| Segmentation by Distribution channel |
|
| Segmentation by End-Users |
|
| Key Companies Profiled |
|
1.Research Methodology
1.1.Desk Research
1.2.Real time insights and validation
1.3.Forecast model
1.4.Assumptions and forecast parameters
1.4.1.Assumptions
1.4.2.Forecast parameters
1.5.Data sources
1.5.1.Primary
1.5.2.Secondary
2.Executive Summary
2.1.360° summary
2.2.By Type trends
2.3.By End-Users trends
2.4.By Distribution Channel trends
3.Market overview
3.1.Market segmentation & definitions
3.2.Key takeaways
3.2.1.Top investment pockets
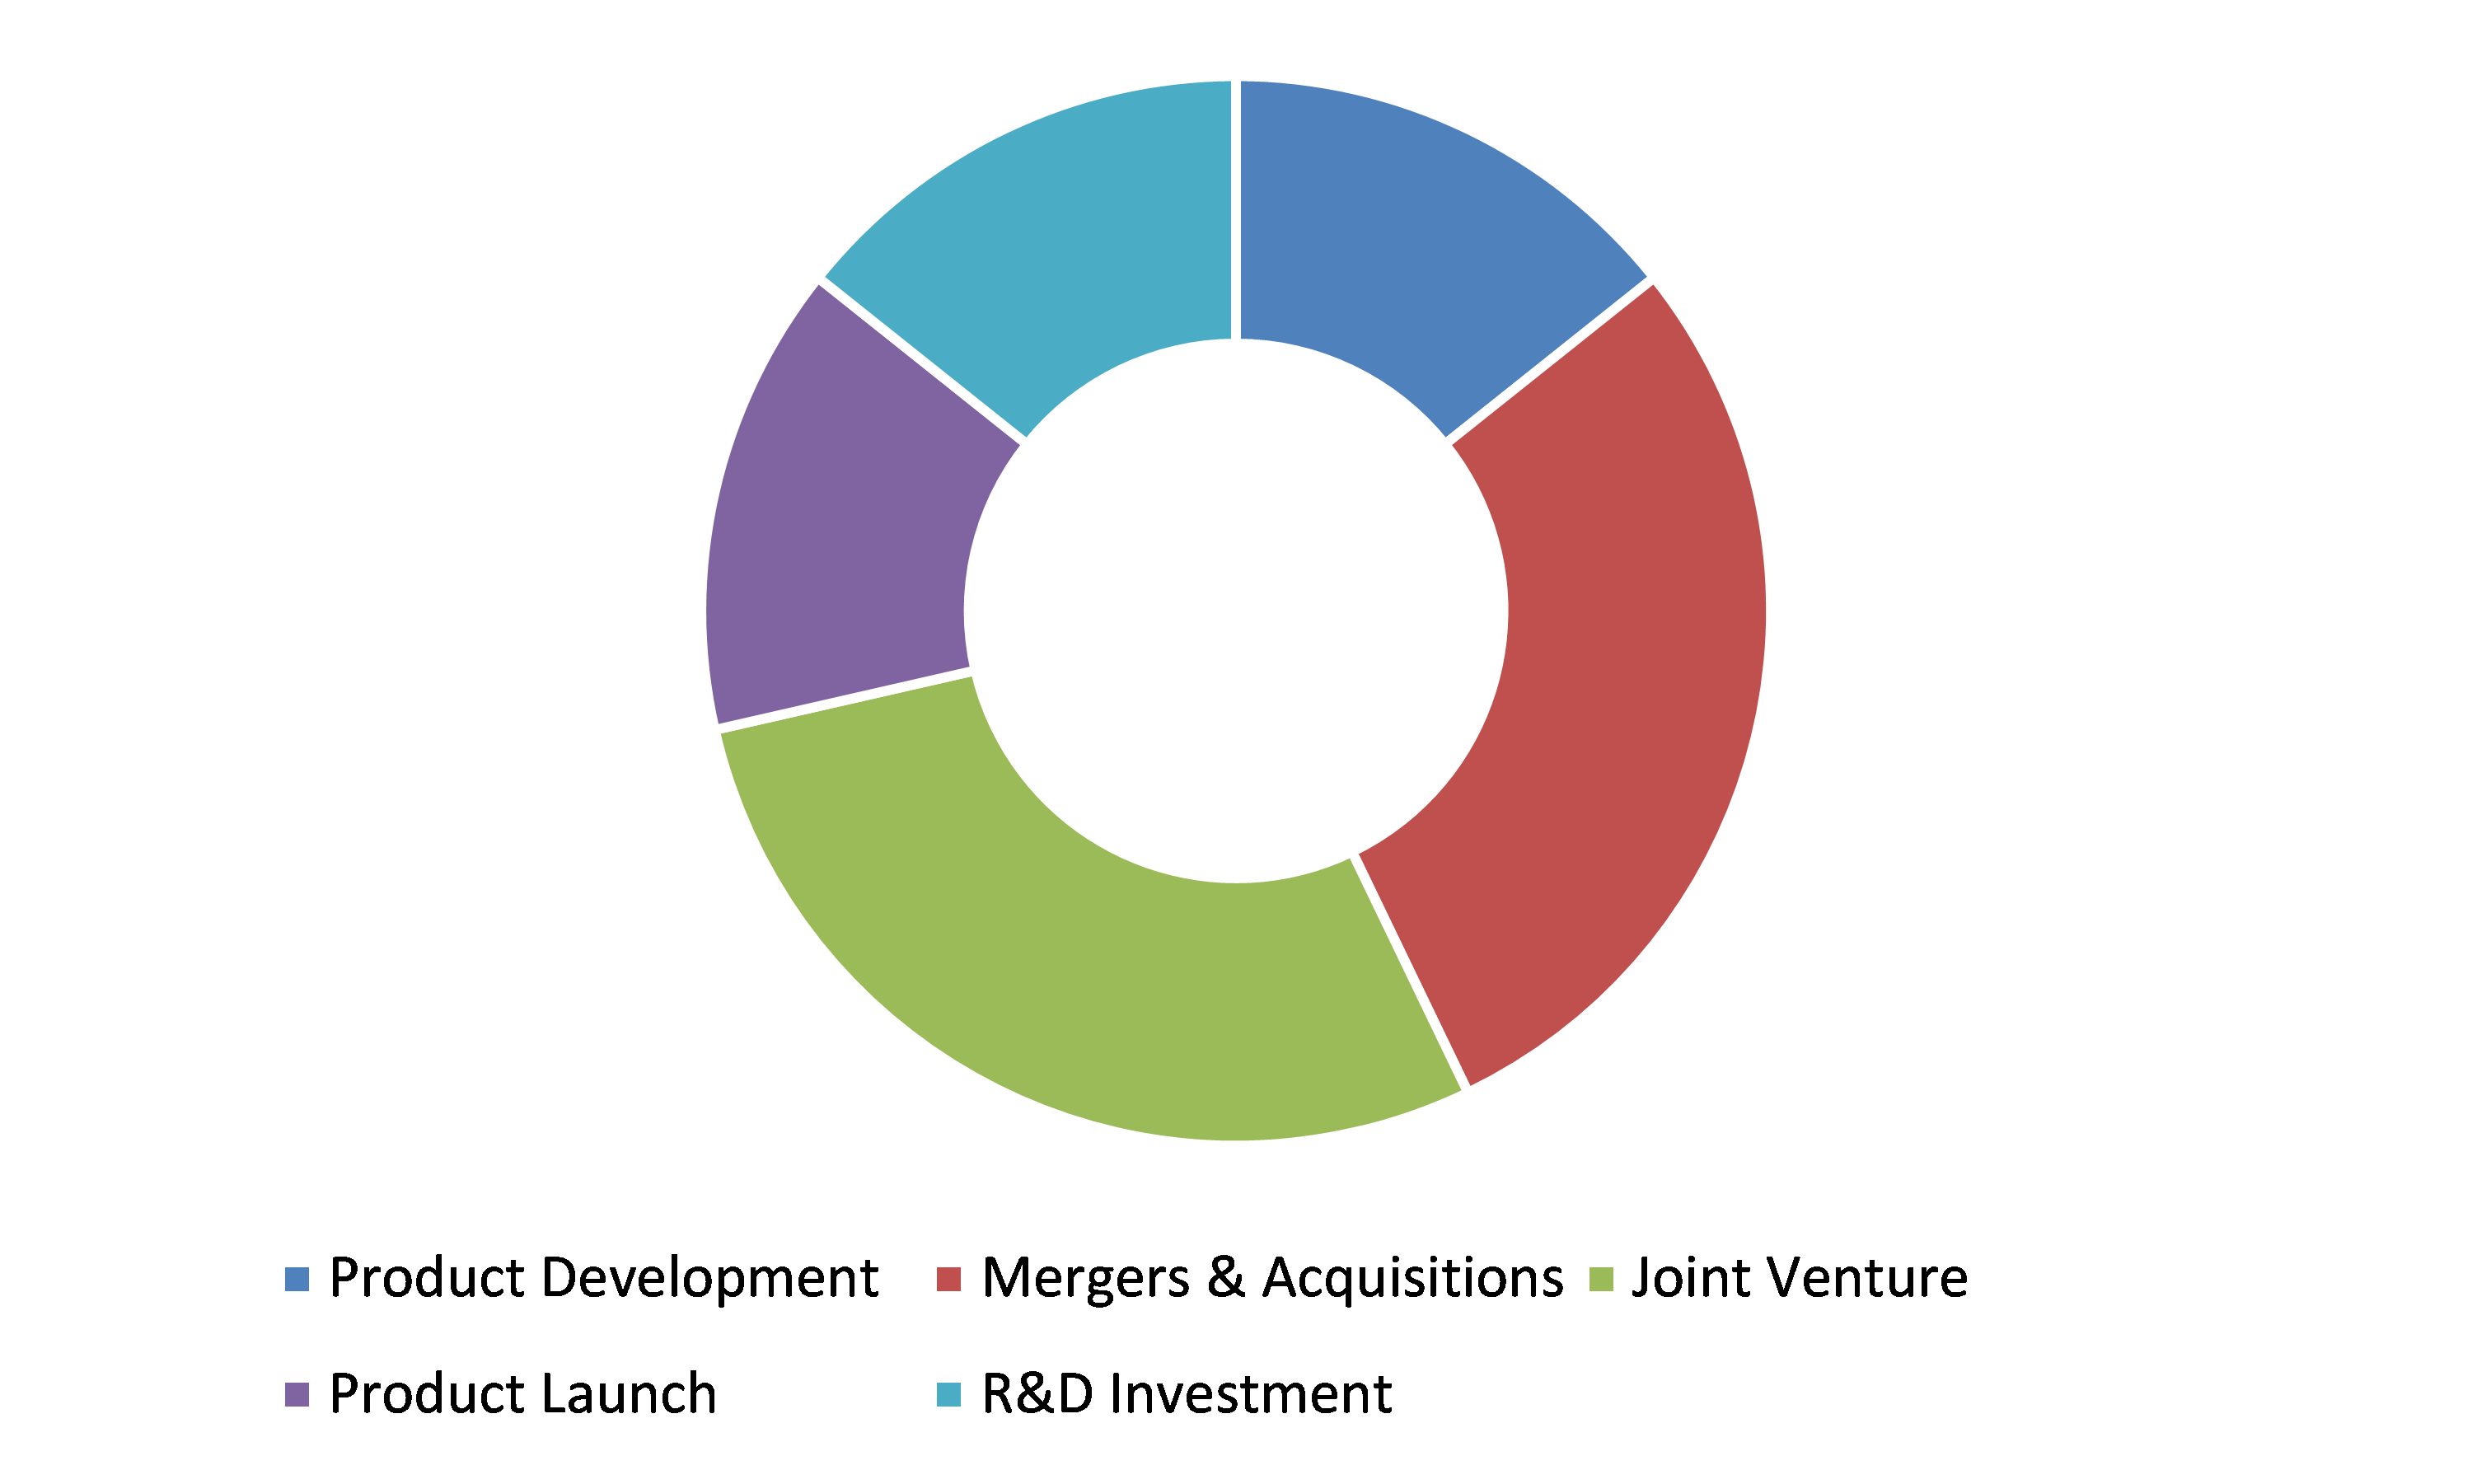
3.2.2.Top winning strategies
3.3.Porter’s five forces analysis
3.3.1.Bargaining power of consumers
3.3.2.Bargaining power of suppliers
3.3.3.Threat of new entrants
3.3.4.Threat of substitutes
3.3.5.Competitive rivalry in the market
3.4.Market dynamics
3.4.1.Drivers
3.4.2.Restraints
3.4.3.Opportunities
3.5.Distribution Channel landscape
3.6.Regulatory landscape
3.7.Patent landscape
3.8.Pricing overview
3.8.1.by Type
3.8.2.by End-Users
3.8.3.By Distribution Channel type
3.9.Market value chain analysis
3.9.1.Stress point analysis
3.9.2.Raw material analysis
3.9.3.Manufacturing process
3.9.4.Distribution Channel analysis
3.9.5.Operating vendors
3.9.5.1.Raw material suppliers
3.9.5.2.Product manufacturers
3.9.5.3.Product distributors
3.10.Strategic overview
4.Specialty Insurance Market, by Type
4.1.Life insurance
4.1.1.Market size and forecast, by region, 2020-2028
4.1.2.Comparative market share analysis, 2020 & 2028
4.2.Non-Life insurance
4.2.1.Market size and forecast, by region, 2020-2028
4.2.2.Comparative market share analysis, 2020 & 2028
5.Specialty Insurance Market, by End-Users
5.1.Businesses
5.1.1.Market size and forecast, by region, 2020-2028
5.1.2.Comparative market share analysis, 2020 & 2028
5.2.Individuals
5.2.1.Market size and forecast, by region, 2020-2028
5.2.2.Comparative market share analysis, 2020 & 2028
6.Specialty Insurance Market, by Distribution Channel
6.1.Direct Channel
6.1.1.Market size and forecast, by region, 2020-2028
6.1.2.Comparative market share analysis, 2020 & 2028
6.2.Indirect Channel
6.2.1.Market size and forecast, by region, 2020-2028
6.2.2.Comparative market share analysis, 2020 & 2028
7.Specialty Insurance Market, by Region
7.1.North America
7.1.1.Market size and forecast, by Type, 2020-2028
7.1.2.Market size and forecast, by End-Users, 2020-2028
7.1.3.Market size and forecast, by Distribution Channel, 2020-2028
7.1.4.Market size and forecast, by country, 2020-2028
7.1.5.Comparative market share analysis, 2020 & 2028
7.1.6.U.S.
7.1.6.1.Market size and forecast, by Type, 2020-2028
7.1.6.2.Market size and forecast, by End-Users, 2020-2028
7.1.6.3.Market size and forecast, by Distribution Channel, 2020-2028
7.1.6.4.Comparative market share analysis, 2020 & 2028
7.1.7.Canada
7.1.7.1.Market size and forecast, by Type, 2020-2028
7.1.7.2.Market size and forecast, by End-Users, 2020-2028
7.1.7.3.Market size and forecast, by Distribution Channel, 2020-2028
7.1.7.4.Comparative market share analysis, 2020 & 2028
7.1.8.Mexico
7.1.8.1.Market size and forecast, by Type, 2020-2028
7.1.8.2.Market size and forecast, by End-Users, 2020-2028
7.1.8.3.Market size and forecast, by Distribution Channel, 2020-2028
7.1.8.4.Comparative market share analysis, 2020 & 2028
7.2.Europe
7.2.1.Market size and forecast, by Type, 2020-2028
7.2.2.Market size and forecast, by End-Users, 2020-2028
7.2.3.Market size and forecast, by Distribution Channel, 2020-2028
7.2.4.Market size and forecast, by country, 2020-2028
7.2.5.Comparative market share analysis, 2020 & 2028
7.2.6.Germany
7.2.6.1.Market size and forecast, by Type, 2020-2028
7.2.6.2.Market size and forecast, by End-Users, 2020-2028
7.2.6.3.Market size and forecast, by Distribution Channel, 2020-2028
7.2.6.4.Comparative market share analysis, 2020 & 2028
7.2.7.UK
7.2.7.1.Market size and forecast, by Type, 2020-2028
7.2.7.2.Market size and forecast, by End-Users, 2020-2028
7.2.7.3.Market size and forecast, by Distribution Channel, 2020-2028
7.2.7.4.Comparative market share analysis, 2020 & 2028
7.2.8.France
7.2.8.1.Market size and forecast, by Type, 2020-2028
7.2.8.2.Market size and forecast, by End-Users, 2020-2028
7.2.8.3.Market size and forecast, by Distribution Channel, 2020-2028
7.2.8.4.Comparative market share analysis, 2020 & 2028
7.2.9.Italy
7.2.9.1.Market size and forecast, by Type, 2020-2028
7.2.9.2.Market size and forecast, by End-Users, 2020-2028
7.2.9.3.Market size and forecast, by Distribution Channel, 2020-2028
7.2.9.4.Comparative market share analysis, 2020 & 2028
7.2.10.Spain
7.2.10.1.Market size and forecast, by Type, 2020-2028
7.2.10.2.Market size and forecast, by End-Users, 2020-2028
7.2.10.3.Market size and forecast, by Distribution Channel, 2020-2028
7.2.10.4.Comparative market share analysis, 2020 & 2028
7.2.11.Rest of Europe
7.2.11.1.Market size and forecast, by Type, 2020-2028
7.2.11.2.Market size and forecast, by End-Users, 2020-2028
7.2.11.3.Market size and forecast, by Distribution Channel, 2020-2028
7.2.11.4.Comparative market share analysis, 2020 & 2028
7.3.Asia-Pacific
7.3.1.Market size and forecast, by Type, 2020-2028
7.3.2.Market size and forecast, by End-Users, 2020-2028
7.3.3.Market size and forecast, by Distribution Channel, 2020-2028
7.3.4.Market size and forecast, by country, 2020-2028
7.3.5.Comparative market share analysis, 2020 & 2028
7.3.6.China
7.3.6.1.Market size and forecast, by Type, 2020-2028
7.3.6.2.Market size and forecast, by End-Users, 2020-2028
7.3.6.3.Market size and forecast, by Distribution Channel, 2020-2028
7.3.6.4.Comparative market share analysis, 2020 & 2028
7.3.7.Japan
7.3.7.1.Market size and forecast, by Type, 2020-2028
7.3.7.2.Market size and forecast, by End-Users, 2020-2028
7.3.7.3.Market size and forecast, by Distribution Channel, 2020-2028
7.3.7.4.Comparative market share analysis, 2020 & 2028
7.3.8.India
7.3.8.1.Market size and forecast, by Type, 2020-2028
7.3.8.2.Market size and forecast, by End-Users, 2020-2028
7.3.8.3.Market size and forecast, by Distribution Channel, 2020-2028
7.3.8.4.Comparative market share analysis, 2020 & 2028
7.3.9.South Korea
7.3.9.1.Market size and forecast, by Type, 2020-2028
7.3.9.2.Market size and forecast, by End-Users, 2020-2028
7.3.9.3.Market size and forecast, by Distribution Channel, 2020-2028
7.3.9.4.Comparative market share analysis, 2020 & 2028
7.3.10.Australia
7.3.10.1.Market size and forecast, by Type, 2020-2028
7.3.10.2.Market size and forecast, by End-Users, 2020-2028
7.3.10.3.Market size and forecast, by Distribution Channel, 2020-2028
7.3.10.4.Comparative market share analysis, 2020 & 2028
7.3.11.Rest of Asia Pacific
7.3.11.1.Market size and forecast, by Type, 2020-2028
7.3.11.2.Market size and forecast, by End-Users, 2020-2028
7.3.11.3.Market size and forecast, by Distribution Channel, 2020-2028
7.3.11.4.Comparative market share analysis, 2020 & 2028
7.4.LAMEA
7.4.1.Market size and forecast, by Type, 2020-2028
7.4.2.Market size and forecast, by End-Users, 2020-2028
7.4.3.Market size and forecast, by Distribution Channel, 2020-2028
7.4.4.Market size and forecast, by country, 2020-2028
7.4.5.Comparative market share analysis, 2020 & 2028
7.4.6.Latin America
7.4.6.1.Market size and forecast, by Type, 2020-2028
7.4.6.2.Market size and forecast, by End-Users, 2020-2028
7.4.6.3.Market size and forecast, by Distribution Channel, 2020-2028
7.4.6.4.Comparative market share analysis, 2020 & 2028
7.4.7.Middle East
7.4.7.1.Market size and forecast, by Type, 2020-2028
7.4.7.2.Market size and forecast, by End-Users, 2020-2028
7.4.7.3.Market size and forecast, by Distribution Channel, 2020-2028
7.4.7.4.Comparative market share analysis, 2020 & 2028
7.4.8.Africa
7.4.8.1.Market size and forecast, by Type, 2020-2028
7.4.8.2.Market size and forecast, by End-Users, 2020-2028
7.4.8.3.Market size and forecast, by Distribution Channel, 2020-2028
7.4.8.4.Comparative market share analysis, 2020 & 2028
8.Company profiles
8.1.AXA
8.1.1.Business overview
8.1.2.Financial performance
8.1.3.Product portfolio
8.1.4.Recent strategic moves & developments
8.1.5.SWOT analysis
8.2.American International Group Inc.
8.2.1.Business overview
8.2.2.Financial performance
8.2.3.Product portfolio
8.2.4.Recent strategic moves & developments
8.2.5.SWOT analysis
8.3.Allianz
8.3.1.Business overview
8.3.2.Financial performance
8.3.3.Product portfolio
8.3.4.Recent strategic moves & developments
8.3.5.SWOT analysis
8.4.ASSICURAZIONI GENERALI S.P.A.
8.4.1.Business overview
8.4.2.Financial performance
8.4.3.Product portfolio
8.4.4.Recent strategic moves & developments
8.4.5.SWOT analysis
8.5.Berkshire Hathaway Inc.
8.5.1.Business overview
8.5.2.Financial performance
8.5.3.Product portfolio
8.5.4.Recent strategic moves & developments
8.5.5.SWOT analysis
8.6.Chubb Limited
8.6.1.Business overview
8.6.2.Financial performance
8.6.3.Product portfolio
8.6.4.Recent strategic moves & developments
8.6.5.SWOT analysis
8.7.Munich RE
8.7.1.Business overview
8.7.2.Financial performance
8.7.3.Product portfolio
8.7.4.Recent strategic moves & developments
8.7.5.SWOT analysis
8.8.PICC
8.8.1.Business overview
8.8.2.Financial performance
8.8.3.Product portfolio
8.8.4.Recent strategic moves & developments
8.8.5.SWOT analysis
8.9.Tokio Marine HCC
8.9.1.Business overview
8.9.2.Financial performance
8.9.3.Product portfolio
8.9.4.Recent strategic moves & developments
8.9.5.SWOT analysis
8.10.Zurich
8.10.1.Business overview
8.10.2.Financial performance
8.10.3.Product portfolio
8.10.4.Recent strategic moves & developments
8.10.5.SWOT analysis
* Taxes/Fees, If applicable will be added during checkout. All prices in USD.
Have a question ?
Enquire To BuyNeed to add more ?
Request Customization