Toll Free : + 1-888-961-4454 | Int'l : + 91 (788) 802-9103 | support@researchdive.com
EN21108502 |
Pages: 233 |
Nov 2021 |
The global green hydrogen market size was $257.7 million in 2020 and is predicted to grow with a CAGR of 54.7%, by generating a revenue of $9,834.3 million by 2028.
Green hydrogen market is gaining huge popularity owing to growing over carbon emissions mostly from transport and industrial sectors. Green hydrogen produced via electrolysis uses renewable energy sources such as wind and solar for the production of hydrogen as a fuel for power generation. Growing popularity of the use of hydrogen as a fuel which is clean source of energy as it lowers the carbon emissions is estimated to drive the green hydrogen market demand. Hydrogen is abundant and renewable source of energy which is perfect to meet the zero-carbon needs of the future as it has no adverse environmental impact as the byproducts are heat and water.
However, high infrastructure cost associated with adoption and transportation of hydrogen is estimated to restrain the market growth. For instance, fossil fuels that have been used since decades for power supply already exist. However, large scale adoption of hydrogen fuel cell technology for automotive sector requires new refueling infrastructure which is anticipated to hamper the green hydrogen market demand during the forecast period.
Growing investments in green hydrogen market is estimated to drive the market size. For instance, as stated on May 03, 2021, in the United Nations Climate Change, which aims to stabilize the harmful greenhouse gases concentration in the atmosphere, the European Union (EU) has planned to invest $430 billion in green hydrogen by 2030. In addition, in 2020, European Commission released hydrogen strategy which states that 24% of world energy demand can be met by clean hydrogen by 2050.
According to regional analysis, the Europe green hydrogen market accounted for $111.6 million in 2020 and is predicted to grow with a CAGR of 54.9% in the projected timeframe.
Green hydrogen is the hydrogen produced by electrolysis of water in which the electricity is generated from low-carbon power sources or renewable energy sources such as solar and wind. Green hydrogen finds application across transport, natural ga, and heat industry. In the transport sector, green hydrogen is used as a fuel cell or internal combustion engine. Also, hydrogen can be used for cooking or heating houses.
The global crisis caused by COVID-19 pandemic has negatively impacted various industries across the world. Similarly, the pandemic has negatively impacted the green hydrogen market up to some extent owing to significant delay in adoption and commercialization of clean hydrogen which plays a major role in clean energy transition. The clean energy projects including green hydrogen require huge capital investments. Due to this, majority of these projects are driven by government investments and policies such as subsidies or taxes. However, pandemic has drastically reduced investments in green hydrogen which has delayed the commercial roll out of clean hydrogen. In addition, major companies that were planning to invest in clean hydrogen technology are likely to scale down or abandon these plans owing to economic uncertainty brought by the COVID-19 pandemic.
Various strategies and investment in green hydrogen are estimated to help the companies recovering from the chaotic situation. For instance, in July 2020, the European Commission launched new strategy named National Hydrogen Strategy in Italy that could help in decarbonizing the economy to meet the European climate targets. In addition, investments in green hydrogen by private stakeholder are estimated to boost the green hydrogen market size during the forecast period. For instance, SNAM, the Italian gas group, is experimenting with 10% mix of hydrogen as a part of natural gas network. In addition, 50% of the planned investments by SNAM during 2020-2024 is towards making its infrastructure “hydrogen ready”.
Earlier, the use of green hydrogen was majorly focused on fuel cell electric vehicles (FCEVs). However, at present, green hydrogen is widely used across various applications. For instance, the use of green hydrogen as an energy carrier for the products such as ammonia, synthetic liquids, and methanol is estimated to drive the demand and lower the cost of green hydrogen value chain. This is because the use of green hydrogen can quickly ramp up or down to compensate the variable renewable energy (VRE) production due to which it offers more flexibility. Green hydrogen could save 830 million tonnes of CO2 which is generated annually when hydrogen is produced from fossil fuels. Green hydrogen generated from renewable energy sources can be stored for longer time and it contains three times as much energy as the fossil fuels.
To know more about global green hydrogen market drivers, get in touch with our analysts here.
The electricity produced from green hydrogen using variable renewable energy (VRE) plant such as wind or solar is two to three times more expensive than grey hydrogen which is produced via steam methane reforming or coal gasification. In addition, the vehicles with fuel cells or hydrogen tanks can cost at least 1.5 to 2 times more than the fossil fuels. In addition, lack of dedicated infrastructure such as presence of only 470 hydrogen refueling stations across the world as of January 2020 is estimated to restrain the green hydrogen market size during the forecast period.
Growing investments in green hydrogen strengthen by global commitments to reduce the carbon emissions are estimated to generate huge opportunities in the green hydrogen industry. For instance, as stated on July 15, 2021, in the NS Energy, the popular energy news provider platform, the investments in hydrogen projects are estimated to be around $500 billion globally over the next decade. The 131 large scale development projects have been announced since February 2021 and total number of green hydrogen in global pipeline has reached 359 according to Hydrogen Council report released in July 2021. In addition, around 70% of the investments are targeted in green hydrogen production using renewable energy sources. Similarly, the hydrogen production capacity is estimated to exceed 10 million tonnes annually.
To know more about global green hydrogen market opportunities, get in touch with our analysts here.
[TYPEGRAPH]
Source: Research Dive Analysis
The alkaline electrolyzer sub-type is anticipated to have a dominant market share and generate a revenue of $5,108.7 million by 2028, growing from $133.3 million in 2020. Alkaline eletrolyzers have an efficiency of more than 70% with purity of hydrogen gas as 99.5%. Alkaline electrolysis is common technology for production of electrolytic hydrogen. The hydrogen and oxygen produced from electrolysis process is 99.99% pure. Alkaline electrolyzers work by transporting hydroxide ions (OH-) through the electrolyte from the cathode to the anode. The green hydrogen is generated from the cathode side. Alkaline solution of electrolyzers have been commercially available for many years.
[APPLICATIONGRAPH]
Source: Research Dive Analysis
The power generation sub-segment is anticipated to have a dominant market share and generate a revenue of $7,184.7 million by 2028, growing from $186.0 million in 2020. The power generation from green hydrogen is facilitated by splitting water into hydrogen and oxygen using electrolyzer powered by renewable energy sources such as wind and solar energy. Thus, the power generated using green hydrogen is identified as a clean energy source that can bring the world to net-zero carbon emission. In this regard, the European Union (EU) plans to scale up the green hydrogen projects and is expected to invest $740 billion by 2050. Hence, the use of green hydrogen in hydrogen-powered electricity turbines can help in power generation at times when there is peak demand for electricity.
[ENDUSEGRAPH]
Source: Research Dive Analysis
The petrochemical sub-segment is anticipated to have a dominant market share and generate a revenue of $4,053.3 million by 2028, growing from $104.5 million in 2020. In petrochemical sector, green hydrogen is used for powering fuel cell vehicles such as electric vehicles and trucks. Green hydrogen is used in the hydrogen fuel cell electric vehicles (FCEVs) that run on electricity generated via green hydrogen. The electricity is generated on-the-go via reaction between hydrogen and ambient oxygen. Also, there are no tailpipe emissions other than water that helps in achieving carbon neutrality. Although the green hydrogen fuel stations are few today, the potential for rapid expansion is estimated to drive the demand for green hydrogen in the petrochemical sector.
[REGIONGRAPH]
Source: Research Dive Analysis
The Europe green hydrogen market accounted $111.6 million in 2020 and is projected to grow with a CAGR of 54.9%. This growth is majorly owing to rapid expansion of low or zero-carbon hydrogen projects in Europe. For instance, on July 2, 2021, Shell, the multinational oil & gas company, started Europe’s largest proton exchange membrane (PEM) hydrogen electrolyzer project at Shell’s Energy and Chemicals Park Rheinland. This will be one of the largest green hydrogen projects in Europe funded by Refhyne European consortium and European Commission. In addition, further plans to expand the capacity of electrolyzer from 10 megawatts to 100 megawatts is estimated to boost the green hydrogen market size in this region. In addition, Shell also aims to produce sustainable aviation fuel (SAV) and liquified renewable natural gas (bio-LNG) in the upcoming years which is estimated to boost the green hydrogen demand in the Europe region.
Asia-Pacific green hydrogen market is anticipated to grow at a CAGR of 55.2%, by registering a revenue of $2,023.9 million by 2028. The substantial growth opportunities for green hydrogen in the Asia-Pacific region is driven by investor interest, government support, and viability of technology. The expansion of green hydrogen projects in this region is largely driven by the countries namely Japan and Australia along with increasing support from China, South Korea, India, and others. For instance, as stated on September 15, 2021, in the Reuters, international news organization, Japan’s largest hydrogen supplier Iwatani Corporation, the industrial engineering company and other five firms are building a green liquified hydrogen supply chain in Japan and Australia that can produce 100 tonnes of green hydrogen per day by 2026.
Source: Research Dive Analysis
Some of the leading green hydrogen market players are Air Liquide, Ballard Power Systems, Enapter, SGH2 Energy Global, LLC, Engie, Plug Power, Inc., Royal Dutch Shell plc., Siemens Energy Global GmbH & Co. KG. AG, Green Hydrogen Systems, and Next Hydrogen.
Porter’s Five Forces Analysis for the Global Green Hydrogen Market:
| Aspect | Particulars |
| Historical Market Estimations | 2019-2020 |
| Base Year for Market Estimation | 2020 |
| Forecast Timeline for Market Projection | 2021-2028 |
| Geographical Scope | North America, Europe, Asia-Pacific, LAMEA |
| Segmentation by Type |
|
| Segmentation by Application |
|
| Segmentation by End-use |
|
| Key Companies Profiled |
|
1.Research Methodology
1.1.Desk Research
1.2.Real time insights and validation
1.3.Forecast model
1.4.Assumptions and forecast parameters
1.4.1.Assumptions
1.4.2.Forecast parameters
1.5.Data sources
1.5.1.Primary
1.5.2.Secondary
2.Executive Summary
2.1.360° summary
2.2.Type trends
2.3.Application trends
2.4.End-use trends
3.Market overview
3.1.Market segmentation & definitions
3.2.Key takeaways
3.2.1.Top investment pockets
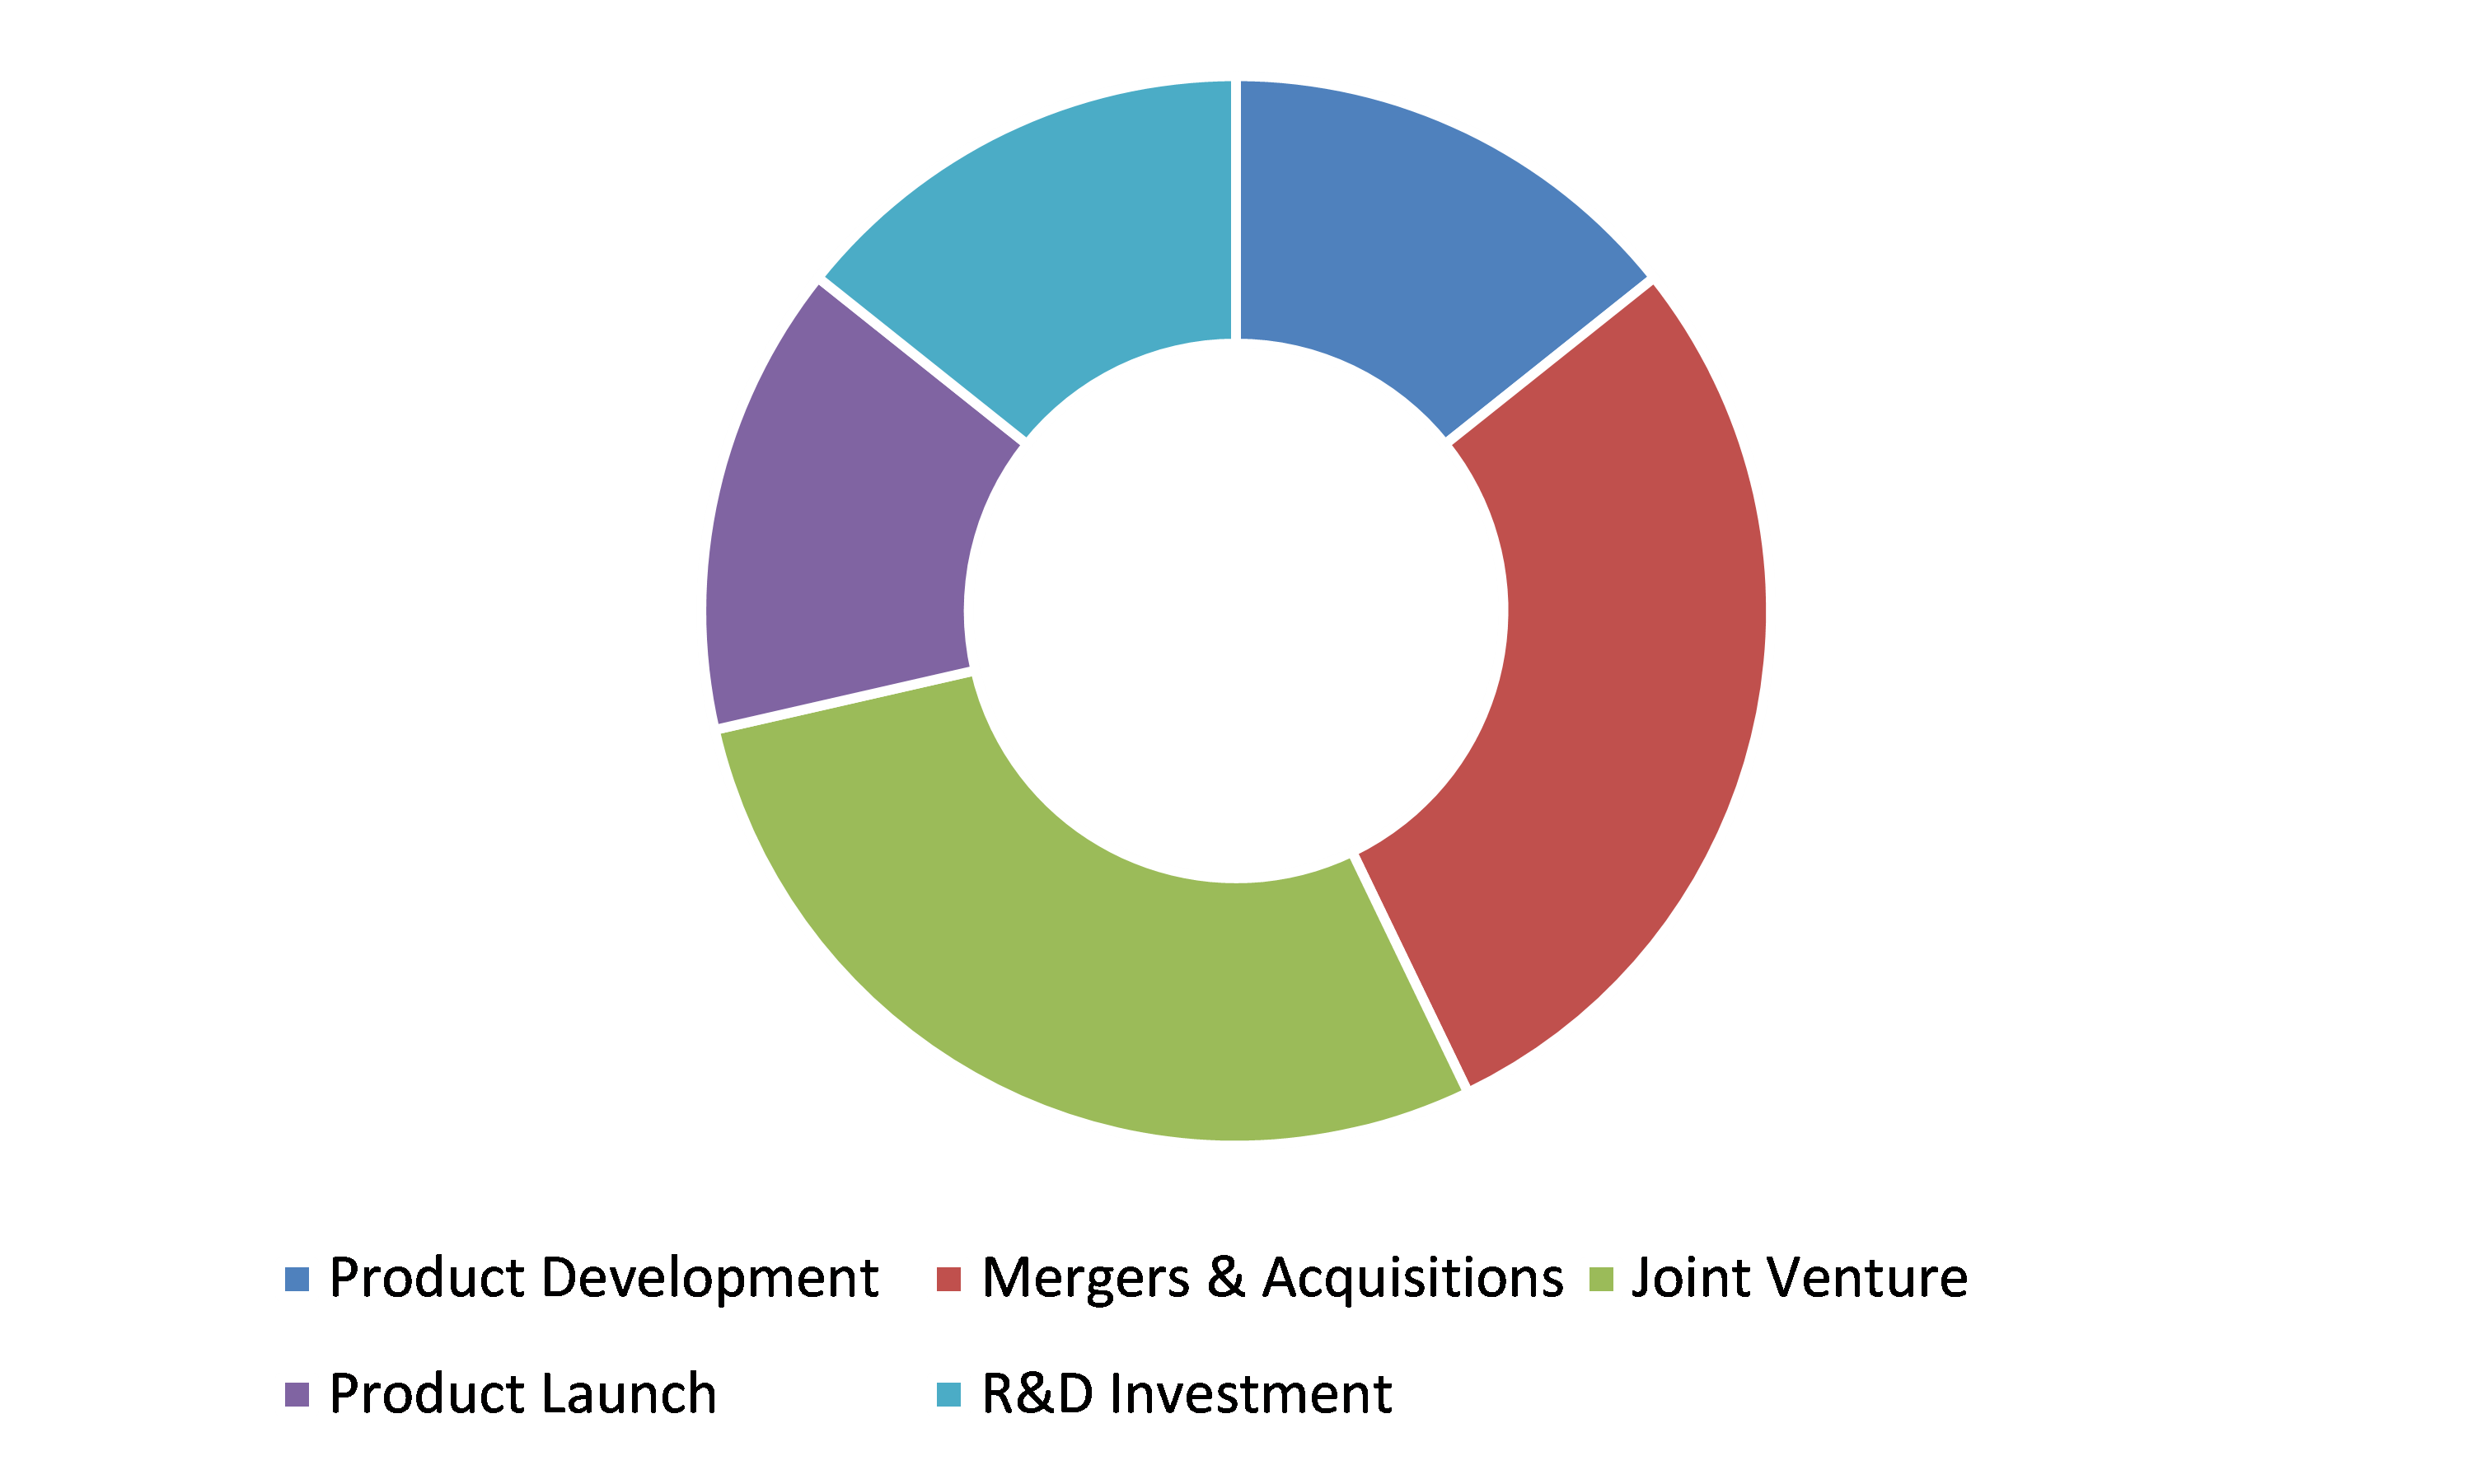
3.2.2.Top winning strategies
3.3.Porter’s five forces analysis
3.3.1.Bargaining power of consumers
3.3.2.Bargaining power of suppliers
3.3.3.Threat of new entrants
3.3.4.Threat of substitutes
3.3.5.Competitive rivalry in the market
3.4.Market dynamics
3.4.1.Drivers
3.4.2.Restraints
3.4.3.Opportunities
3.5.Technology landscape
3.6.Regulatory landscape
3.7.Patent landscape
3.8.Market value chain analysis
3.9.Strategic overview
4.Green Hydrogen Market, by Type
4.1.Proton Exchange Membrane Electrolyzer
4.1.1.Market size and forecast, by region, 2020-2028
4.1.2.Comparative market share analysis, 2020 & 2028
4.2.Alkaline Electrolyzer
4.2.1.Market size and forecast, by region, 2020-2028
4.2.2.Comparative market share analysis, 2020 & 2028
4.3.Solid Oxide Electrolyzer
4.3.1.Market size and forecast, by region, 2020-2028
4.3.2.Comparative market share analysis, 2020 & 2028
5.Green Hydrogen Market, by Application
5.1.Power Generation
5.1.1.Market size and forecast, by region, 2020-2028
5.1.2.Comparative market share analysis, 2020 & 2028
5.2.Transport
5.2.1.Market size and forecast, by region, 2020-2028
5.2.2.Comparative market share analysis, 2020 & 2028
5.3.Others
5.3.1.Market size and forecast, by region, 2020-2028
5.3.2.Comparative market share analysis, 2020 & 2028
6.Green Hydrogen Market, by End-use
6.1.Food & Beverages
6.1.1.Market size and forecast, by region, 2020-2028
6.1.2.Comparative market share analysis, 2020 & 2028
6.2.Medical
6.2.1.Market size and forecast, by region, 2020-2028
6.2.2.Comparative market share analysis, 2020 & 2028
6.3.Chemical
6.3.1.Market size and forecast, by region, 2020-2028
6.3.2.Comparative market share analysis, 2020 & 2028
6.4.Petrochemical
6.4.1.Market size and forecast, by region, 2020-2028
6.4.2.Comparative market share analysis, 2020 & 2028
6.5.Glass
6.5.1.Market size and forecast, by region, 2020-2028
6.5.2.Comparative market share analysis, 2020 & 2028
6.6.Others
6.6.1.Market size and forecast, by region, 2020-2028
6.6.2.Comparative market share analysis, 2020 & 2028
7.Green Hydrogen Market, by Region
7.1.North America
7.1.1.Market size and forecast, by Type, 2020-2028
7.1.2.Market size and forecast, by Application, 2020-2028
7.1.3.Market size and forecast, by End-use 2020-2028
7.1.4.Market size and forecast, by country, 2020-2028
7.1.5.Comparative market share analysis, 2020 & 2028
7.1.6.U.S.
7.1.6.1.Market size and forecast, by Type, 2020-2028
7.1.6.2.Market size and forecast, by Application, 2020-2028
7.1.6.3.Market size and forecast, by End-use 2020-2028
7.1.6.4.Comparative market share analysis, 2020 & 2028
7.1.7.Canada
7.1.7.1.Market size and forecast, by Type, 2020-2028
7.1.7.2.Market size and forecast, by Application, 2020-2028
7.1.7.3.Market size and forecast, by End-use 2020-2028
7.1.7.4.Comparative market share analysis, 2020 & 2028
7.1.8.Mexico
7.1.8.1.Market size and forecast, by Type, 2020-2028
7.1.8.2.Market size and forecast, by Application, 2020-2028
7.1.8.3.Market size and forecast, by End-use 2020-2028
7.1.8.4.Comparative market share analysis, 2020 & 2028
7.2.Europe
7.2.1.Market size and forecast, by Type, 2020-2028
7.2.2.Market size and forecast, by Application, 2020-2028
7.2.3.Market size and forecast, by End-use 2020-2028
7.2.4.Market size and forecast, by country, 2020-2028
7.2.5.Comparative market share analysis, 2020 & 2028
7.2.6.Germany
7.2.6.1.Market size and forecast, by Type, 2020-2028
7.2.6.2.Market size and forecast, by Application, 2020-2028
7.2.6.3.Market size and forecast, by End-use 2020-2028
7.2.6.4.Comparative market share analysis, 2020 & 2028
7.2.7.France
7.2.7.1.Market size and forecast, by Type, 2020-2028
7.2.7.2.Market size and forecast, by Application, 2020-2028
7.2.7.3.Market size and forecast, by End-use 2020-2028
7.2.7.4.Comparative market share analysis, 2020 & 2028
7.2.8.UK
7.2.8.1.Market size and forecast, by Type, 2020-2028
7.2.8.2.Market size and forecast, by Application, 2020-2028
7.2.8.3.Market size and forecast, by End-use 2020-2028
7.2.8.4.Comparative market share analysis, 2020 & 2028
7.2.9.Spain
7.2.9.1.Market size and forecast, by Type, 2020-2028
7.2.9.2.Market size and forecast, by Application, 2020-2028
7.2.9.3.Market size and forecast, by End-use 2020-2028
7.2.9.4.Comparative market share analysis, 2020 & 2028
7.2.10.Rest of Europe
7.2.10.1.Market size and forecast, by Type, 2020-2028
7.2.10.2.Market size and forecast, by Application, 2020-2028
7.2.10.3.Market size and forecast, by End-use 2020-2028
7.2.10.4.Comparative market share analysis, 2020 & 2028
7.3.Asia Pacific
7.3.1.Market size and forecast, by Type, 2020-2028
7.3.2.Market size and forecast, by Application, 2020-2028
7.3.3.Market size and forecast, by End-use 2020-2028
7.3.4.Market size and forecast, by country, 2020-2028
7.3.5.Comparative market share analysis, 2020 & 2028
7.3.6.China
7.3.6.1.Market size and forecast, by Type, 2020-2028
7.3.6.2.Market size and forecast, by Application, 2020-2028
7.3.6.3.Market size and forecast, by End-use 2020-2028
7.3.6.4.Comparative market share analysis, 2020 & 2028
7.3.7.Japan
7.3.7.1.Market size and forecast, by Type, 2020-2028
7.3.7.2.Market size and forecast, by Application, 2020-2028
7.3.7.3.Market size and forecast, by End-use 2020-2028
7.3.7.4.Comparative market share analysis, 2020 & 2028
7.3.8.India
7.3.8.1.Market size and forecast, by Type, 2020-2028
7.3.8.2.Market size and forecast, by Application, 2020-2028
7.3.8.3.Market size and forecast, by End-use 2020-2028
7.3.8.4.Comparative market share analysis, 2020 & 2028
7.3.9.South Korea
7.3.9.1.Market size and forecast, by Type, 2020-2028
7.3.9.2.Market size and forecast, by Application, 2020-2028
7.3.9.3.Market size and forecast, by End-use 2020-2028
7.3.9.4.Comparative market share analysis, 2020 & 2028
7.3.10.Rest of Asia Pacific
7.3.10.1.Market size and forecast, by Type, 2020-2028
7.3.10.2.Market size and forecast, by Application, 2020-2028
7.3.10.3.Market size and forecast, by End-use 2020-2028
7.3.10.4.Comparative market share analysis, 2020 & 2028
7.4.LAMEA
7.4.1.Market size and forecast, by Type, 2020-2028
7.4.2.Market size and forecast, by Application, 2020-2028
7.4.3.Market size and forecast, by End-use 2020-2028
7.4.4.Market size and forecast, by country, 2020-2028
7.4.5.Comparative market share analysis, 2020 & 2028
7.4.6.Brazil
7.4.6.1.Market size and forecast, by Type, 2020-2028
7.4.6.2.Market size and forecast, by Application, 2020-2028
7.4.6.3.Market size and forecast, by End-use 2020-2028
7.4.6.4.Comparative market share analysis, 2020 & 2028
7.4.7.Saudi Arabia
7.4.7.1.Market size and forecast, by Type, 2020-2028
7.4.7.2.Market size and forecast, by Application, 2020-2028
7.4.7.3.Market size and forecast, by End-use 2020-2028
7.4.7.4.Comparative market share analysis, 2020 & 2028
7.4.8.South Africa
7.4.8.1.Market size and forecast, by Type, 2020-2028
7.4.8.2.Market size and forecast, by Application, 2020-2028
7.4.8.3.Market size and forecast, by End-use 2020-2028
7.4.8.4.Comparative market share analysis, 2020 & 2028
7.4.9.Rest of LAMEA
7.4.9.1.Market size and forecast, by Type, 2020-2028
7.4.9.2.Market size and forecast, by Application, 2020-2028
7.4.9.3.Comparative market share analysis, 2020 & 2028
8.Company profiles
8.1.Air Liquide
8.1.1.Business overview
8.1.2.Financial performance
8.1.3.Product portfolio
8.1.4.Recent strategic moves & developments
8.1.5.SWOT analysis
8.2.Ballard Power Systems
8.2.1.Business overview
8.2.2.Financial performance
8.2.3.Product portfolio
8.2.4.Recent strategic moves & developments
8.2.5.SWOT analysis
8.3.Enapter
8.3.1.Business overview
8.3.2.Financial performance
8.3.3.Product portfolio
8.3.4.Recent strategic moves & developments
8.3.5.SWOT analysis
8.4.SGH2 Energy Global, LLC
8.4.1.Business overview
8.4.2.Financial performance
8.4.3.Product portfolio
8.4.4.Recent strategic moves & developments
8.4.5.SWOT analysis
8.5.Engie
8.5.1.Business overview
8.5.2.Financial performance
8.5.3.Product portfolio
8.5.4.Recent strategic moves & developments
8.5.5.SWOT analysis
8.6.Plug Power, Inc.
8.6.1.Business overview
8.6.2.Financial performance
8.6.3.Product portfolio
8.6.4.Recent strategic moves & developments
8.6.5.SWOT analysis
8.7.Royal Dutch Shell plc.
8.7.1.Business overview
8.7.2.Financial performance
8.7.3.Product portfolio
8.7.4.Recent strategic moves & developments
8.7.5.SWOT analysis
8.8.Siemens Energy Global GmbH & Co. KG. AG
8.8.1.Business overview
8.8.2.Financial performance
8.8.3.Product portfolio
8.8.4.Recent strategic moves & developments
8.8.5.SWOT analysis
8.9.Green Hydrogen Systems
8.9.1.Business overview
8.9.2.Financial performance
8.9.3.Product portfolio
8.9.4.Recent strategic moves & developments
8.9.5.SWOT analysis
8.10.Next Hydrogen
8.10.1.Business overview
8.10.2.Financial performance
8.10.3.Product portfolio
8.10.4.Recent strategic moves & developments
8.10.5.SWOT analysis
* Taxes/Fees, If applicable will be added during checkout. All prices in USD.
Have a question ?
Enquire To BuyNeed to add more ?
Request Customization