Activated Partial Thromboplastin Time Test (aPTTT) Market Report
RA00079
Activated Partial Thromboplastin Time Test (aPTTT) Market, by Product type (Consumables, Instruments), by End Use (Clinical Laboratories, Hospitals, Point-of-Care Testing, Others), Regional Analysis (North America, Europe, Asia-Pacific, LAMEA): Global Opportunity Analysis and Industry Forecast, 2019–2026
Update Available On-Demand
Global Activated Partial Thromboplastin Time Test Market Insights 2026:
The activated partial thromboplastin time test market forecast will be $601.2 million by 2026, at a 6.8% CAGR, and has been increasing from $353.0 million in 2018, according to study conducted by Research Dive. European market was valued for $ million in 2018 and is predicted to grow by $184.6 million by 2026. Asia-Pacific market was $81.2 million in 2018 and is predicted to grow by generating a revenue of $143.1 million by 2026.
The activated partial thromboplastin time (APTT) test is majorly used to evaluate clotting factors or coagulation cascade by conducting coagulation testing of the blood. This test specifies the pathways of the blood clotting by measuring the time it takes for clotting. The clot is formed after phospholipid and calcium emulsions are applied to a plasma sample. Fibrinogen, prekallikerin, factors VIII, IX, XI, XII and others are the clotting factors considered in the activated partial thromboplastin test.
Increasing the test devices demand from medical diagnostic testing units is a significant driving factor for global Activated Partial Thromboplastin Time Test Market growth
aPTTT Market trends:
The rapid growth in the healthcare infrastructure and wide usage of activated partial thromboplastin time testing devices in the clinical point-of-care across the globe are significantly driving the growth of the market. The growth in the healthcare infrastructure leading to easy availability of test devices and affordability of the tests are also expected to drive the activated partial thromboplastin time test market growth in the coming years. Moreover, rising occurrences of cardiovascular (COPD) diseases and blood disorders is requiring anticoagulant therapy for the removal of thrombosis or blood clot and is increasing the demand of activated partial thromboplastin tests.
Cost of the test devices is a major restraint factor for the growth of Activated Partial Thromboplastin Time Test Market
The global activated partial thromboplastin time test market is mainly restrained by high cost associated with the treatment methods. Furthermore, lack of skilled people to conduct APTT test is projected to hamper the market growth
Technical advancements in the testing devices will be a major investment opportunity for the growth of Activated Partial Thromboplastin Time Test Market
Technical advancements in the thromboplastin test products coupled with easy availability of devices to conduct tests are expected to drive the growth opportunities of the activated partial thromboplastin time test market in the near future.
Activated Partial Thromboplastin Time Test Market, by Product Type:
Instruments product type is predicted to be the most lucrative till the end of 2026
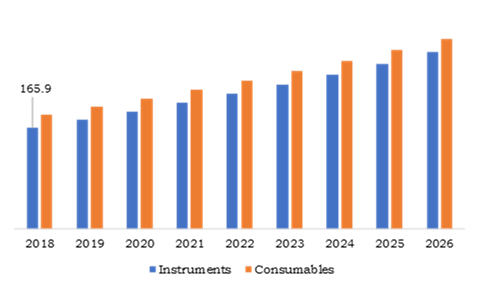
Source: Research Dive Analysis
Instruments product type accounted for $165.9 million in 2018, and it is anticipated to grow with a significant rate of 7.2% CAGR during the forecast time. This growth is because manufacturers are focusing on improving future generation of instruments for diagnosis by improving accuracy, productivity and overall performance with less treatment cost. The consumables product type held the largest market size in 2018 and it is expected to continue its growth during the projected time.
Activated Partial Thromboplastin Time Test Market, by End Use:
Point-of-Care Testing segment is expected to grow with the highest CAGR of 7.7% during the estimated period
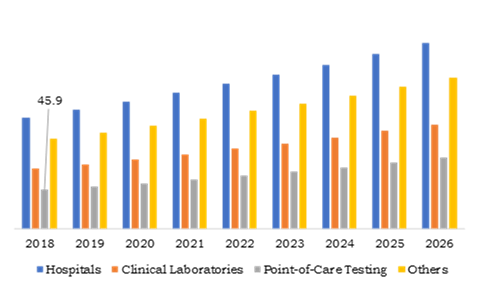
Source: Research Dive Analysis
Point-of-Care testing end use will witness a notable growth during the forecast period. The growth is owing to growing the number of point-of-care testing diagnosis centers across the globe. In addition, growing concerns about personalized medicine among the people coupled with increasing elderly population are expected to drive the growth of the market in the coming years. The market point-of-care testing end use is projected to account for $83.6 million by the 2026 with a CAGR of 7.7%. Hospitals end use accounted for the majority of the activated partial thromboplastin time test market share in 2018, which was over 37.0% and it was valued at $130.6 million in the 2018. This growth is attributed to the increase in the use of APTT test devices for hematological analysis procedure in hospitals. The market for hospitals end use is anticipated to reach $217.6 million by the end of 2026.
Activated Partial Thromboplastin Time Test Market, by Region:
Asia-Pacific region will have huge opportunities for the market investors to grow during the forecast period
The Asia-Pacific market is anticipated to experience substantial growth, generating enormous investment opportunities during the forecast time. This is majorly due to rapid growth in the healthcare infrastructure across the region. The market for Asia-Pacific is estimated to account for $143.1 million by the end of 2026 and is increasing form $81.2 million in 2018.
Europe Activated Partial Thromboplastin Time Test Market Outlook: 2026
Europe region dominated the overall activated partial thromboplastin time test market size in 2018 and registered for $105.9 million and is expected to reach $184.6 million by 2026. This dominance is attributed to the existence of improved diagnostic procedures in the Europe region. Along with Europe, North America region accounted for second highest market size, it was valued at $92.7 million in 2018 and is estimated to account for $156.3 million by 2026. This growth is due to growing awareness of the importance of healthcare among the people in North America region.
To explore more about Activated Partial Thromboplastin Time Test Market, get in touch with our analysts here .
Key Participants in Global Activated Partial Thromboplastin Time Test Market:
Product development and joint ventures are the most common strategies followed by the market players
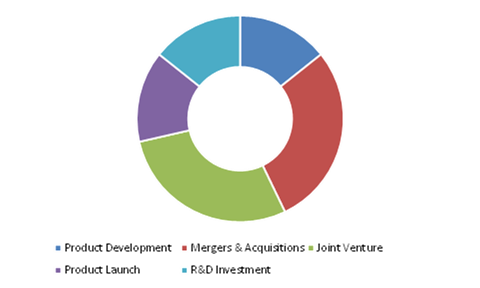
Source: Research Dive Analysis
The major key players of activated partial thromboplastin time test market include Abbott, Danaher, bioMérieux, Inc., Bio-Rad Laboratories, Inc., Siemens Healthcare Private Limited, Hoffmann-La Roche Ltd, Takara Bio Inc., ThermoFisher, Ortho Clinical Diagnostics, HORIBA, Ltd. and Beckman Coulter, Inc. The key players present in the global market are focusing on introducing new technologies and developing new product to increase their share in the global activated partial thromboplastin time test industry.
| Aspect | Particulars |
| Historical Market Estimations | 2018-2019 |
| Base Year for Market Estimation | 2018 |
| Forecast timeline for Market Projection | 2019-2026 |
| Geographical Scope | North America, Europe, Asia-Pacific, LAMEA |
| Segmentation by Product Type |
|
| Segmentation by End Use |
|
| Key Countries Covered | U.S., Canada, Germany, France, Spain, Russia, Japan, China, India, South Korea, Australia, Brazil, and Saudi Arabia |
| Key Companies Profiled |
|
Source: Research Dive Analysis
Q1. What is the size of Activated Partial Thromboplastin Time Test Market?
A. The global activated partial thromboplastin time test market size was over $353.0 million in 2018, and is further anticipated to reach $601.2 million by 2026.
Q2. Which are the leading companies in the Activated Partial Thromboplastin Time Test Market?
A. Abbott, Danaher, Bio-Rad Laboratories, Inc. and ThermoFisher are some of the key players in the global activated partial thromboplastin time test market.
Q3. Which region possesses greater investment opportunities in the coming future?
A. Asia-Pacific possesses great investment opportunities for the investors to witness the most promising growth in the coming years.
Q4. What is the growth rate of Asia-Pacific Market?
A. Asia Pacific activated partial thromboplastin time test market is projected to grow at 7.3% CAGR during the forecast period.
Q5. What are the strategies opted by the leading players in this market?
A. Product development and joint ventures are the key strategies opted by the operating companies in this market.
Q6. Which companies are investing more on R&D practices?
A. Bio-Rad Laboratories, Inc. Danaher and Abbott are investing more on R&D activities for developing new products and technologies.
1. Research Methodology
1.1. Desk Research
1.2. Real time insights and validation
1.3. Forecast model
1.4. Assumptions and forecast parameters
1.4.1. Assumptions
1.4.2. Forecast parameters
1.5. Data sources
1.5.1. Primary
1.5.2. Secondary
2. Executive Summary
2.1. 360° summary
2.2. Product type trends
2.3. End use trends
3. Market Overview
3.1. Market segmentation & definitions
3.2. key takeaways
3.2.1. Top investment pockets
3.2.2. Top winning strategies
3.3. Porter’s five forces analysis
3.3.1. Bargaining power of consumers
3.3.2. Bargaining power of suppliers
3.3.3. Threat of new entrants
3.3.4. Threat of substitutes
3.3.5. Competitive rivalry in the market
3.4. Market dynamics
3.4.1. Drivers
3.4.2. Restraints
3.4.3. Opportunities
3.5. Technology landscape
3.6. Regulatory landscape
3.7. Patent landscape
3.8. Strategic overview
4. Activated Partial Thromboplastin Time Test Market, by Product type
4.1. Consumables
4.1.1. Market size and forecast, by region, 2018-2026
4.1.2. Comparative market share analysis, 2018 & 2026
4.2. Instruments
4.2.1. Market size and forecast, by region, 2018-2026
4.2.2. Comparative market share analysis, 2018 & 2026
5. Activated Partial Thromboplastin Time Test Market, by End use
5.1. Clinical laboratories
5.1.1. Market size and forecast, by region, 2018-2026
5.1.2. Comparative market share analysis, 2018 & 2026
5.2. Hospitals
5.2.1. Market size and forecast, by region, 2018-2026
5.2.2. Comparative market share analysis, 2018 & 2026
5.3. Point-of-Care Testing
5.3.1. Market size and forecast, by region, 2018-2026
5.3.2. Comparative market share analysis, 2018 & 2026
5.4. Others
5.4.1. Market size and forecast, by region, 2018-2026
5.4.2. Comparative market share analysis, 2018 & 2026
6. Activated Partial Thromboplastin Time Test Market, by Region
6.1. North America
6.1.1. Market size and forecast, by product type, 2018-2026
6.1.2. Market size and forecast, by end use, 2018-2026
6.1.3. Market size and forecast, by country, 2018-2026
6.1.4. Comparative market share analysis, 2018 & 2026
6.1.5. U.S.
6.1.5.1. Market size and forecast, by product type, 2018-2026
6.1.5.2. Market size and forecast, by end use, 2018-2026
6.1.5.3. Comparative market share analysis, 2018 & 2026
6.1.6. Canada
6.1.6.1. Market size and forecast, by product type, 2018-2026
6.1.6.2. Market size and forecast, by end use, 2018-2026
6.1.6.3. Comparative market share analysis, 2018 & 2026
6.1.7. Mexico
6.1.7.1. Market size and forecast, by product type, 2018-2026
6.1.7.2. Market size and forecast, by end use, 2018-2026
6.1.7.3. Comparative market share analysis, 2018 & 2026
6.2. Europe
6.2.1. Market size and forecast, by product type, 2018-2026
6.2.2. Market size and forecast, by end use, 2018-2026
6.2.3. Market size and forecast, by country, 2018-2026
6.2.4. Comparative market share analysis, 2018 & 2026
6.2.5. UK
6.2.5.1. Market size and forecast, by product type, 2018-2026
6.2.5.2. Market size and forecast, by end use, 2018-2026
6.2.5.3. Comparative market share analysis, 2018 & 2026
6.2.6. Germany
6.2.6.1. Market size and forecast, by product type, 2018-2026
6.2.6.2. Market size and forecast, by end use, 2018-2026
6.2.6.3. Comparative market share analysis, 2018 & 2026
6.2.7. France
6.2.7.1. Market size and forecast, by product type, 2018-2026
6.2.7.2. Market size and forecast, by end use, 2018-2026
6.2.7.3. Comparative market share analysis, 2018 & 2026
6.2.8. Spain
6.2.8.1. Market size and forecast, by product type, 2018-2026
6.2.8.2. Market size and forecast, by end use, 2018-2026
6.2.8.3. Comparative market share analysis, 2018 & 2026
6.2.9. Italy
6.2.9.1. Market size and forecast, by product type, 2018-2026
6.2.9.2. Market size and forecast, by end use, 2018-2026
6.2.9.3. Comparative market share analysis, 2018 & 2026
6.2.10. Rest of Europe
6.2.10.1. Market size and forecast, by product type, 2018-2026
6.2.10.2. Market size and forecast, by end use, 2018-2026
6.2.10.3. Comparative market share analysis, 2018 & 2026
6.3. Asia Pacific
6.3.1. Market size and forecast, by product type, 2018-2026
6.3.2. Market size and forecast, by end use, 2018-2026
6.3.3. Market size and forecast, by country, 2018-2026
6.3.4. Comparative market share analysis, 2018 & 2026
6.3.5. China
6.3.5.1. Market size and forecast, by product type, 2018-2026
6.3.5.2. Market size and forecast, by end use, 2018-2026
6.3.5.3. Comparative market share analysis, 2018 & 2026
6.3.6. Japan
6.3.6.1. Market size and forecast, by product type, 2018-2026
6.3.6.2. Market size and forecast, by end use, 2018-2026
6.3.6.3. Comparative market share analysis, 2018 & 2026
6.3.7. India
6.3.7.1. Market size and forecast, by product type, 2018-2026
6.3.7.2. Market size and forecast, by end use, 2018-2026
6.3.7.3. Comparative market share analysis, 2018 & 2026
6.3.8. Australia
6.3.8.1. Market size and forecast, by product type, 2018-2026
6.3.8.2. Market size and forecast, by end use, 2018-2026
6.3.8.3. Comparative market share analysis, 2018 & 2026
6.3.9. South Korea
6.3.9.1. Market size and forecast, by product type, 2018-2026
6.3.9.2. Market size and forecast, by end use, 2018-2026
6.3.9.3. Comparative market share analysis, 2018 & 2026
6.3.10. Rest of Asia Pacific
6.3.10.1. Market size and forecast, by product type, 2018-2026
6.3.10.2. Market size and forecast, by end use, 2018-2026
6.3.10.3. Comparative market share analysis, 2018 & 2026
6.4. LAMEA
6.4.1. Market size and forecast, by product type, 2018-2026
6.4.2. Market size and forecast, by end use, 2018-2026
6.4.3. Market size and forecast, by country, 2018-2026
6.4.4. Comparative market share analysis, 2018 & 2026
6.4.5. Brazil
6.4.5.1. Market size and forecast, by product type, 2018-2026
6.4.5.2. Market size and forecast, by end use, 2018-2026
6.4.5.3. Comparative market share analysis, 2018 & 2026
6.4.6. Saudi Arabia
6.4.6.1. Market size and forecast, by product type, 2018-2026
6.4.6.2. Market size and forecast, by end use, 2018-2026
6.4.6.3. Comparative market share analysis, 2018 & 2026
6.4.7. South Africa
6.4.7.1. Market size and forecast, by product type, 2018-2026
6.4.7.2. Market size and forecast, by end use, 2018-2026
6.4.7.3. Comparative market share analysis, 2018 & 2026
6.4.8. Rest of LAMEA
6.4.8.1. Market size and forecast, by product type, 2018-2026
6.4.8.2. Market size and forecast, by end use, 2018-2026
6.4.8.3. Comparative market share analysis, 2018 & 2026
7. Company Profiles
7.1. Abbott
7.1.1. Business overview
7.1.2. Financial performance
7.1.3. Product portfolio
7.1.4. Recent strategic moves & developments
7.1.5. SWOT analysis
7.2. Danaher
7.2.1. Business overview
7.2.2. Financial performance
7.2.3. Product portfolio
7.2.4. Recent strategic moves & developments
7.2.5. SWOT analysis
7.3. bioMérieux, Inc.
7.3.1. Business overview
7.3.2. Financial performance
7.3.3. Product portfolio
7.3.4. Recent strategic moves & developments
7.3.5. SWOT analysis
7.4. Bio-Rad Laboratories, Inc.
7.4.1. Business overview
7.4.2. Financial performance
7.4.3. Product portfolio
7.4.4. Recent strategic moves & developments
7.4.5. SWOT analysis
7.5. Siemens Healthcare Private Limited
7.5.1. Business overview
7.5.2. Financial performance
7.5.3. Product portfolio
7.5.4. Recent strategic moves & developments
7.5.5. SWOT analysis
7.6. Hoffmann-La Roche Ltd
7.6.1. Business overview
7.6.2. Financial performance
7.6.3. Product portfolio
7.6.4. Recent strategic moves & developments
7.6.5. SWOT analysis
7.7. Takara Bio Inc.
7.7.1. Business overview
7.7.2. Financial performance
7.7.3. Product portfolio
7.7.4. Recent strategic moves & developments
7.7.5. SWOT analysis
7.8. ThermoFisher
7.8.1. Business overview
7.8.2. Financial performance
7.8.3. Product portfolio
7.8.4. Recent strategic moves & developments
7.8.5. SWOT analysis
7.9. Ortho Clinical Diagnostics
7.9.1. Business overview
7.9.2. Financial performance
7.9.3. Product portfolio
7.9.4. Recent strategic moves & developments
7.9.5. SWOT analysis
7.10. HORIBA, Ltd.
7.10.1. Business overview
7.10.2. Financial performance
7.10.3. Product portfolio
7.10.4. Recent strategic moves & developments
7.10.5. SWOT analysis
7.11. Johnson & Johnson Services, Inc.
7.11.1. Business overview
7.11.2. Financial performance
7.11.3. Product portfolio
7.11.4. Recent strategic moves & developments
7.11.5. SWOT analysis
7.12. Beckman Coulter, Inc.
7.12.1. Business overview
7.12.2. Financial performance
7.12.3. Product portfolio
7.12.4. Recent strategic moves & developments
7.12.5. SWOT analysis
Clot formation is the final result of contact between several plasma proteins, culminating in the transfer of fibrinogen to fibrin and the cross-linking of fibrin by activated factor XIII, which stabilizes the formed clot. Deficit or systemic abnormality of the factors involved in these responses triggers bleeding disorders. Natural regulators of clotting agents include antithrombin III, S protein, and C protein.
When triggered, these proteins inactivate particular clotting factors, provide a regulating function to regulate the coagulation reaction and limit the spread of the clot. Physiological or environmental antagonists should not be confused with acquired coagulation factors inhibitors which are mentioned in this study. Coagulation factor antagonists, also known as circulating anticoagulants, are antibodies that neutralize particular clotting proteins and interact with their normal function.
Uses of aPTT
Partial thromboplastin time (PTT) and active partial thromboplastin time (aPTT) are used to measure the same functions; additionally, an activator is introduced in aPTT that accelerates the process of clotting and results in a wider reference range. APTT is considered to be a more sensitive version of PTT and is used to monitor the patient's response to heparin therapy.
Activated partial thromboplastin time (APTT) is a procedure conducted to examine bleeding complications and to track patients taking an anti-thrombin-inhibiting medication such as heparin and thrombin.
How it works?
The APTT procedure requires blood that is decalcified to avoid clotting before the test starts. The plasma is isolated by a centrifugation cycle. (Ionized) Calcium and triggering compounds are applied to the plasma to initiate the inner process of the coagulation cascade. The same compounds are: kaolin (hydrated aluminum silicate) and cephaline. Kaolin is used to activate the contact-dependent factor XII, and cephaline replacements for platelet phospholipids. Partial thromboplastin period is the time it takes to shape a clot estimated in seconds. Usually, in 35 seconds, the sample will clot.
Market Overview
According to a report by Research Dive on the activated partial thromboplastin test market forecast will be $601.2 million by 2026, at a 6.8% CAGR, and has been increasing from $353.0 million in 2018. Geographically, the Activated Partial Thromboplastine Test market is classified into North America, Americas, Latin America, South Asia, East Asia, Oceania, Middle East and Africa. North America is influential in the industry due to improved surgical diagnostic procedures, supportive policies by the World Health Organization, expanded research and development efforts, and so on. Europe is the next major contributor to the development of the Activated Partial Thromboplastine Test due to a high level of health education, improved per capita income and other prices.
Key Companies Profiled
- Abbott
- Danaher
- bioMérieux, Inc.
- Bio-Rad Laboratories, Inc.
- Siemens Healthcare Private Limited
- Hoffmann-La Roche Ltd
- Takara Bio Inc.
- ThermoFisher
- Ortho Clinical Diagnostics
- HORIBA, Ltd.
- Beckman Coulter, Inc.
Key Strategies
Various organic and inorganic growth strategies adopted by the key players, such as new product launches, agreements, partnerships, expansions, mergers and acquisitions, joint ventures, and others, to strengthen their position in this market.
Personalize this research
- Triangulate with your own data
- Request your format and definition
- Get a deeper dive on a specific application, geography, customer or competitor
- + 1-888-961-4454 Toll - Free
- support@researchdive.com
