Toll Free : + 1-888-961-4454 | Int'l : + 91 (788) 802-9103 | support@researchdive.com
IC2009399 |
Pages: 284 |
Aug 2020 |
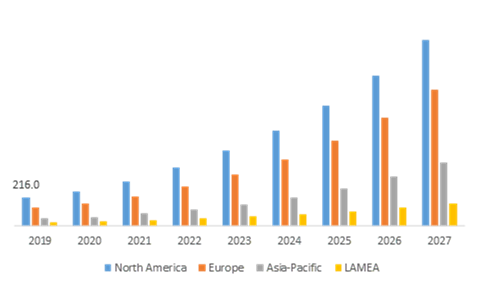
The global edge AI software market accounted for $435.9 million in 2019 and is predicted to generate a revenue of $3,093.2 million by 2027 with a CAGR of 28.8% in the estimated period. North America accounted for $216.0 million in 2019 and is predicted to grow with a CAGR of 27.5% in the estimated period. Rise in the utilisation of edge AI software is predicted to be the major driving factor for the global market in the estimated period.
Edge AI is defined as a process in which AI algorithms such as data from sensors or signals are processed on hardware and the software used for this purpose is known as edge AI software. Edge AI software allows real time operation such as data creation and decision actions. Edge AI software are utilized in production of wearables that enhance battery life of wearable devices. In addition, edge AI software avoids complications of streaming and can store large amount of data to the cloud that in turn enhances the privacy of the stored data. Besides, this software is utilized in telecom and enterprise segment that supports multi-cloud and enables to run edge AI analytical software that helps to gain complete action in less time.
The pandemic has created a positive impact on the global edge AI software market. It has been noticed that due to pandemic most of the organisations are shut down. The manufacturing units have been impacted negatively due to the pandemic. Most companies are preferring to adopt edge AI software for complete automation in work processes to run the operational flow smoothly, which is predicted to boost the global market in the estimated period.
Edge AI software are utilized in telecom sector owing to the advantages such as 360 insight capability across the connected systems, contextual push intelligence, availability of productivity tools in one place, and others. Growing number of internet users around the globe has led to the modernization of connected networks so that edge AI software can deliver enhanced working capacity. Telecom companies used to operate network on hardware systems earlier, but with the edge AI software, telecom industry can handle growing number of connected devices with ease. Edge AI software is utilized in connected vehicles as it helps to process data immediately with safe hardware that is utilized to run the connected cars or autonomous vehicles. For instance, Pony.AI and Bosch have collaborated on fleet management of automobile vehicles with the help of AI software. Edge AI software is utilized in management of various data which in turn enables business to improve speed, bandwidth, enhanced data analysis, improved individual experience, and decrease latency, which is predicted to boost the global market in the estimated period.
Edge AI software are helpful in business enhancement but ethical issues are restricting the use of edge AI software. Moreover, the edge AI software is a new technology for most organisations. The lack of skilled labour in this field is predicted to hinder the market growth in the estimated period.
Source: Research Dive Analysis
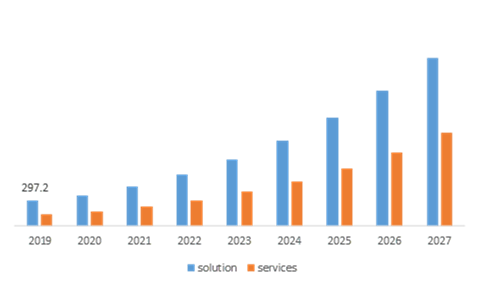
Solution sub-segment is predicted to have the highest market share. Solution segment accounted for $297.2 million in 2019 and is predicted to grow with a CAGR of 27.9% in the estimated period. Solution component helps to captured data and it can be utilized for designing models, application scenarios as well as the application software that enables to run edge AI on different IoT devices, which is predicted to drive the sub-segment market in the estimated period.
Source: Research Dive Analysis
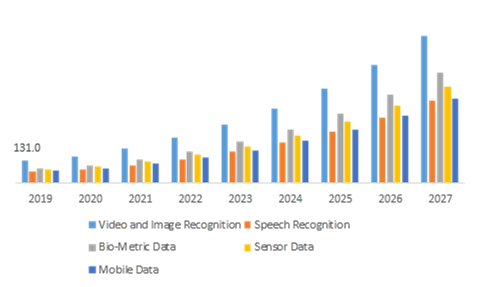
Video and image recognition sub-segment are predicted to grow enormously. Video and image recognition sub-segment accounted for $131.0 million in 2019 and is predicted to grow with a CAGR of 27.9% in the estimated period. Wide utilization of video and image data source for identification of suspects in AI accelerated systems efficiently for analysing and processing of videos and images in various places is predicted to drive the sub-segment market in the forecast period.
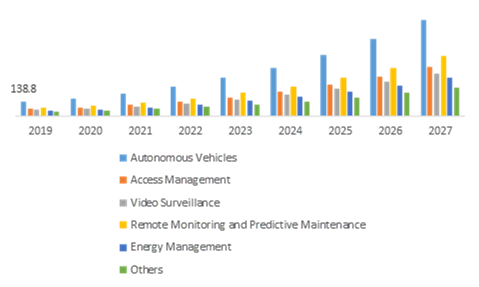
Autonomous vehicles sub-segment is predicted dominate the market till 2027
Source: Research Dive Analysis
Autonomous vehicles sub-segment is predicted to have maximum market share in the estimated period. Autonomous vehicles sub-segment accounted for $138.8 million in 2019 and is predicted to grow with a CAGR of 28.2% in the estimated period. Increase in the production of autonomous vehicle to minimize road accidents and improved transportation systems are significantly driving the adoption of edge AI software for autonomous vehicles application in the estimated period.
Source: Research Dive Analysis
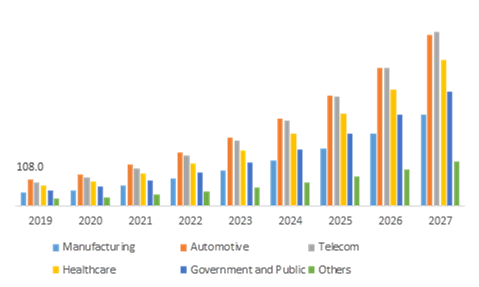
Automotive sub-segment is predicted to have highest market share in the estimated period. Automotive segment accounted for $108.0 million in 2019 and is predicted to grow with a CAGR of 27.7% in the estimated period. Wide utilization of edge AI software in automotive sectors for various purposes such as manufacturing of autonomous vehicles, develop sustainable transportation and production automotive parts is predicted to boost the sub-segment market in the estimated period.
Source: Research Dive Analysis
North America region market is predicted to have the maximum market share in the estimated period. North America accounted for $216.0 million in 2019 and is predicted to grow with a CAGR of 27.5% in the estimated period. Presence of large number of companies and adoption of various advanced technology is predicted to boost the region market in the estimated period. Favourable government initiatives to support the development of edge AI software in North America region is expected to create huge growth opportunities in the coming years.
Source: Research Dive Analysis
The major key player in the global edge AI software market are International Business Machine (IBM), Microsoft,, Foghorn Systems In Vision AI, Anagog,, Amazon Web Services, TIBCO, Imagimob AB., Veea Inc., Tact.ai Technologies Inc. among other. For instance, NuTonomy is a MIT spin-off technology startup company and engaged in the development of driverless cars by utilizing nuTonomy’s technology. This technology provides flexible and human-like handling of automobiles without errors.
Bargaining Power of Suppliers: The switching cost from one supplier to another is projected to be low. The bargaining power of suppliers is very moderate.
Bargaining Power of Consumers: In this market, the concentration of buyers is high. The bargaining power of consumers is moderate.
Threat of New Entrants: Huge initial investments are essential to start a new edge AI software organization. The threat of new entrants is Low.
Threat of Substitutes: This market has numerous alternatives of products; moreover, technology also offers high switching costs for clients. The threat of substitutes is high.
Competitive Rivalry in the Market: The edge AI software market has only major players to sell their products and it becomes difficult for small and medium enterprises and local manufacturer to get into the market. The competitive rivalry in the industry is Moderate.
| Aspect | Particulars |
| Historical Market Estimations | 2019-2020 |
| Base Year for Market Estimation | 2019 |
| Forecast timeline for Market Projection | 2019-2027 |
| Geographical Scope | North America, Europe, Asia-Pacific, LAMEA |
| Segmentation by Component |
|
| Segmentation by Data Source |
|
| Segmentation by Application |
|
| Segmentation by End-User |
|
| Key Countries Covered | U.S., Canada, Mexico, Germany, France, UK, Italy, Spain, Russia, Rest of Europe, China, Japan, India, Australia, South Korea, Latin America, Middle East, Africa |
| Key Companies Profiled |
|
1. Research Methodology
1.1. Desk Research
1.2. Real time insights and validation
1.3. Forecast model
1.4. Assumptions and forecast parameters
1.4.1. Assumptions
1.4.2. Forecast parameters
1.5. Data sources
1.5.1. Primary
1.5.2. Secondary
2. Executive Summary
2.1. 360° summary
2.2. Component trends
2.3. Data source trends
2.4. Data Source trends
2.5. End-Use trends
3. Market overview
3.1. Market segmentation & definitions
3.2. Key takeaways
3.2.1. Top investment pockets
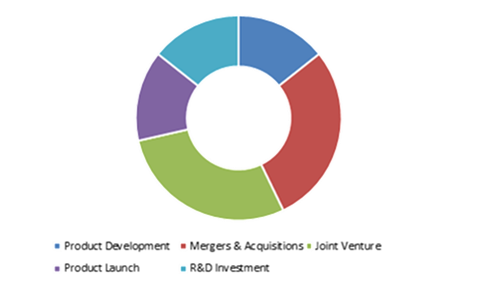
3.2.2. Top winning strategies
3.3. Porter’s five forces analysis
3.3.1. Bargaining power of consumers
3.3.2. Bargaining power of suppliers
3.3.3. Threat of new entrants
3.3.4. Threat of substitutes
3.3.5. Competitive rivalry in the market
3.4. Market dynamics
3.4.1. Drivers
3.4.2. Restraints
3.4.3. Opportunities
3.5. Technology landscape
3.6. Regulatory landscape
3.7. Patent landscape
3.8. Pricing overview
3.8.1. By component
3.8.2. By data Source
3.8.3. By application
3.8.4. By end user
3.8.5. By region
3.9. Market value chain analysis
3.9.1. Stress point analysis
3.9.2. Raw material analysis
3.9.3. Manufacturing process
3.9.4. Distribution channel analysis
3.9.5. Operating vendors
3.9.5.1. Raw material suppliers
3.9.5.2. Product manufacturers
3.9.5.3. Product distributors
3.10. Strategic overview
4. Edge AI Software Market, by Component
4.1. Solution
4.1.1. Market size and forecast, by region, 2019-2026
4.1.2. Comparative market share analysis, 2019-2026
4.2. Services
4.2.1. Market size and forecast, by region, 2019-2026
4.2.2. Comparative market share analysis, 2019-2026
5. Edge AI Software Market, by Data Source
5.1. Video and Image Recognition
5.1.1. Market size and forecast, by region, 2019-2026
5.1.2. Comparative market share analysis, 2019-2026
5.2. Speech Recognition
5.2.1. Market size and forecast, by region, 2019-2026
5.2.2. Comparative market share analysis, 2019-2026
5.3. Bio-Metric Data
5.3.1. Market size and forecast, by region, 2019-2026
5.3.2. Comparative market share analysis, 2019-2026
5.4. Sensor Data
5.4.1. Market size and forecast, by region, 2019-2026
5.4.2. Comparative market share analysis, 2019-2026
5.5. Mobile Data
5.5.1. Market size and forecast, by region, 2019-2026
5.5.2. Comparative market share analysis, 2019-2026
6. Edge AI Software Market, by Application
6.1. Autonomous Vehicles
6.1.1. Market size and forecast, by region, 2019-2026
6.1.2. Comparative market share analysis, 2019-2026
6.2. Access Management
6.2.1. Market size and forecast, by region, 2019-2026
6.2.2. Comparative market share analysis, 2019-2026
6.3. Video Surveillance
6.3.1. Market size and forecast, by region, 2019-2026
6.3.2. Comparative market share analysis, 2019-2026
6.4. Remote Monitoring and Predictive Maintenance
6.4.1. Market size and forecast, by region, 2019-2026
6.4.2. Comparative market share analysis, 2019-2026
6.5. Energy Management
6.5.1. Market size and forecast, by region, 2019-2026
6.5.2. Comparative market share analysis, 2019-2026
6.6. Others
6.6.1. Market size and forecast, by region, 2019-2026
6.6.2. Comparative market share analysis, 2019-2026
7. Edge AI Software Market, by End User
7.1. Manufacturing
7.1.1. Market size and forecast, by region, 2019-2026
7.1.2. Comparative market share analysis, 2019-2026
7.2. Automotive
7.2.1. Market size and forecast, by region, 2019-2026
7.2.2. Comparative market share analysis, 2019-2026
7.3. Telecom
7.3.1. Market size and forecast, by region, 2019-2026
7.3.2. Comparative market share analysis, 2019-2026
7.4. Healthcare
7.4.1. Market size and forecast, by region, 2019-2026
7.4.2. Comparative market share analysis, 2019-2026
7.5. Government and Public
7.5.1. Market size and forecast, by region, 2019-2026
7.5.2. Comparative market share analysis, 2019-2026
7.6. Others
7.6.1. Market size and forecast, by region, 2019-2026
7.6.2. Comparative market share analysis, 2019-2026
8. Edge AI Software Market, by Region
8.1. North Region
8.1.1. Market size and forecast, by Component, 2019-2026
8.1.2. Market size and forecast, by Data Source, 2019-2026
8.1.3. Market size and forecast, by Application, 2019-2026
8.1.4. Market size and forecast, by End User, 2019-2026
8.1.5. Market size and forecast, by country, 2019-2026
8.1.6. Comparative market share analysis, 2019-2026
8.1.7. U.S
8.1.8. Market size and forecast, by Component, 2019-2026
8.1.9. Market size and forecast, by Data Source, 2019-2026
8.1.10. Market size and forecast, by Application, 2019-2026
8.1.11. Market size and forecast, by End User, 2019-2026
8.1.12. Comparative market share analysis, 2019-2026
8.1.13. Canada
8.1.14. Market size and forecast, by Component, 2019-2026
8.1.15. Market size and forecast, by Data Source, 2019-2026
8.1.16. Market size and forecast, by Application, 2019-2026
8.1.17. Market size and forecast, by End User, 2019-2026
8.1.18. Comparative market share analysis, 2019-2026
8.1.19. Mexico
8.1.20. Market size and forecast, by Component, 2019-2026
8.1.21. Market size and forecast, by Data Source, 2019-2026
8.1.22. Market size and forecast, by Application, 2019-2026
8.1.23. Market size and forecast, by End User, 2019-2026
8.1.24. Comparative market share analysis, 2019-2026
8.2. Europe
8.2.1. Market size and forecast, by Component, 2019-2026
8.2.2. Market size and forecast, by Data Source, 2019-2026
8.2.3. Market size and forecast, by Application, 2019-2026
8.2.4. Market size and forecast, by End User, 2019-2026
8.2.5. Comparative market share analysis, 2019-2026
8.2.6. Germany
8.2.7. Market size and forecast, by Component, 2019-2026
8.2.8. Market size and forecast, by Data Source, 2019-2026
8.2.9. Market size and forecast, by Application, 2019-2026
8.2.10. Market size and forecast, by End User, 2019-2026
8.2.10.1. Comparative market share analysis, 2019-2026
8.2.11. France
8.2.11.1. Market size and forecast, by Component, 2019-2026
8.2.11.2. Market size and forecast, by Data Source, 2019-2026
8.2.11.3. Market size and forecast, by Application, 2019-2026
8.2.11.4. Market size and forecast, by End User, 2019-2026
8.2.11.5. Comparative market share analysis, 2019-2026
8.2.12. Italy
8.2.12.1. Market size and forecast, by Component, 2019-2026
8.2.12.2. Market size and forecast, by Data Source, 2019-2026
8.2.12.3. Market size and forecast, by Application, 2019-2026
8.2.12.4. Market size and forecast, by End User, 2019-2026
8.2.12.5. Comparative market share analysis, 2019-2026
8.2.13. Rest of Europe
8.2.13.1. Market size and forecast, by Component, 2019-2026
8.2.13.2. Market size and forecast, by Data Source, 2019-2026
8.2.13.3. Market size and forecast, by Application, 2019-2026
8.2.13.4. Market size and forecast, by End User, 2019-2026
8.2.13.5. Comparative market share analysis, 2019-2026
8.3. Asia-Pacific
8.3.1. Market size and forecast, by Component, 2019-2026
8.3.2. Market size and forecast, by Data Source, 2019-2026
8.3.3. Market size and forecast, by Application, 2019-2026
8.3.4. Market size and forecast, by End User, 2019-2026
8.3.5. Market size and forecast, by country, 2019-2026
8.3.6. Comparative market share analysis, 2019-2026
8.3.7. China
8.3.7.1. Market size and forecast, by Component, 2019-2026
8.3.7.2. Market size and forecast, by Data Source, 2019-2026
8.3.7.3. Market size and forecast, by Application, 2019-2026
8.3.7.4. Market size and forecast, by End User, 2019-2026
8.3.7.5. Comparative market share analysis, 2019-2026
8.3.8. India
8.3.8.1. Market size and forecast, by Component, 2019-2026
8.3.8.2. Market size and forecast, by Data Source, 2019-2026
8.3.8.3. Market size and forecast, by Application, 2019-2026
8.3.8.4. Market size and forecast, by End User, 2019-2026
8.3.8.5. Comparative market share analysis, 2019-2026
8.3.9. Japan
8.3.9.1. Market size and forecast, by Component, 2019-2026
8.3.9.2. Market size and forecast, by Data Source, 2019-2026
8.3.9.3. Market size and forecast, by Application, 2019-2026
8.3.9.4. Market size and forecast, by End User, 2019-2026
8.3.9.5. Comparative market share analysis, 2019-2026
8.3.10. South Korea
8.3.10.1. Market size and forecast, by Component, 2019-2026
8.3.10.2. Market size and forecast, by Data Source, 2019-2026
8.3.10.3. Market size and forecast, by Application, 2019-2026
8.3.10.4. Market size and forecast, by End User, 2019-2026
8.3.10.5. Comparative market share analysis, 2019-2026
8.3.11. Australia
8.3.11.1. Market size and forecast, by Component, 2019-2026
8.3.11.2. Market size and forecast, by Data Source, 2019-2026
8.3.11.3. Market size and forecast, by Application, 2019-2026
8.3.11.4. Market size and forecast, by End User, 2019-2026
8.3.11.5. Comparative market share analysis, 2019-2026
8.3.12. Rest of Asia Pacific
8.3.12.1. Market size and forecast, by Component, 2019-2026
8.3.12.2. Market size and forecast, by Data Source, 2019-2026
8.3.12.3. Market size and forecast, by Application, 2019-2026
8.3.12.4. Market size and forecast, by End User, 2019-2026
8.3.12.5. Comparative market share analysis, 2019-2026
8.4. LAMEA
8.4.1. Market size and forecast, by Component, 2019-2026
8.4.2. Market size and forecast, by Data Source, 2019-2026
8.4.3. Market size and forecast, by Application, 2019-2026
8.4.4. Market size and forecast, by End User, 2019-2026
8.4.5. Market size and forecast, by country, 2019-2026
8.4.6. Comparative market share analysis, 2019-2026
8.4.7. Latin America
8.4.7.1. Market size and forecast, by Component, 2019-2026
8.4.7.2. Market size and forecast, by Data Source, 2019-2026
8.4.7.3. Market size and forecast, by Application, 2019-2026
8.4.7.4. Market size and forecast, by End User, 2019-2026
8.4.7.5. Comparative market share analysis, 2019-2026
8.4.8. Middle East
8.4.8.1. Market size and forecast, by Component, 2019-2026
8.4.8.2. Market size and forecast, by Data Source, 2019-2026
8.4.8.3. Market size and forecast, by Application, 2019-2026
8.4.8.4. Market size and forecast, by End User, 2019-2026
8.4.8.5. Comparative market share analysis, 2019-2026
8.4.9. Africa
8.4.9.1. Market size and forecast, by Component, 2019-2026
8.4.9.2. Market size and forecast, by Data Source, 2019-2026
8.4.9.3. Market size and forecast, by Application, 2019-2026
8.4.9.4. Market size and forecast, by End User, 2019-2026
8.4.9.5. Comparative market share analysis, 2019-2026
9. Company profiles
9.1. International Business Machine (IBM),
9.1.1. Business overview
9.1.2. Financial performance
9.1.3. Product portfolio
9.1.4. Recent strategic moves & developments
9.1.5. SWOT analysis
9.2. Microsoft.
9.2.1. Business overview
9.2.2. Financial performance
9.2.3. Product portfolio
9.2.4. Recent strategic moves & developments
9.2.5. SWOT analysis
9.3. Foghorn Systems
9.3.1. Business overview
9.3.2. Financial performance
9.3.3. Product portfolio
9.3.4. Recent strategic moves & developments
9.3.5. SWOT analysis
9.4. In Vision AI.
9.4.1. Business overview
9.4.2. Financial performance
9.4.3. Product portfolio
9.4.4. Recent strategic moves & developments
9.4.5. SWOT analysis
9.5. Anagog.
9.5.1. Business overview
9.5.2. Financial performance
9.5.3. Product portfolio
9.5.4. Recent strategic moves & developments
9.5.5. SWOT analysis
9.6. Amazon Web Services
9.6.1. Business overview
9.6.2. Financial performance
9.6.3. Product portfolio
9.6.4. Recent strategic moves & developments
9.6.5. SWOT analysis
9.7. TIBCO.
9.7.1. Business overview
9.7.2. Financial performance
9.7.3. Product portfolio
9.7.4. Recent strategic moves & developments
9.7.5. SWOT analysis
9.8. Imagimob AB
9.8.1. Business overview
9.8.2. Financial performance
9.8.3. Product portfolio
9.8.4. Recent strategic moves & developments
9.8.5. SWOT analysis
9.9. Veea Inc
9.9.1. Business overview
9.9.2. Financial performance
9.9.3. Product portfolio
9.9.4. Recent strategic moves & developments
9.9.5. SWOT analysis
9.10. Tact.ai Technologies Inc
9.10.1. Business overview
9.10.2. Financial performance
9.10.3. Product portfolio
9.10.4. Recent strategic moves & developments
9.10.5. SWOT analysis
* Taxes/Fees, If applicable will be added during checkout. All prices in USD.
Have a question ?
Enquire To BuyNeed to add more ?
Request Customization