Toll Free : + 1-888-961-4454 | Int'l : + 91 (788) 802-9103 | support@researchdive.com
IC2008349 |
Pages: 294 |
May 2021 |
The global location analytics market is predicted to garner $38,078.9 million in the 2020–2028 timeframe, growing from $11,900.3 million in 2020 at a healthy CAGR of 15.8%.
The emergence of Internet of Things (IoT) and the growing importance of locational data for many organizations and governments are resulting in increased use of location analytics solutions.
However, awareness and expertise about the functioning of location analytic tools are scarce among organizations. This might restrain the market growth during the forecast period.
According to the regional analysis of the market, the Asia-Pacific location analytics market is anticipated to grow at a CAGR of 16.5% by generating a revenue of $9,728.9 million during the review period.
Location analytics states to the business intelligence (BI) that a system carries out to comprehend understandings from location-based enterprise facts. It lets in corporations and businesses merge 3D facts with traditional BI information. This spatial locational data is collected using different data sources. These resources include cameras, sensors cellular devices, global positioning systems (GPS), and social media channels. Location analytics adds a layer of geographical information to business’s to extract more valuable insights.
Though the novel coronavirus pandemic has had a devastating effect on several industries, the location analytics market has been found to experience significant growth during this period. Locational data is playing an important part in the controlling of state emergency services during the coronavirus pandemic. The healthcare sector have been experiencing various difficulties and challenges. Moreover, ever since the pandemic outrage, hospitals were running at their maximum capacity. Also, the shortage of ventilators, masks, oxygen cylinders, and other important sanitary materials has become a challenge. Location analytics has become a major tool for facing these challenges as it provides useful data for better strategies. GIS has helped scientists to identify the occurrence of the disease against multiple parameters, like environment, geographic conditions, and previous occurrences of the virus, to understand and know the origin of outbreak, spreading patterns, and intensity to implement necessary protocols. Location analytics has been a helping hand for government bodies and healthcare organizations in mapping COVID-19 cases that are active and confirmed.
The obtainability of massive volumes of integrated location-based data across all sectors has made traditional BI tools ineffective for data correlation and analysis to comprehend altering business patterns and concerns across areas, companies require spatial data and analysis. This information is propelling the market forward. Customers can use geographic data to get answers to their questions concerning space assignment. Audits, design reviews, and other space-related tasks can all benefit from spatial data. These characteristics boost the utilization of geographical data in a variety of industries. Companies can utilize location analytics software to manage vast amounts of geographic data and gain real-time insights into changing customer preferences, company trends, and regulatory and compliance requirements. For example, locational data assists retailers in discovering the relationship between products, stores, customer preferences, needs, and customer types as they relate to various characteristics and metrics in the retail sub-segment. These variables and measurements have an impact on overall sales performance. Retailers can also use stock levels to efficiently manage warehouse deliveries to ensure adequate stock levels.
To know more about global location analytics market drivers, get in touch with our analysts here.
Privacy issues occur if location data is combined with extra personal information. After businesses start collecting data profiles, the danger of identity theft rises, particularly, if the data isn't kept secure. Criminals can utilize location data to figure out a person's current or anticipated future location, and if the data contains information that can be used to identify a person, it can be used to attack the individual. As a result, before employing location data obtained by location analytics tools, organizations should thoroughly evaluate all legal and privacy risks.
The rise of the Internet of Things (IoT) and the increasing volume of data generated by linked devices has resulted in a rise in the use of location analytics software. To maintain their competitiveness and market value, developing businesses require long-term business strategies. Therefore, the demand for location intelligence that provide location-based data insights is increasing gradually. For instance, in the current COVID-19 pandemic, hospitals, governments and various other departments are depending on location intelligence to check the spread of virus, active cases, fatalities and recoveries. This way location intelligence is providing ample opportunities for location analytics market.
To know more about global location analytics market opportunities, get in touch with our analysts here.
Source: Research Dive Analysis
The solutions sub-segment is predicted to have a dominating market share in the global market and register a revenue of $19,773.1 million during the forecast periodDue to its expanded viewpoint capabilities, spatial analysis is projected to see increasing usage in the solution market. It enables businesses to address complicated location-related issues and fosters fresh perceptions in order to improve decision-making. As a result, spatial analytics accounts for a major portion of revenue.
The services type is anticipated to have the fastest market growth, and it is predicted that the market shall generate a revenue of $18,305.8 million by 2028, growing from $5,126.3 million in 2020. Consulting, integration and implementation, and support and maintenance make up the services segment. Organizations can use support and maintenance services to learn about market trends, changing business conditions, consumer insights, and repair issues. Support and maintenance services are projected to be in high demand as a result of the creation of various custom applications and enhancements to existing products. These elements are propelling the services sub-segment forward.
Source: Research Dive Analysis
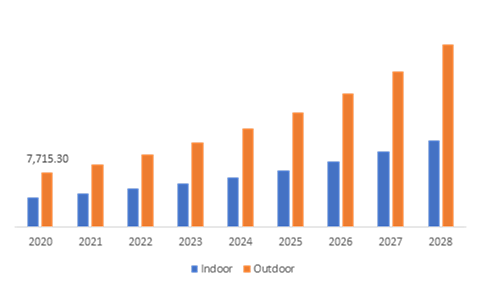
The outdoor location sub-segment of the global location analytics market is projected to have the fastest growth and it is projected to surpass $25,831.1 million by 2028, with an increase from $7,715.3 million in 2020. Outdoor analytics applications include weather forecasting, geographical maps, and land mapping. Location data is heavily used in the creation of multichannel marketing centers to enable offline campaigns, geo-marketing, customer location monitoring, data mapping, and logistics and transport management. The value of the sub-segment is driven by the development of these numerous outdoor apps that use geo-spatial and positioning services.
Source: Research Dive Analysis
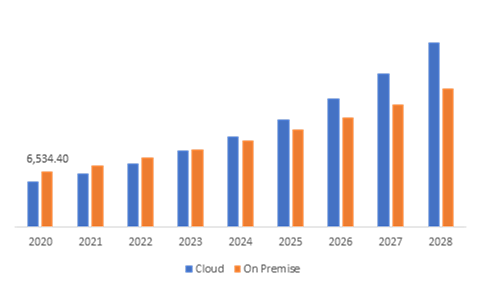
The on-premise sub-segment is predicted to have a dominating market share in the global market and is expected to register a revenue of $16,338.3 million during the forecast period. The need for on-premise corporate application software is being driven by an increase in concerns about improving internal processes and systems, security risks connected to cloud deployment, and a growth in demand for enterprise application software across multiple industry verticals. On-premise enterprise application software's data privacy and security are predicted to give a variety of market growth prospects.
The cloud sub-segment is anticipated to have the fastest market growth and it is predicted that the market shall generate a revenue of $21,740.6 million by 2028, growing from $5,365.9 million in 2020. One of the main reasons why businesses favor cloud deployment is the ability to supply functionality with better efficiency and flexibility. Because of these advantages, cloud-based deployment is expected to develop at a quicker rate over the projected period.
Source: Research Dive Analysis
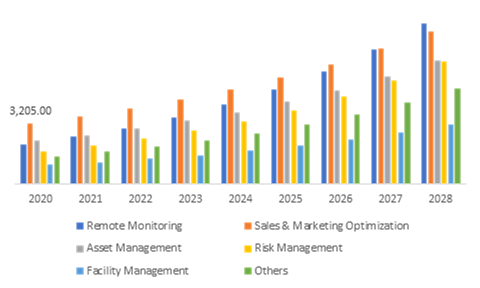
The sales & marketing optimization sub-segment is anticipated to have a dominating market share in the global market and register a revenue of $8,118.9 million during the analysis timeframe. Businesses can benefit from location intelligence by gaining the ability to interpret and analyze geographical data in order to improve customer experience, cut expenses, and boost overall efficiency. As a result, the usage of these services in sales and marketing applications allows organizations to analyze consumer behavior, spending patterns, and estimate sales, helping them to maximize their business profitability.
Source: Research Dive Analysis
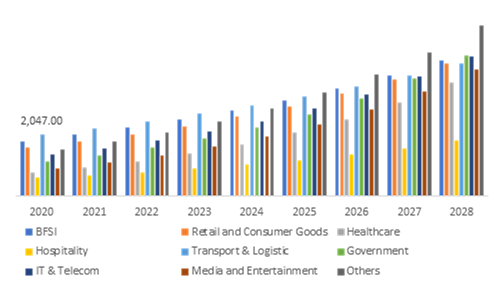
The transport & logistic sub-segment of the global location analytics market is predicted to have rapid growth and it is expected to surpass $4,384.3 million by 2028, with an increase from $2,047.0 million in 2020. Market growth is fueled by factors such as the expanding e-commerce industry, as well as an increase in reverse logistics operations and trade agreements. In addition, the growing acceptance of IoT-enabled linked devices and the expansion of tech-driven logistics services are likely to propel the sub-segment forward.
Source: Research Dive Analysis
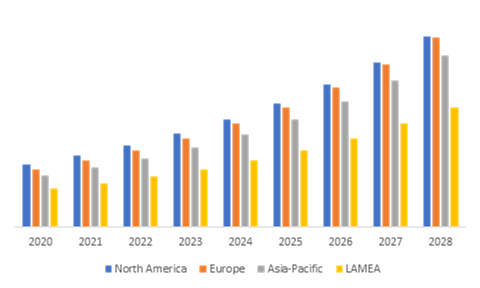
The Market for Location Analytics in North America to be the Most Dominant
The North America location analytics market accounted $3,562.9 million in 2020 and is projected to register a revenue of $10,791.2 million by 2028. Rising technology developments, increased industry standards for location-based technology, and increased government support are all contributing to the expansion in North America. In the location analytics sector, the region has seen the birth of startups. These variables will ultimately fuel demand in the region's location analytics industry.
The Market for Location Analytics in Asia-Pacific to be the Fastest Growing
The share of Asia-Pacific location analytics market is anticipated to grow at a CAGR of 16.5% by registering a revenue of $9,728.9 million by 2028. The expansion will be fueled by a rise in the use of location analytic solutions among firms that will heavily rely on risk management. Risk management software aids in the reduction of various hazards such as cyber-attacks, financial fraud, and data theft, creating a potential market opportunity in this region.
Source: Research Dive Analysis
Some of the leading location analytics market players are Google, Esri, Precisely, SAP SE, IBM Corporation, SAS Institute, Oracle, Microsoft, Cisco Systems, TomTom.
Porter’s Five Forces Analysis for the Global Location Analytics Market:
| Aspect | Particulars |
| Historical Market Estimations | 2018-2019 |
| Base Year for Market Estimation | 2019 |
| Forecast Timeline for Market Projection | 2020-2027 |
| Geographical Scope | North America, Europe, Asia-Pacific, LAMEA |
| Segmentation by Application Type |
|
| Segmentation by Deployment Type |
|
| Segmentation by Component Type |
|
| Segmentation by Location Type |
|
| Segmentation by Vertical type |
|
| Key Companies Profiled |
|
1.Research Methodology
1.1.Desk Research
1.2.Real time insights and validation
1.3.Forecast model
1.4.Assumptions and forecast parameters
1.4.1.Assumptions
1.4.2.Forecast parameters
1.5.Data sources
1.5.1.Primary
1.5.2.Secondary
2.Executive Summary
2.1.360° summary
2.2.By application type trends
2.3.By component type trends
2.4.By location type trends
2.5.By deployment type trends
2.6.By vertical type trends
3.Market overview
3.1.Market segmentation & definitions
3.2.Key takeaways
3.2.1.Top investment pockets
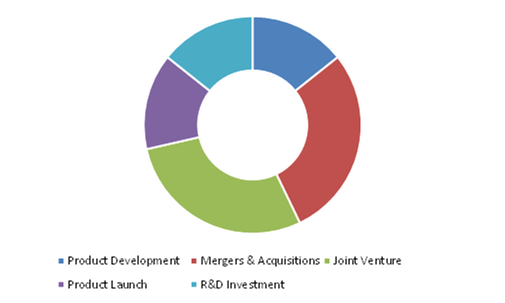
3.2.2.Top winning strategies
3.3.Porter’s five forces analysis
3.3.1.Bargaining power of consumers
3.3.2.Bargaining power of suppliers
3.3.3.Threat of new entrants
3.3.4.Threat of substitutes
3.3.5.Competitive rivalry in the market
3.4.Market dynamics
3.4.1.Drivers
3.4.2.Restraints
3.4.3.Opportunities
3.5.Technology landscape
3.6.Regulatory landscape
3.7.Patent landscape
3.8.Pricing overview
3.8.1.by application type
3.8.2.by component type
3.8.3.By location type
3.8.4.By deployment type
3.8.5.By vertical type
3.9.Market value chain analysis
3.9.1.Stress point analysis
3.9.2.Raw material analysis
3.9.3.Manufacturing process
3.9.4.Distribution channel analysis
3.9.5.Operating vendors
3.9.5.1.Raw material suppliers
3.9.5.2.Product manufacturers
3.9.5.3.Product distributors
3.10.Strategic overview
4.Locational Analytics Market, by application type
4.1.Remote Monitoring
4.1.1.Market size and forecast, by region, 2020-2028
4.1.2.Comparative market share analysis, 2020 & 2028
4.2.Sales & Marketing Optimization
4.2.1.Market size and forecast, by region, 2020-2028
4.2.2.Comparative market share analysis, 2020 & 2028
4.3.Asset Management
4.3.1.Market size and forecast, by region, 2020-2028
4.3.2.Comparative market share analysis, 2020 & 2028
4.4.Risk Management
4.4.1.Market size and forecast, by region, 2020-2028
4.4.2.Comparative market share analysis, 2020 & 2028
4.5.Facility Management
4.5.1.Market size and forecast, by region, 2020-2028
4.5.2.Comparative market share analysis, 2020 & 2028
4.6.Others
4.6.1.Market size and forecast, by region, 2020-2028
4.6.2.Comparative market share analysis, 2020 & 2028
5.Locational Analytics Market, by component type
5.1.Solution
5.1.1.Market size and forecast, by region, 2020-2028
5.1.2.Comparative market share analysis, 2020 & 2028
5.2.Services
5.2.1.Market size and forecast, by region, 2020-2028
5.2.2.Comparative market share analysis, 2020 & 2028
6.Locational Analytics Market, by location type
6.1.Indoor location
6.1.1.Market size and forecast, by region, 2020-2028
6.1.2.Comparative market share analysis, 2020 & 2028
6.2.Outdoor location
6.2.1.Market size and forecast, by region, 2020-2028
6.2.2.Comparative market share analysis, 2020 & 2028
7.Locational Analytics Market, by deployment type
7.1.cloud
7.1.1.Market size and forecast, by region, 2020-2028
7.1.2.Comparative market share analysis, 2020 & 2028
7.2.On-premises
7.2.1.Market size and forecast, by region, 2020-2028
7.2.2.Comparative market share analysis, 2020 & 2028
8.Locational Analytics Market, by vertical type
8.1.BFSI
8.1.1.Market size and forecast, by region, 2020-2028
8.1.2.Comparative market share analysis, 2020 & 2028
8.2.Retail
8.2.1.Market size and forecast, by region, 2020-2028
8.2.2.Comparative market share analysis, 2020 & 2028
8.3.Healthcare
8.3.1.Market size and forecast, by region, 2020-2028
8.3.2.Comparative market share analysis, 2020 & 2028
8.4.Hospitality
8.4.1.Market size and forecast, by region, 2020-2028
8.4.2.Comparative market share analysis, 2020 & 2028
8.5.Transport & Logistic
8.5.1.Market size and forecast, by region, 2020-2028
8.5.2.Comparative market share analysis, 2020 & 2028
8.6.Government
8.6.1.Market size and forecast, by region, 2020-2028
8.6.2.Comparative market share analysis, 2020 & 2028
8.7.IT & Telecom
8.7.1.Market size and forecast, by region, 2020-2028
8.7.2.Comparative market share analysis, 2020 & 2028
8.8.Media & Entertainment
8.8.1.Market size and forecast, by region, 2020-2028
8.8.2.Comparative market share analysis, 2020 & 2028
8.9.Others
8.9.1.Market size and forecast, by region, 2020-2028
8.9.2.Comparative market share analysis, 2020 & 2028
9.Location Analytics Market, by Region
9.1.North America
9.1.1.Market size and forecast, by application type, 2020-2028
9.1.2.Market size and forecast, by component type, 2020-2028
9.1.3.Market size and forecast, by location type, 2020-2028
9.1.4.Market size and forecast, by deployment type, 2020-2028
9.1.5.Market size and forecast, by vertical type, 2020-2028
9.1.6.Market size and forecast, by country, 2020-2028
9.1.7.Comparative market share analysis, 2020 & 2028
9.1.8.U.S.
9.1.8.1.Market size and forecast, by application type, 2020-2028
9.1.8.2.Market size and forecast, by component type, 2020-2028
9.1.8.3.Market size and forecast, by location type, 2020-2028
9.1.8.4.Market size and forecast, by deployment type, 2020-2028
9.1.8.5.Market size and forecast, by vertical type, 2020-2028
9.1.8.6.Comparative market share analysis, 2020 & 2028
9.1.9.Canada
9.1.9.1.Market size and forecast, by application type, 2020-2028
9.1.9.2.Market size and forecast, by component type, 2020-2028
9.1.9.3.Market size and forecast, by location type, 2020-2028
9.1.9.4.Market size and forecast, by deployment type, 2020-2028
9.1.9.5.Market size and forecast, by vertical type, 2020-2028
9.1.9.6.Comparative market share analysis, 2020 & 2028
9.1.10.Mexico
9.1.10.1.Market size and forecast, by application type, 2020-2028
9.1.10.2.Market size and forecast, by component type, 2020-2028
9.1.10.3.Market size and forecast, by location type, 2020-2028
9.1.10.4.Market size and forecast, by deployment type, 2020-2028
9.1.10.5.Market size and forecast, by vertical type, 2020-2028
9.1.10.6.Comparative market share analysis, 2020 & 2028
9.2.Europe
9.2.1.Market size and forecast, by application type, 2020-2028
9.2.2.Market size and forecast, by component type, 2020-2028
9.2.3.Market size and forecast, by location type, 2020-2028
9.2.4.Market size and forecast, by deployment type, 2020-2028
9.2.5.Market size and forecast, by vertical type, 2020-2028
9.2.6.Market size and forecast, by country, 2020-2028
9.2.7.Comparative market share analysis, 2020 & 2028
9.2.8.Germany
9.2.8.1.Market size and forecast, by application type, 2020-2028
9.2.8.2.Market size and forecast, by component type, 2020-2028
9.2.8.3.Market size and forecast, by location type, 2020-2028
9.2.8.4.Market size and forecast, by deployment type, 2020-2028
9.2.8.5.Market size and forecast, by vertical type, 2020-2028
9.2.8.6.Comparative market share analysis, 2020 & 2028
9.2.9.UK
9.2.9.1.Market size and forecast, by application type, 2020-2028
9.2.9.2.Market size and forecast, by component type, 2020-2028
9.2.9.3.Market size and forecast, by location type, 2020-2028
9.2.9.4.Market size and forecast, by deployment type, 2020-2028
9.2.9.5.Market size and forecast, by vertical type, 2020-2028
9.2.9.6.Comparative market share analysis, 2020 & 2028
9.2.9.7.Market size and forecast, by component type, 2020-2028
9.2.9.8.Market size and forecast, by location type, 2020-2028
9.2.9.9.Market size and forecast, by deployment type, 2020-2028
9.2.9.10.Market size and forecast, by vertical type, 2020-2028
9.2.9.11.Comparative market share analysis, 2020 & 2028
9.2.10.France
9.2.10.1.Market size and forecast, by application type, 2020-2028
9.2.10.2.Market size and forecast, by component type, 2020-2028
9.2.10.3.Market size and forecast, by location type, 2020-2028
9.2.10.4.Market size and forecast, by deployment type, 2020-2028
9.2.10.5.Market size and forecast, by vertical type, 2020-2028
9.2.10.6.Comparative market share analysis, 2020 & 2028
9.2.11.Spain
9.2.11.1.Market size and forecast, by application type, 2020-2028
9.2.11.2.Market size and forecast, by component type, 2020-2028
9.2.11.3.Market size and forecast, by location type, 2020-2028
9.2.11.4.Market size and forecast, by deployment type, 2020-2028
9.2.11.5.Market size and forecast, by vertical type, 2020-2028
9.2.11.6.Comparative market share analysis, 2020 & 2028
9.2.12.Italy
9.2.12.1.Market size and forecast, by application type, 2020-2028
9.2.12.2.Market size and forecast, by component type, 2020-2028
9.2.12.3.Market size and forecast, by location type, 2020-2028
9.2.12.4.Market size and forecast, by deployment type, 2020-2028
9.2.12.5.Market size and forecast, by vertical type, 2020-2028
9.2.12.6.Comparative market share analysis, 2020 & 2028
9.2.13.Rest of Europe
9.2.13.1.Market size and forecast, by application type, 2020-2028
9.2.13.2.Market size and forecast, by component type, 2020-2028
9.2.13.3.Market size and forecast, by location type, 2020-2028
9.2.13.4.Market size and forecast, by deployment type, 2020-2028
9.2.13.5.Market size and forecast, by vertical type, 2020-2028
9.2.13.6.Comparative market share analysis, 2020 & 2028
9.3.Asia-Pacific
9.3.1.Market size and forecast, by application type, 2020-2028
9.3.2.Market size and forecast, by component type, 2020-2028
9.3.3.Market size and forecast, by location type, 2020-2028
9.3.4.Market size and forecast, by deployment type, 2020-2028
9.3.5.Market size and forecast, by vertical type, 2020-2028
9.3.6.Market size and forecast, by country, 2020-2028
9.3.7.Comparative market share analysis, 2020 & 2028
9.3.8.China
9.3.8.1.Market size and forecast, by application type, 2020-2028
9.3.8.2.Market size and forecast, by component type, 2020-2028
9.3.8.3.Market size and forecast, by location type, 2020-2028
9.3.8.4.Market size and forecast, by deployment type, 2020-2028
9.3.8.5.Market size and forecast, by vertical type, 2020-2028
9.3.8.6.Comparative market share analysis, 2020 & 2028
9.3.9.Japan
9.3.9.1.Market size and forecast, by application type, 2020-2028
9.3.9.2.Market size and forecast, by component type, 2020-2028
9.3.9.3.Market size and forecast, by location type, 2020-2028
9.3.9.4.Market size and forecast, by deployment type, 2020-2028
9.3.9.5.Market size and forecast, by vertical type, 2020-2028
9.3.9.6.Comparative market share analysis, 2020 & 2028
9.3.10.India
9.3.10.1.Market size and forecast, by application type, 2020-2028
9.3.10.2.Market size and forecast, by component type, 2020-2028
9.3.10.3.Market size and forecast, by location type, 2020-2028
9.3.10.4.Market size and forecast, by deployment type, 2020-2028
9.3.10.5.Market size and forecast, by vertical type, 2020-2028
9.3.10.6.Comparative market share analysis, 2020 & 2028
9.3.11.Australia
9.3.11.1.Market size and forecast, by application type, 2020-2028
9.3.11.2.Market size and forecast, by component type, 2020-2028
9.3.11.3.Market size and forecast, by location type, 2020-2028
9.3.11.4.Market size and forecast, by deployment type, 2020-2028
9.3.11.5.Market size and forecast, by vertical type, 2020-2028
9.3.11.6.Comparative market share analysis, 2020 & 2028
9.3.12.South Korea
9.3.12.1.Market size and forecast, by application type, 2020-2028
9.3.12.2.Market size and forecast, by component type, 2020-2028
9.3.12.3.Market size and forecast, by location type, 2020-2028
9.3.12.4.Market size and forecast, by deployment type, 2020-2028
9.3.12.5.Market size and forecast, by vertical type, 2020-2028
9.3.12.6.Comparative market share analysis, 2020 & 2028
9.3.13.Rest of Asia Pacific
9.3.13.1.Market size and forecast, by application type, 2020-2028
9.3.13.2.Market size and forecast, by component type, 2020-2028
9.3.13.3.Market size and forecast, by location type, 2020-2028
9.3.13.4.Market size and forecast, by deployment type, 2020-2028
9.3.13.5.Market size and forecast, by vertical type, 2020-2028
9.3.13.6.Comparative market share analysis, 2020 & 2028
9.4.LAMEA
9.4.1.Market size and forecast, by application type, 2020-2028
9.4.2.Market size and forecast, by component type, 2020-2028
9.4.3.Market size and forecast, by location type, 2020-2028
9.4.4.Market size and forecast, by deployment type, 2020-2028
9.4.5.Market size and forecast, by vertical type, 2020-2028
9.4.6.Market size and forecast, by country, 2020-2028
9.4.7.Comparative market share analysis, 2020 & 2028
9.4.8.Latin America
9.4.8.1.Market size and forecast, by application type, 2020-2028
9.4.8.2.Market size and forecast, by component type, 2020-2028
9.4.8.3.Market size and forecast, by location type, 2020-2028
9.4.8.4.Market size and forecast, by deployment type, 2020-2028
9.4.8.5.Market size and forecast, by vertical type, 2020-2028
9.4.8.6.Comparative market share analysis, 2020 & 2028
9.4.9.Middle East
9.4.9.1.Market size and forecast, by application type, 2020-2028
9.4.9.2.Market size and forecast, by component type, 2020-2028
9.4.9.3.Market size and forecast, by location type, 2020-2028
9.4.9.4.Market size and forecast, by deployment type, 2020-2028
9.4.9.5.Market size and forecast, by vertical type, 2020-2028
9.4.9.6.Comparative market share analysis, 2020 & 2028
9.4.10.Africa
9.4.10.1.Market size and forecast, by application type, 2020-2028
9.4.10.2.Market size and forecast, by component type, 2020-2028
9.4.10.3.Market size and forecast, by location type, 2020-2028
9.4.10.4.Market size and forecast, by deployment type, 2020-2028
9.4.10.5.Market size and forecast, by vertical type, 2020-2028
9.4.10.6.Comparative market share analysis, 2020 & 2028
10.Company profiles
10.1.Google
10.1.1.Business overview
10.1.2.Financial performance
10.1.3.Product portfolio
10.1.4.Recent strategic moves & developments
10.1.5.SWOT analysis
10.2.Esri
10.2.1.Business overview
10.2.2.Financial performance
10.2.3.Product portfolio
10.2.4.Recent strategic moves & developments
10.2.5.SWOT analysis
10.3.Precisely
10.3.1.Business overview
10.3.2.Financial performance
10.3.3.Product portfolio
10.3.4.Recent strategic moves & developments
10.3.5.SWOT analysis
10.4.SAP SE
10.4.1.Business overview
10.4.2.Financial performance
10.4.3.Product portfolio
10.4.4.Recent strategic moves & developments
10.4.5.SWOT analysis
10.5.IBM Corporation
10.5.1.Business overview
10.5.2.Financial performance
10.5.3.Product portfolio
10.5.4.Recent strategic moves & developments
10.5.5.SWOT analysis
10.6.SAS Institute
10.6.1.Business overview
10.6.2.Financial performance
10.6.3.Product portfolio
10.6.4.Recent strategic moves & developments
10.6.5.SWOT analysis
10.7.Oracle
10.7.1.Business overview
10.7.2.Financial performance
10.7.3.Product portfolio
10.7.4.Recent strategic moves & developments
10.7.5.SWOT analysis
10.8.Microsoft
10.8.1.Business overview
10.8.2.Financial performance
10.8.3.Product portfolio
10.8.4.Recent strategic moves & developments
10.8.5.SWOT analysis
10.9.Cisco systems
10.9.1.Business overview
10.9.2.Financial performance
10.9.3.Product portfolio
10.9.4.Recent strategic moves & developments
10.9.5.SWOT analysis
10.10.TomTom
10.10.1.Business overview
10.10.2.Financial performance
10.10.3.Product portfolio
10.10.4.Recent strategic moves & developments
10.10.5.SWOT analysis
* Taxes/Fees, If applicable will be added during checkout. All prices in USD.
Have a question ?
Enquire To BuyNeed to add more ?
Request Customization